


起因:看了cesium官网卫星通信示例发现只有cmzl版本的,决定自己动手写一个。欢迎大家一起探讨,评论留言。
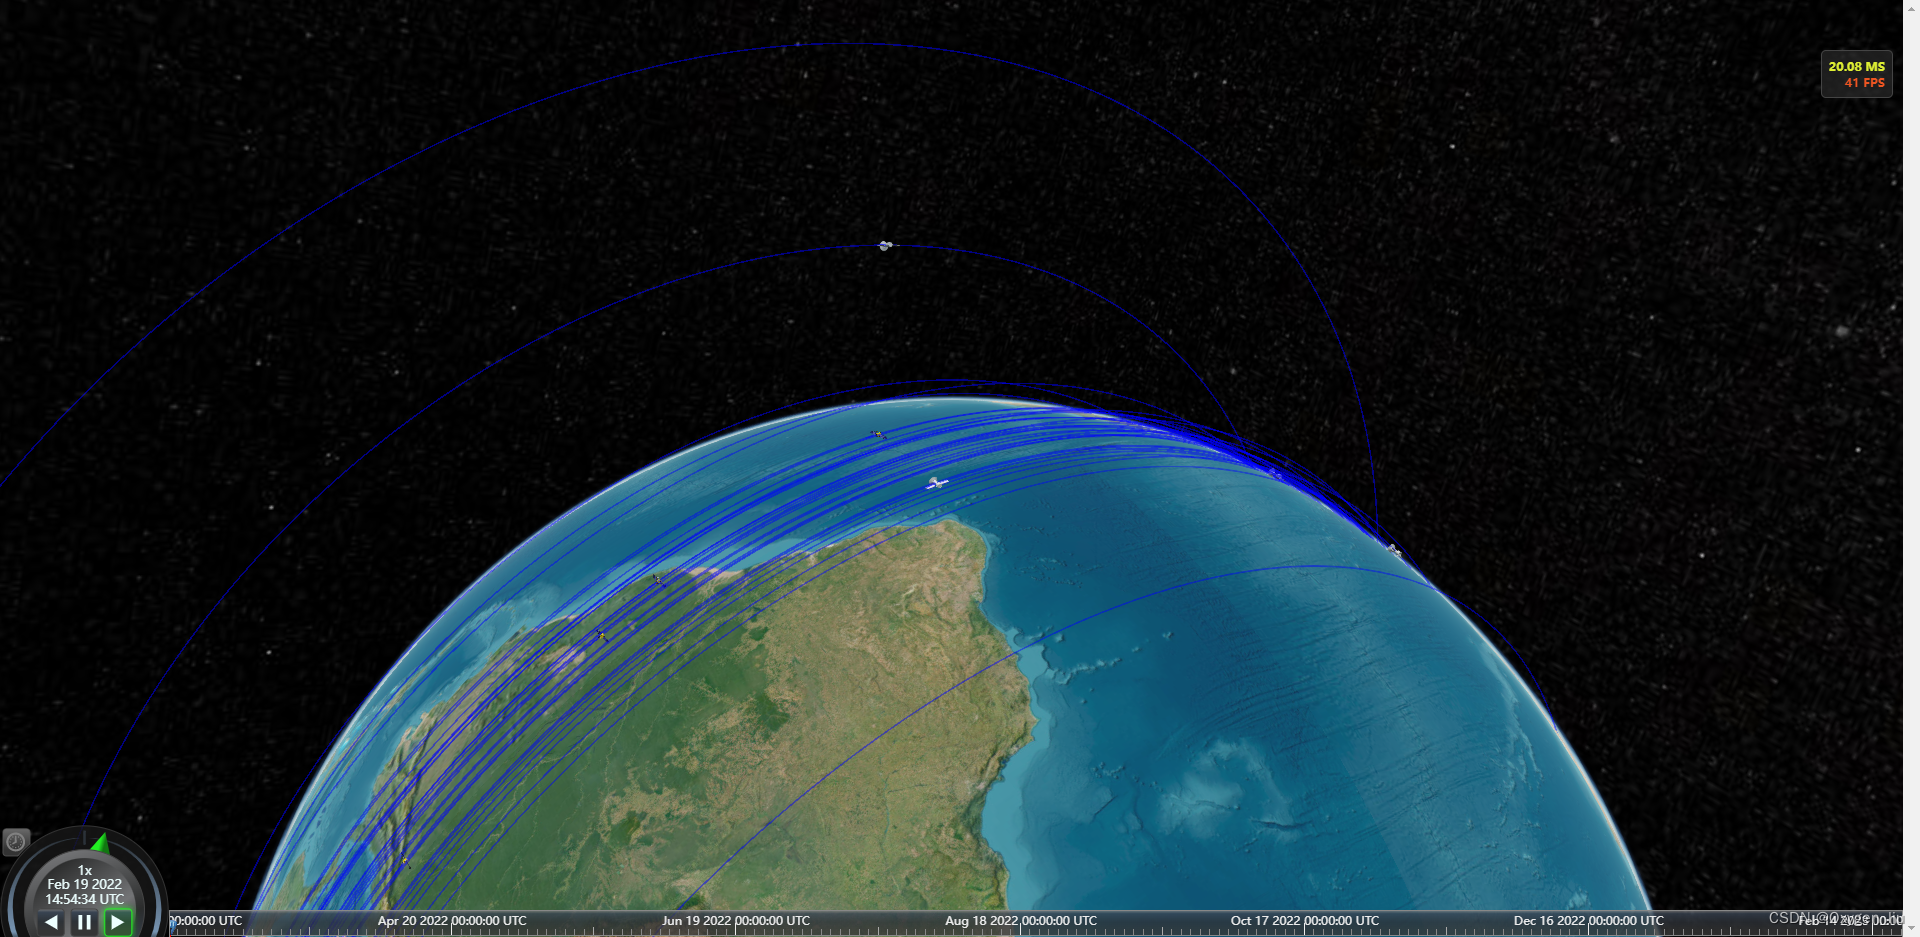
效果
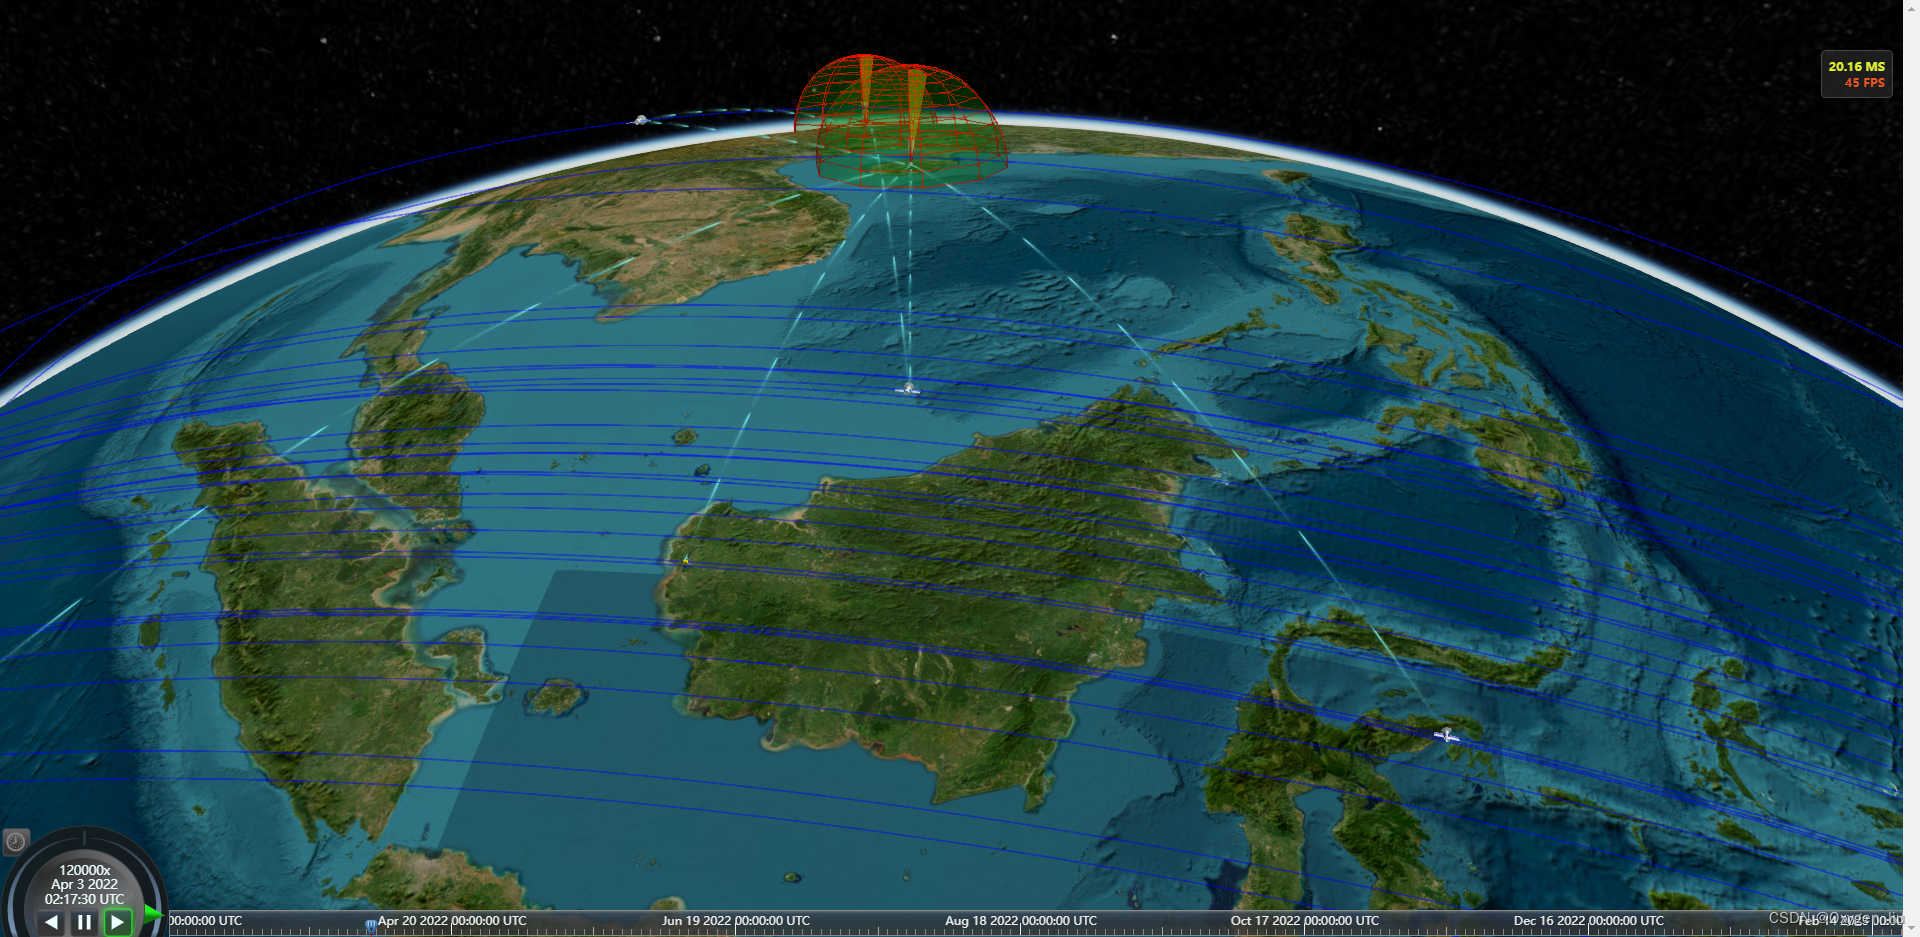
全部代码在最后
起步
寻找卫星轨迹数据,在网站space-track上找的,自己注册账号QQ邮箱即可。
- 卫星轨道类型 轨道高度 卫星用途
- LEO (低地球轨道) 500-2000km 对地观测、测地、通信、导航等
- MEO (中地球轨道) 2000-35786km 导航
- GEO(地球静止轨道) 35786km 通信 导航、气象观测等
- SSO (太阳同步轨道) <6000km 观测等
- IGSO(倾斜地球同步轨道) 35786km 导航
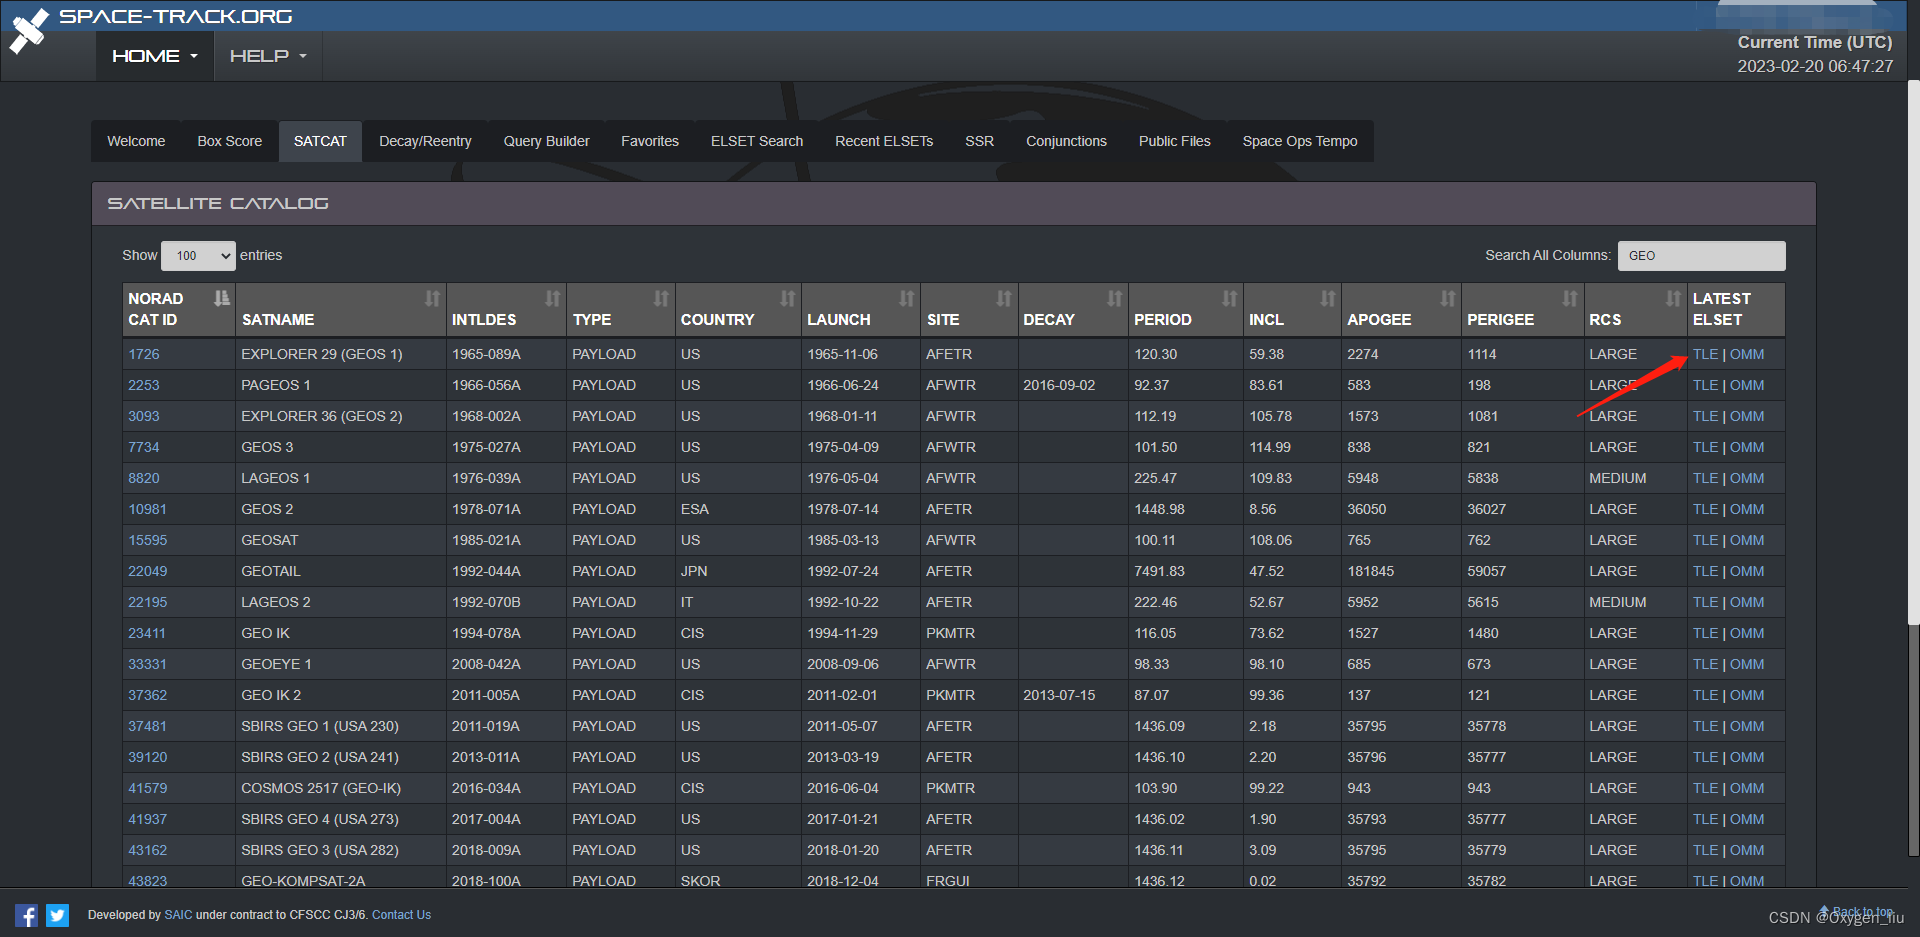
点击TLE就可以得到卫星的两个轨道数据
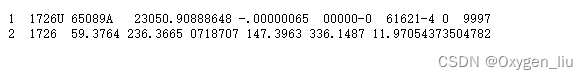
当然这个数据需要相对应的插件satellite.js转换成我们熟悉的经纬高;
拔下来的数据存入json文件中:
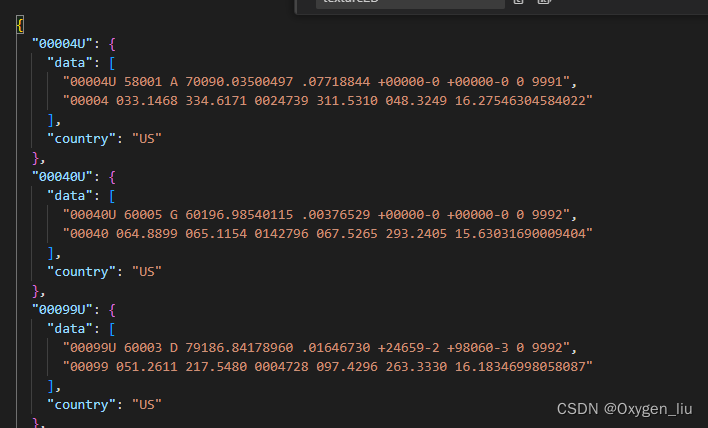
最后构造卫星轨迹对象
import {
  twoline2satrec, gstime, eciToGeodetic,
  PositionAndVelocity, propagate, EciVec3,
  degreesLong
} from 'satellite.js';
 fetch("data/points.json").then(res => res.json()).then(data => {
    for (const key in data) {
      if (Object.prototype.hasOwnProperty.call(data, key)) {
        const element = data[key];
        const satrec = twoline2satrec(element.data[0], element.data[1]);
        const positionAndVelocity: PositionAndVelocity = propagate(satrec, time);
        const positionEci = positionAndVelocity.position as EciVec3<number>;
        obj[key] = {
          country: element.country,
          times: [],
          positions: []
        };
        let lon, lat, alt;
        //一年365天 一天为间隔
        for (let index = min; index <= nowTime; index = index + 86400000) {
          const gmst = gstime(new Date(index));
          const positionGd = eciToGeodetic(positionEci, gmst)
          lon = positionGd.longitude,
            lat = positionGd.latitude,
            alt = positionGd.height;
          obj[key].times.push(index)
          obj[key].positions.push([degreesLong(lon), degreesLong(lat), alt])
        }
      }
    }
  })
加载卫星和轨迹线
//用数据集方便管理
const satellites = new Cesium.CustomDataSource("satellite");
const polylines = new Cesium.CustomDataSource("statelliteLine");
function computeCirclularFlight(arr: Obj, hasLine: boolean = true) {
  for (const key in arr) {
    if (Object.prototype.hasOwnProperty.call(arr, key)) {
      const element = arr[key];
      const property = new Cesium.SampledPositionProperty();
      const length = element.positions.length
      const positions: number[] = []
      let p, t
      for (let index = 0; index < length; index++) {
        p = element.positions[index]
        t = element.times[index]
        property.addSample(Cesium.JulianDate.addHours(Cesium.JulianDate.fromDate(new Date(t)), 8, new Cesium.JulianDate()), Cesium.Cartesian3.fromDegrees(p[0], p[1], p[2]));
        positions.push(...element.positions[index])
      }
      satellites.entities.add({
        id: key,
        model: {
          uri: element.country === 'US' ? 'models/satellite/satellite1/Satellite.gltf'
            : element.country === 'PRC' ? 'models/satellite/satellite2/10477_Satellite_v1_L3.gltf' : 'models/satellite/satellite3/satellite.gltf',
          minimumPixelSize: 32
        },
        position: property,
      });
      if (hasLine)
        polylines.entities.add({
          id: key,
          polyline: {
            width: 1,
            material: Cesium.Color.BLUE.withAlpha(.5),
            positions: Cesium.Cartesian3.fromDegreesArrayHeights(positions)
          }
        })
    }
  }
  viewer.dataSources.add(satellites);
  viewer.dataSources.add(polylines);
}
加载卫星和轨迹的效果
加载地面雷达
const radars = new Cesium.CustomDataSource("radar");
const radarpoints: {
  id: string;
  lon: number;
  lat: number;
  radius: number
}[] = [
    { id: 'radar1', lon: 104, lat: 34, radius: 300000 },
    { id: 'radar2', lon: -100, lat: 55, radius: 300000 },
    { id: 'radar3', lon: 109.70841, lat: 19.365791, radius: 300000 },
  ]
  //添加雷达
  radarpoints.forEach(i => {
    createRadar(i.id, i.lon, i.lat, i.radius)
  })
  function createRadar(id: string, lon: number, lat: number, radius: number) {
  radars.entities.add({
    id: id,
    model: {
      uri: 'models/antenna_07.glb',
      minimumPixelSize: 32,
    },
    position: Cesium.Cartesian3.fromDegrees(lon, lat),
  })
  viewer.dataSources.add(radars)
  new LCesiumApi.RadarPrimitive({
    radius: radius,
    stackPartitions: 10,
    slicePartitions: 10,
    stackDegrees: {
      x: 0,
      y: 90,
    },
    sliceDegrees: {
      x: 0,
      y: 360,
    },
    color: Cesium.Color.GREEN.withAlpha(0.2),
    lineColor: Cesium.Color.RED,
    scanColor: Cesium.Color.YELLOW.withAlpha(0.2),
    scanLineColor: Cesium.Color.RED,
    scene: viewer.scene,
    center: Cesium.Cartesian3.fromDegrees(lon, lat),
    scanSpeed: 5000,
    show: true,
    scan: true,
  });
}
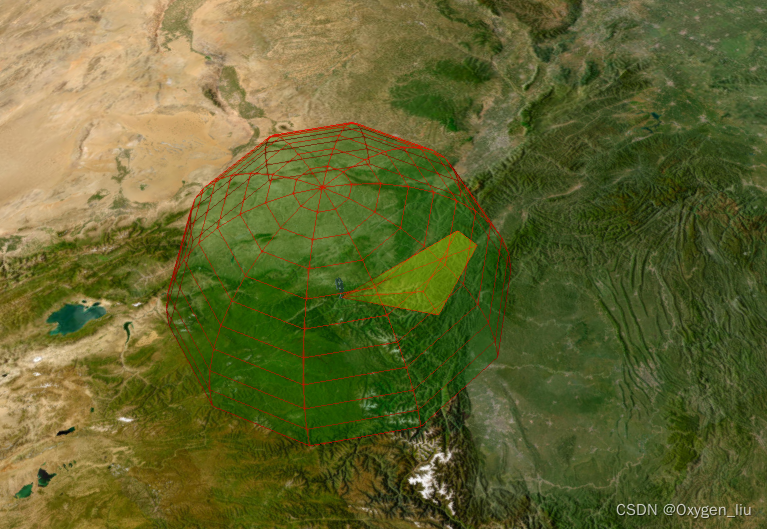
关于雷达效果在我之前文章里面有
卫星与地面雷达通信
- 暂时只做了m(雷达)-n(卫星),m*n;没有做卫星之间的通信判断,不过原理都是一样的.
- 网上搜索了一下通信距离一般是3,580km
- 计算此时卫星距雷达的距离,其实就是计算带高度的经纬度之间的距离
Cartesian3.distance(point1: Cartesian3, point2: Cartesian3)
当卫星和地面卫星通信时,创建连线,离开设置为隐藏。
function computeRange() {
  satellites.entities.values.forEach(i => {
    radars.entities.values.forEach(j => {
      const po1 = i.position?.getValue(viewer.clock.currentTime)
      const po2 = j.position?.getValue(viewer.clock.currentTime)
      if (po1 && po2) {
        const len = LCesiumApi.Tool.getDistanceFromCartesian3(po1, po2)
        if (len <= communicationRange) {
          if (showFlyObject[`${i.id}-${j.id}`]) {
            showFlyObject[`${i.id}-${j.id}`].show = true
            showFlyObject[`${i.id}-${j.id}`].po1 = LCesiumApi.Tramsform.degreesFromCartesian(po1)
            showFlyObject[`${i.id}-${j.id}`].po2 = LCesiumApi.Tramsform.degreesFromCartesian(po2)
          }
          else {
            showFlyObject[`${i.id}-${j.id}`] = {
              entity: null,
              show: true,
              po1: LCesiumApi.Tramsform.degreesFromCartesian(po1),
              po2: LCesiumApi.Tramsform.degreesFromCartesian(po2)
            }
          }
        } else {
          if (showFlyObject[`${i.id}-${j.id}`]) showFlyObject[`${i.id}-${j.id}`].show = false
        }
      }
    })
  })
  setLine()
}
function setLine() {
  for (const key in showFlyObject) {
    if (Object.prototype.hasOwnProperty.call(showFlyObject, key)) {
      const element = showFlyObject[key];
      if (element.entity === null) element.entity = createFlyLine(key)
      element.entity.show = element.show
    }
  }
}
function createFlyLine(id: string) {
  var material = new PolylineTrailLinkMaterialProperty({
    color: Cesium.Color.fromCssColorString('#7ffeff'),
    duration: 3000,
  });
  const line = Connection.entities.add({
    id: id,
    polyline: {
      positions: new Cesium.CallbackProperty(() => {
        return Cesium.Cartesian3.fromDegreesArrayHeights([
          showFlyObject[id].po1.longitude,
          showFlyObject[id].po1.latitude,
          showFlyObject[id].po1.height,
          showFlyObject[id].po2.longitude,
          showFlyObject[id].po2.latitude,
          showFlyObject[id].po2.height,
        ])
      }, false),
      width: 8,
      material
    }
  })
  return line
}
完整代码
<template>
  <Map @onViewerLoaded="onViewerLoaded" :options="options" />
</template>
<script lang="ts" setup>
import Map from "@/components/Cesium/lib/Map.vue";
import * as Cesium from "cesium";
import { message } from 'ant-design-vue'
import {
  twoline2satrec, gstime, eciToGeodetic,
  PositionAndVelocity, propagate, EciVec3,
  degreesLong
} from 'satellite.js';
import LCesiumApi from "@lib/main";
//@ts-ignore
import { PolylineTrailLinkMaterialProperty } from './PolylineTrailMaterialProperty.js'
const options = {
  imageryProvider: new Cesium.ArcGisMapServerImageryProvider({
    url: 'https://services.arcgisonline.com/ArcGIS/rest/services/World_Imagery/MapServer'
  }),
}
let viewer: Cesium.Viewer
let start: Cesium.JulianDate
let stop: Cesium.JulianDate
let handler: Cesium.ScreenSpaceEventHandler;
const communicationRange = 3580000;
const time = new Date()
let max = time.getTime()
let year = 31622400000;
let min = max - year;
type Obj = {
  [index: string]: {
    country: string;
    times: number[];
    positions: [[number, number, number]] | number[][]
  }
}
const showFlyObject: {
  [index: string]: any
} = {}
let obj: Obj = {}
const radarpoints: {
  id: string;
  lon: number;
  lat: number;
  radius: number
}[] = [
    { id: 'radar1', lon: 104, lat: 34, radius: 300000 },
    { id: 'radar2', lon: -100, lat: 55, radius: 300000 },
    { id: 'radar3', lon: 109.70841, lat: 19.365791, radius: 300000 },
  ]
const onViewerLoaded = (Viewer: Cesium.Viewer) => {
  viewer = Viewer
  handler = new Cesium.ScreenSpaceEventHandler(viewer.canvas);
  //设置时间轴
  setTimeline()
  //读取卫星分布两行数据
  const nowTime = time.getTime()
  fetch("data/points.json").then(res => res.json()).then(data => {
    for (const key in data) {
      if (Object.prototype.hasOwnProperty.call(data, key)) {
        const element = data[key];
        const satrec = twoline2satrec(element.data[0], element.data[1]);
        const positionAndVelocity: PositionAndVelocity = propagate(satrec, time);
        const positionEci = positionAndVelocity.position as EciVec3<number>;
        obj[key] = {
          country: element.country,
          times: [],
          positions: []
        };
        let lon, lat, alt;
        //一年365天 一天为间隔
        for (let index = min; index <= nowTime; index = index + 86400000) {
          const gmst = gstime(new Date(index));
          const positionGd = eciToGeodetic(positionEci, gmst)
          lon = positionGd.longitude,
            lat = positionGd.latitude,
            alt = positionGd.height;
          obj[key].times.push(index)
          obj[key].positions.push([degreesLong(lon), degreesLong(lat), alt])
        }
      }
    }
    computeCirclularFlight(obj)
  })
  //添加点击事件
  addPick()
  //添加雷达
  radarpoints.forEach(i => {
    createRadar(i.id, i.lon, i.lat, i.radius)
  })
  //添加过境扫描
  ; (viewer as any).frameUpdate.addEventListener((delta: any) => {
    computeRange()
  });
}
function setTimeline() {
  start = Cesium.JulianDate.fromDate(new Date(min));  // 获取当前时间 这不是国内的时间
  start = Cesium.JulianDate.addHours(start, 8, new Cesium.JulianDate());  // 添加八小时,得到我们东八区的北京时间
  stop = Cesium.JulianDate.fromDate(new Date(max));  // 设置一个结束时间,意思是360秒之后时间结束
  viewer.clock.startTime = start.clone();   // 给cesium时间轴设置开始的时间,也就是上边的东八区时间
  viewer.clock.stopTime = stop.clone();     // 设置cesium时间轴设置结束的时间
  viewer.clock.currentTime = start.clone(); // 设置cesium时间轴设置当前的时间
  viewer.clock.clockRange = Cesium.ClockRange.LOOP_STOP;  // 时间结束了,再继续重复来一遍
  //时间变化来控制速度 // 时间速率,数字越大时间过的越快
  viewer.clock.multiplier = 1;
  //给时间线设置边界
  viewer.timeline.zoomTo(start, stop);
}
const satellites = new Cesium.CustomDataSource("satellite");
const polylines = new Cesium.CustomDataSource("statelliteLine");
const radars = new Cesium.CustomDataSource("radar");
const Connection = new Cesium.CustomDataSource("connection");
function computeCirclularFlight(arr: Obj, hasLine: boolean = true) {
  for (const key in arr) {
    if (Object.prototype.hasOwnProperty.call(arr, key)) {
      const element = arr[key];
      const property = new Cesium.SampledPositionProperty();
      const length = element.positions.length
      const positions: number[] = []
      let p, t
      for (let index = 0; index < length; index++) {
        p = element.positions[index]
        t = element.times[index]
        property.addSample(Cesium.JulianDate.addHours(Cesium.JulianDate.fromDate(new Date(t)), 8, new Cesium.JulianDate()), Cesium.Cartesian3.fromDegrees(p[0], p[1], p[2]));
        positions.push(...element.positions[index])
      }
      satellites.entities.add({
        id: key,
        model: {
          uri: element.country === 'US' ? 'models/satellite/satellite1/Satellite.gltf'
            : element.country === 'PRC' ? 'models/satellite/satellite2/10477_Satellite_v1_L3.gltf' : 'models/satellite/satellite3/satellite.gltf',
          minimumPixelSize: 32
        },
        position: property,
      });
      if (hasLine)
        polylines.entities.add({
          id: key,
          polyline: {
            width: 1,
            material: Cesium.Color.BLUE.withAlpha(.5),
            positions: Cesium.Cartesian3.fromDegreesArrayHeights(positions)
          }
        })
    }
  }
  viewer.dataSources.add(satellites);
  viewer.dataSources.add(polylines);
  viewer.dataSources.add(Connection)
}
const addPick = () => {
  handler.setInputAction((movement: any) => {
    const pickedObject = viewer.scene.pick(movement.position);
    if (Cesium.defined(pickedObject)) {
      message.info(pickedObject.id.id)
    }
  }, Cesium.ScreenSpaceEventType.LEFT_CLICK)
}
function createRadar(id: string, lon: number, lat: number, radius: number) {
  radars.entities.add({
    id: id,
    model: {
      uri: 'models/antenna_07.glb',
      minimumPixelSize: 32,
    },
    position: Cesium.Cartesian3.fromDegrees(lon, lat),
  })
  viewer.dataSources.add(radars)
  new LCesiumApi.RadarPrimitive({
    radius: radius,
    stackPartitions: 10,
    slicePartitions: 10,
    stackDegrees: {
      x: 0,
      y: 90,
    },
    sliceDegrees: {
      x: 0,
      y: 360,
    },
    color: Cesium.Color.GREEN.withAlpha(0.2),
    lineColor: Cesium.Color.RED,
    scanColor: Cesium.Color.YELLOW.withAlpha(0.2),
    scanLineColor: Cesium.Color.RED,
    scene: viewer.scene,
    center: Cesium.Cartesian3.fromDegrees(lon, lat),
    scanSpeed: 5000,
    show: true,
    scan: true,
  });
}
function computeRange() {
  satellites.entities.values.forEach(i => {
    radars.entities.values.forEach(j => {
      const po1 = i.position?.getValue(viewer.clock.currentTime)
      const po2 = j.position?.getValue(viewer.clock.currentTime)
      if (po1 && po2) {
        const len = LCesiumApi.Tool.getDistanceFromCartesian3(po1, po2)
        if (len <= communicationRange) {
          if (showFlyObject[`${i.id}-${j.id}`]) {
            showFlyObject[`${i.id}-${j.id}`].show = true
            showFlyObject[`${i.id}-${j.id}`].po1 = LCesiumApi.Tramsform.degreesFromCartesian(po1)
            showFlyObject[`${i.id}-${j.id}`].po2 = LCesiumApi.Tramsform.degreesFromCartesian(po2)
          }
          else {
            showFlyObject[`${i.id}-${j.id}`] = {
              entity: null,
              show: true,
              po1: LCesiumApi.Tramsform.degreesFromCartesian(po1),
              po2: LCesiumApi.Tramsform.degreesFromCartesian(po2)
            }
          }
        } else {
          if (showFlyObject[`${i.id}-${j.id}`]) showFlyObject[`${i.id}-${j.id}`].show = false
        }
      }
    })
  })
  setLine()
}
function setLine() {
  for (const key in showFlyObject) {
    if (Object.prototype.hasOwnProperty.call(showFlyObject, key)) {
      const element = showFlyObject[key];
      if (element.entity === null) element.entity = createFlyLine(key)
      element.entity.show = element.show
    }
  }
}
function createFlyLine(id: string) {
  var material = new PolylineTrailLinkMaterialProperty({
    color: Cesium.Color.fromCssColorString('#7ffeff'),
    duration: 3000,
  });
  const line = Connection.entities.add({
    id: id,
    polyline: {
      positions: new Cesium.CallbackProperty(() => {
        return Cesium.Cartesian3.fromDegreesArrayHeights([
          showFlyObject[id].po1.longitude,
          showFlyObject[id].po1.latitude,
          showFlyObject[id].po1.height,
          showFlyObject[id].po2.longitude,
          showFlyObject[id].po2.latitude,
          showFlyObject[id].po2.height,
        ])
      }, false),
      width: 8,
      material
    }
  })
  return line
}
</script>


 192
192


 被折叠的 条评论
为什么被折叠?
被折叠的 条评论
为什么被折叠?
 到【灌水乐园】发言


