


Python-爬取历史地震数据并可视化
主要是通过模拟浏览器请求,获取网页源代码。然后利用xpath解析数据,保存到Excel表格中,或者Mysql数据库中。
- 爬虫地址
http://www.ceic.ac.cn/speedsearch
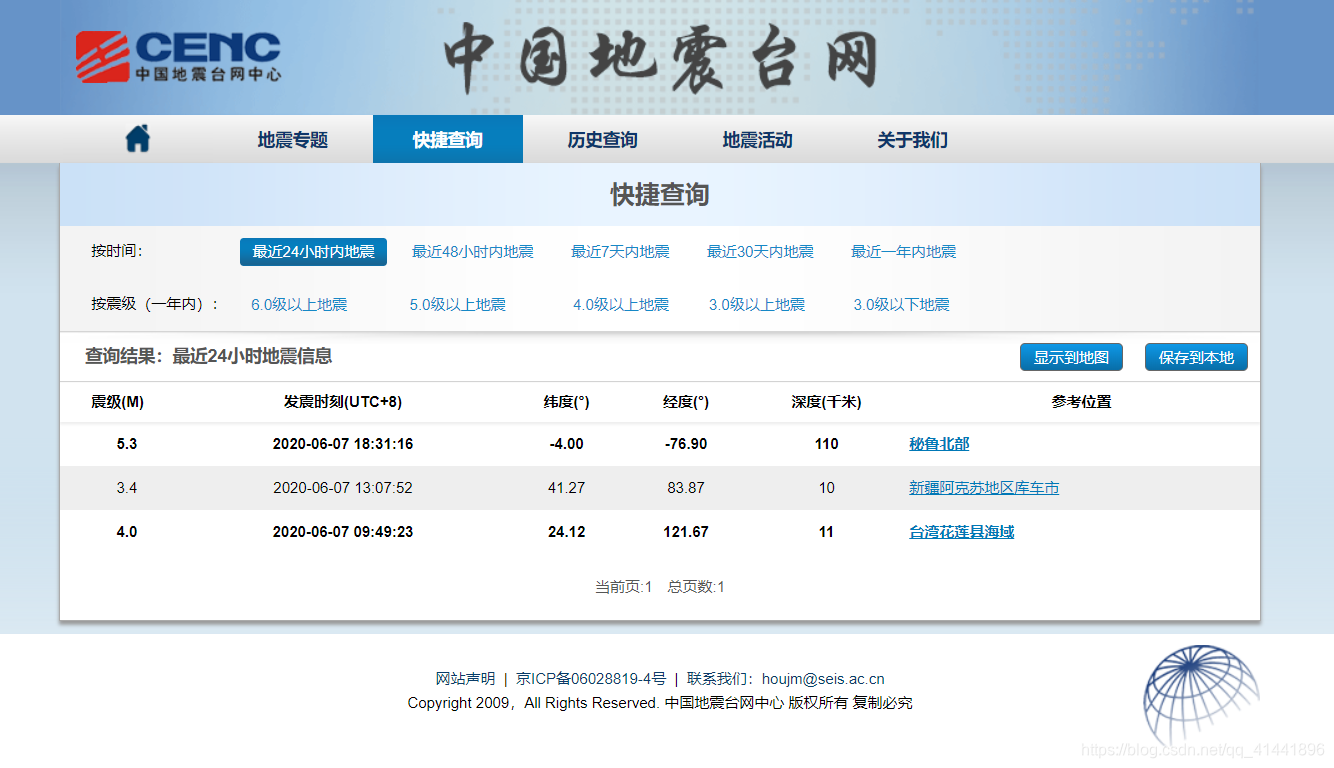
- 成果预览
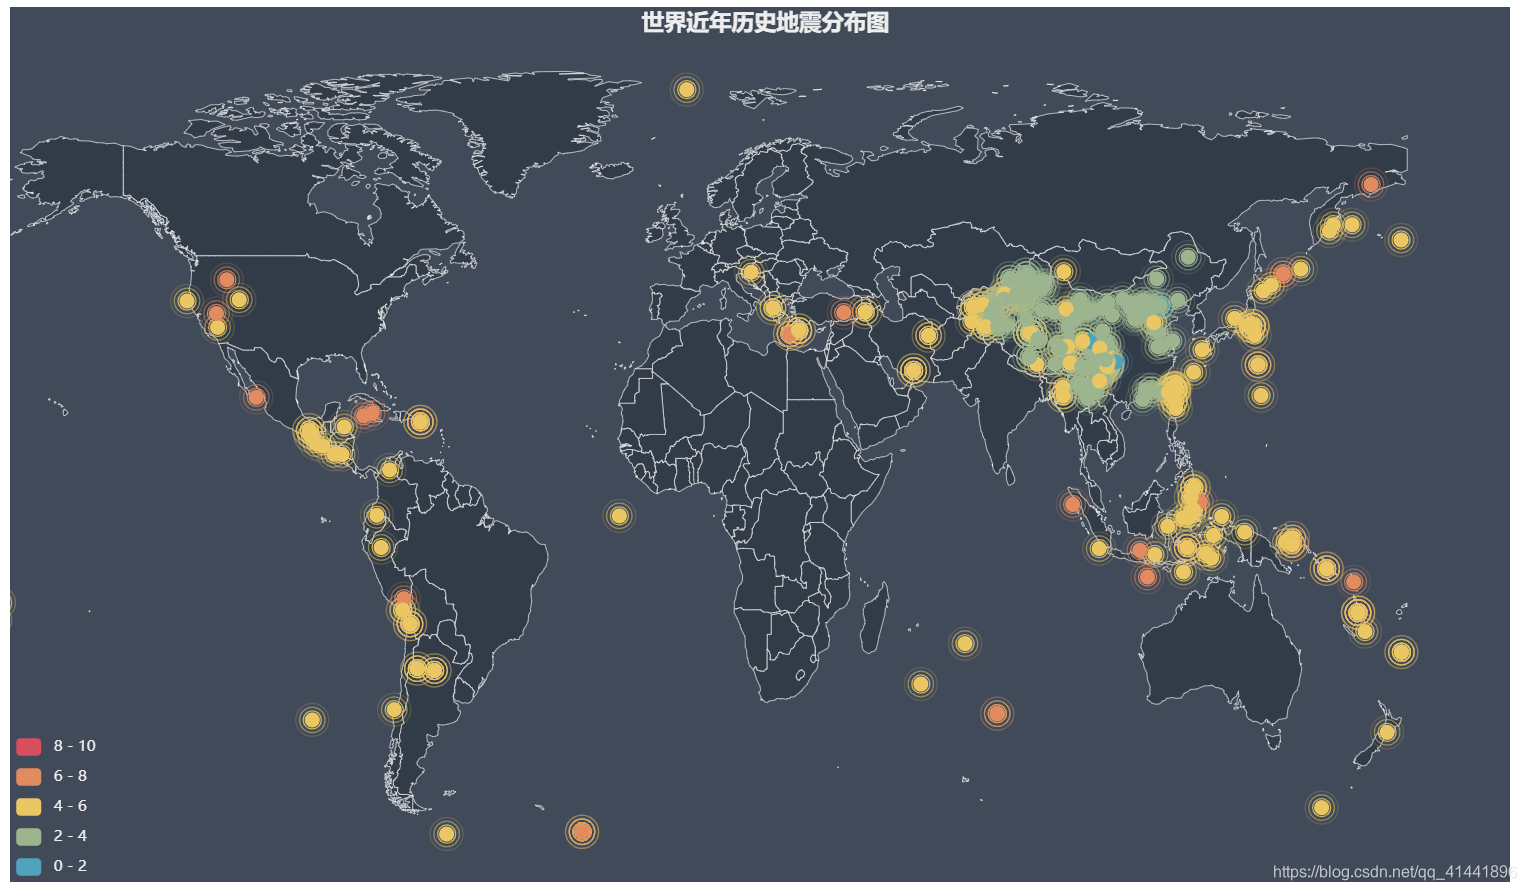
全球历史地震数据
- 实现代码
# -*- coding: utf-8 -*-
"""
@File : request200606_中国地震台网.py
@Author : fungis@163.com
@Time : 2020/05/06 09:28
@notice : http://www.ceic.ac.cn/speedsearch
"""
import datetime
import requests
from lxml import etree
import pymysql
import pandas as pd
from pyecharts import options as opts
from pyecharts.charts import Geo
from pyecharts.globals import ChartType, ThemeType
# 定义一组变量
earthquake_n = []
earthquake_t = []
earthquake_location_lat = []
earthquake_location_lon = []
earthquake_location = []
earthquake_url = []
earthquake_deapth = []
earrh_data = []
geo_location = {}
geo_data = []
geo_attrs = []
geo_values = []
# 获取网页源代码
def Get_html(url: object, params: object) -> object:
header = {'User-Agent': 'Mozilla/5.0'}
params = params
r = requests.get(url, params=params, headers=header)
print(r.url)
if r.status_code == 200:
r.encoding = r.apparent_encoding
# print(r.text)
html = r.text
else:
print("网页爬取异常")
html = "网页爬取异常"
return (html)
# 解析、提取网页源代码
def Get_data(html):
html = etree.HTML(html)
trs = html.xpath("//div[@class='title-content']/div[@class='speedquery']/div[@id='speed-search']/table["
"@class='speed-table1']/tr")
for tr in trs:
earthquake_m1 = tr.xpath("./td[1]/text()")
earthquake_t1 = tr.xpath("./td[2]/text()")
earthquake_location_lat1 = tr.xpath("./td[3]/text()")
earthquake_location_lon1 = tr.xpath("./td[4]/text()")
earthquake_deapth1 = tr.xpath("./td[5]/text()")
earthquake_location1 = tr.xpath("./td[6]/a/text()")
earthquake_url1 = tr.xpath("./td[6]/a/@href")
# print(earthquake_m1, earthquake_t1, earthquake_location_lat1, earthquake_location_lon1, earthquake_deapth1,
# earthquake_location1, earthquake_url1)
try:
earthquake_n.append(earthquake_m1[0])
earthquake_t.append(earthquake_t1[0])
earthquake_location_lat.append(earthquake_location_lat1[0])
earthquake_location_lon.append(earthquake_location_lon1[0])
earthquake_deapth.append(earthquake_deapth1[0])
earthquake_location.append(earthquake_location1[0])
earthquake_url.append(earthquake_url1[0])
except:
# print("异常")
pass
for i in range(0, len(earthquake_n) - 1):
earrh_data.append((earthquake_n[i], earthquake_t[i], earthquake_location_lat[i], earthquake_location_lon[i],
earthquake_deapth[i], earthquake_location[i], earthquake_url[i]))
# 在Mysql数据库中创建表格
def Mysql_create_table(name):
client = pymysql.connect(user="root", host="localhost", passwd="an6688", db="pydat")
cursor = client.cursor()
sql = "create table if not exists table_%s" % name + "(earthquake_n VARCHAR(100),earthquake_t VARCHAR(100),earthquake_location_lat VARCHAR(100)" \
", earthquake_location_lon VARCHAR(100),earthquake_deapth VARCHAR(100),earthquake_location VARCHAR(200)," \
"earthquake_url VARCHAR(100));"
cursor.execute(sql)
cursor.close()
client.close()
# 插入地震数据到Mysql表格中
def Mysql_data(name, earrh_data):
client = pymysql.connect(user="root", host="localhost", passwd="an6688", db="pydat")
cursor = client.cursor()
sql = "insert into table_%s" % name + " values(%s,%s,%s,%s,%s,%s,%s)"
cursor.executemany(sql, earrh_data)
client.commit()
cursor.close()
client.close()
def Geo_chart(geo_location, geo_attrs, geo_values):
attr = geo_attrs # 名称
value = geo_values # 位置
# 利用pyechart进行制图
geo = Geo(init_opts=opts.InitOpts(width='1200px', height='700px', theme=ThemeType.DARK, bg_color="#404a59"))
geo.set_global_opts(
visualmap_opts=opts.VisualMapOpts(is_piecewise=True,
# range_size=[0, np.max(value)],
max_=10
),
title_opts=opts.TitleOpts(title='世界近年历史地震分布图', pos_left='500px', ))
# 添加主题,中国地图,填充及边界颜色设置
geo.add_schema(
maptype='world',
# 修改地图yanse
itemstyle_opts=opts.ItemStyleOpts(border_color='#fff', color='#323C48'),
# symbol_size=15,
)
geo_cities_coords = []
for k in geo_location:
# 自定义坐标写入
dict_value = str(geo_location[k]).replace('[', '').replace(']', '')
geo_cities_coords.append(str(k) + ',' + dict_value)
for k in geo_cities_coords:
geo.add_coordinate(k.split(',')[0], float(k.split(',')[1]), float(k.split(',')[2]))
data = list(zip(attr, value))
# print(data)
geo.add("", data,
type_=ChartType.EFFECT_SCATTER, # 散点图的一种形式
label_opts=opts.LabelOpts(is_show=False), # 不显示数值则设置为False
)
geo.render('./earthquake.html')
if __name__ == "__main__":
url = "http://www.ceic.ac.cn/speedsearch"
for i in range(1, int(input("请输入大于1的整数:"))):
params = {"time": 6, "page": i}
html = Get_html(url, params)
Get_data(html)
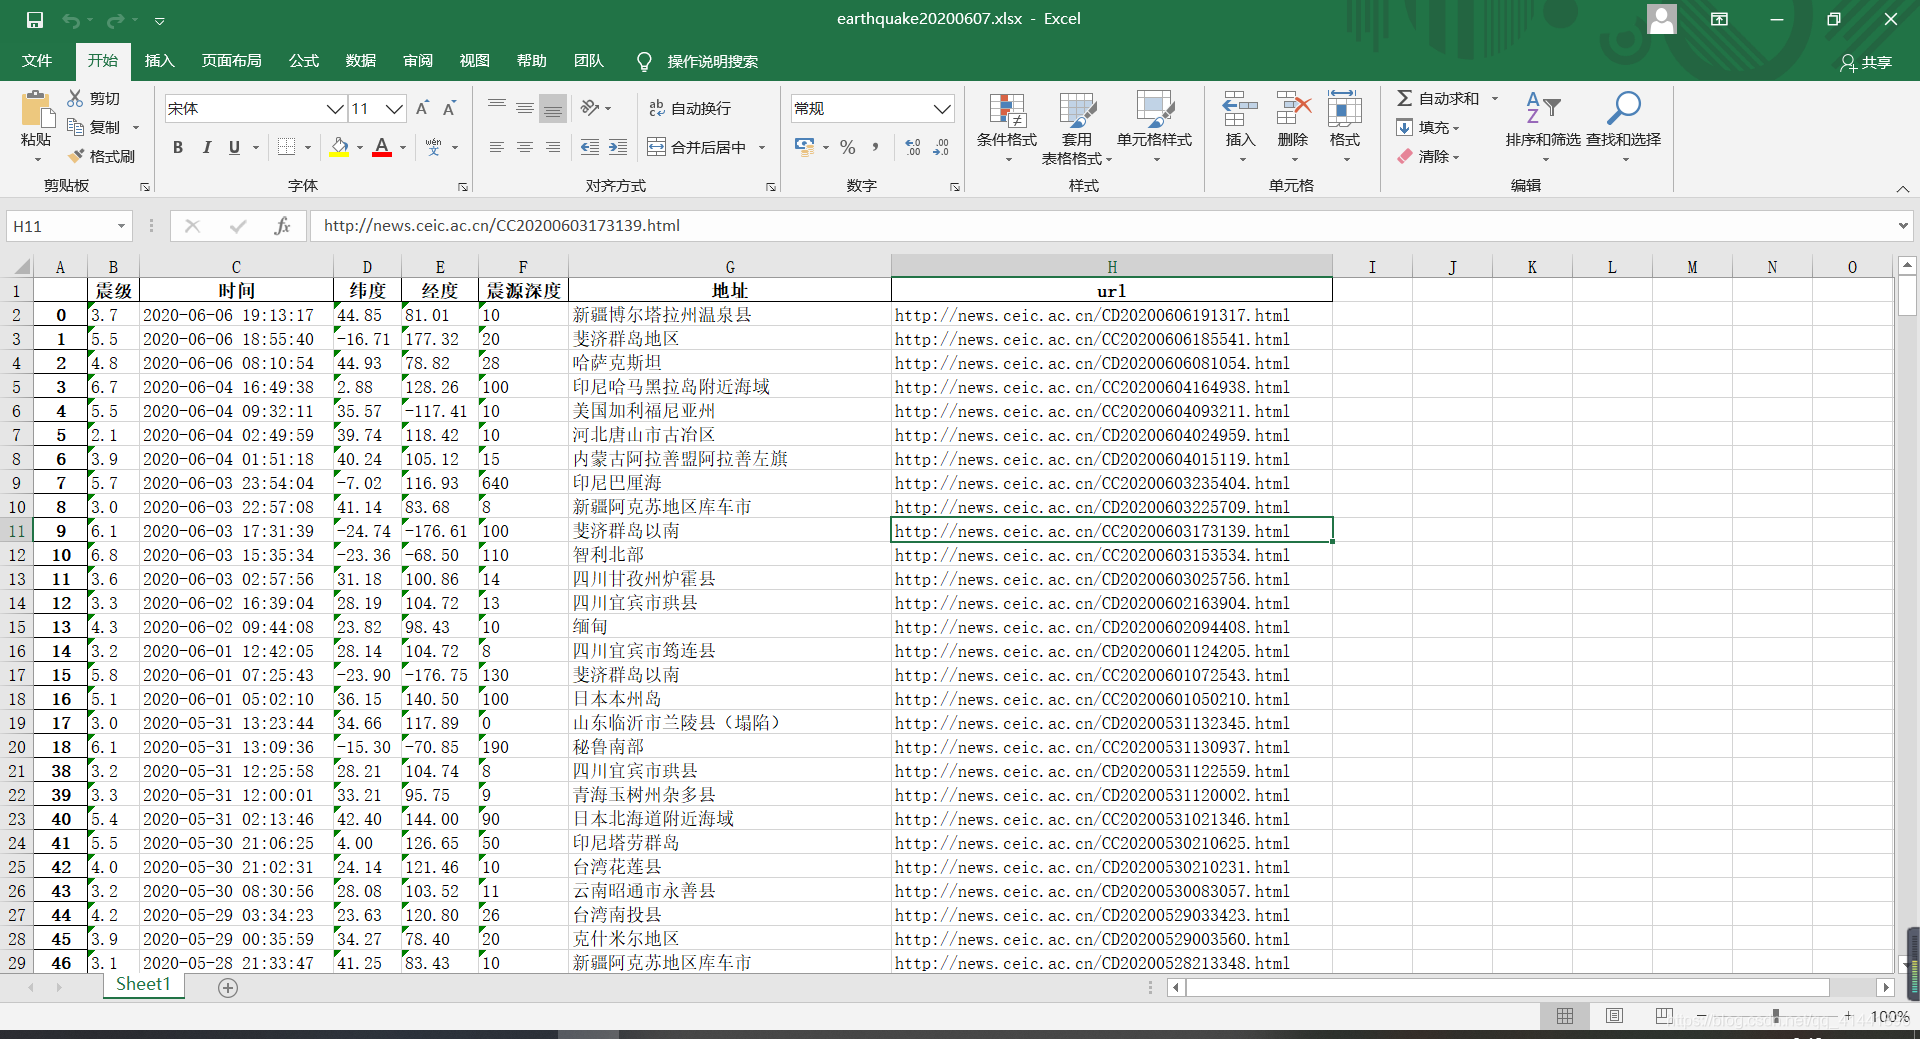
df = pd.DataFrame(earrh_data, columns=['震级', '时间', '纬度', '经度', '震源深度', '地址', 'url'])
df.drop_duplicates(inplace=True) # 数据清洗去重
df.to_excel('./earthquake' + str(datetime.datetime.now().strftime('%Y%m%d')) + '.xlsx',
encoding='gbk') # 写入excel中
for index, row in df.iterrows():
geo_location[(row['地址'])] = [float(row['经度']), float(row['纬度'])]
geo_attrs.append(row['地址'])
geo_values.append(float(row['震级']))
Geo_chart(geo_location, geo_attrs, geo_values)
print('爬取完成')
# 利用Mysql数据库存储地震数据(前提是已经安装mysql,修改上方数据库的密码)
# name = input("表名:")
# Mysql_create_table(name)
# Mysql_data(name, earrh_data)
- 结尾
喜欢的朋友们可以点个关注,后续将持续更新,精彩无限^ - ^


 2468
2468

 被折叠的 条评论
为什么被折叠?
被折叠的 条评论
为什么被折叠?
 到【灌水乐园】发言


