


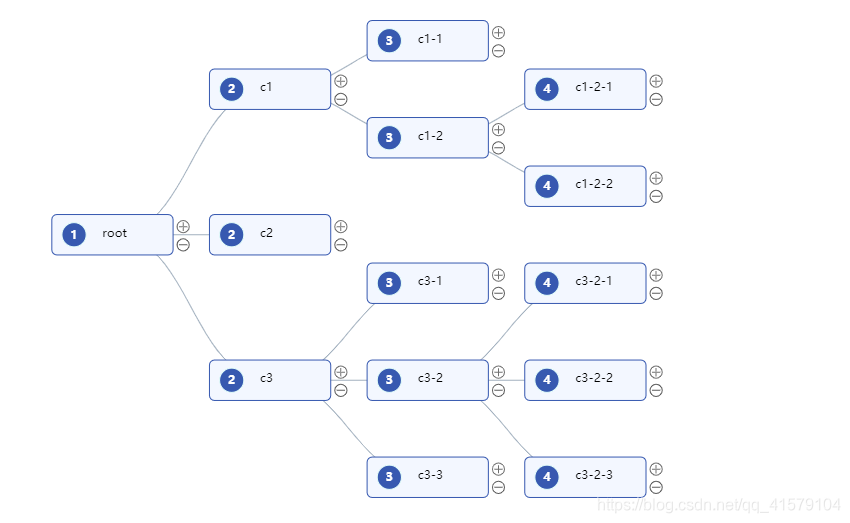
效果图:

<div id="container" ></div>我是对G6中提供的该图的相关函数进行了封装--下面的代码是写在公共js文件里面:
export function renderMap(data,graph){
      const collapseIcon = (x, y, r) => {
        return [
          ['M', x - r, y],
          ['a', r, r, 0, 1, 0, r * 2, 0],
          ['a', r, r, 0, 1, 0, -r * 2, 0],
          ['M', x - r + 4, y],
          ['L', x - r + 2 * r - 4, y],
        ];
      };
      const expandIcon = (x, y, r) => {
        return [
          ['M', x - r, y],
          ['a', r, r, 0, 1, 0, r * 2, 0],
          ['a', r, r, 0, 1, 0, -r * 2, 0],
          ['M', x - r + 4, y],
          ['L', x - r + 2 * r - 4, y],
          ['M', x - r + r, y - r + 4],
          ['L', x, y + r - 4],
        ];
      };

      G6.registerCombo('cRect', {
        drawShape: function drawShape(cfg, group) {
          const self = this;
          // Get the padding from the configuration
          cfg.padding = cfg.padding || [50, 20, 20, 20];
          // Get the shape's style, where the style.width and style.height correspond to the width and height in the figure of Illustration of Built-in Rect Combo
          const style = self.getShapeStyle(cfg);
          // Add a rect shape as the keyShape which is the same as the extended rect Combo
          const rect = group.addShape('rect', {
            attrs: {
              ...style,
              x: -style.width / 2 - (cfg.padding[3] - cfg.padding[1]) / 2,
              y: -style.height / 2 - (cfg.padding[0] - cfg.padding[2]) / 2,
              width: style.width,
              height: style.height
            },
            draggable: true,
            name: 'combo-keyShape'
          });
          // Add the circle on the right
          group.addShape('marker', {
            attrs: {
              ...style,
              fill: '#fff',
              opacity: 1,
              // cfg.style.width and cfg.style.heigth correspond to the innerWidth and innerHeight in the figure of Illustration of Built-in Rect Combo
              x: cfg.style.width / 2 + cfg.padding[1],
              y: (cfg.padding[2] - cfg.padding[0]) / 2,
              r: 10,
              symbol: collapseIcon
            },
            draggable: true,
            name: 'combo-marker-shape'
          });
          return rect;
        },
        // Define the updating logic of the right circle
        afterUpdate: function afterUpdate(cfg, combo) {
          const group = combo.get('group');
          // Find the circle shape in the graphics group of the Combo by name
          const marker = group.find(ele => ele.get('name') === 'combo-marker-shape');
          // Update the position of the right circle
          marker.attr({
            // cfg.style.width and cfg.style.heigth correspond to the innerWidth and innerHeight in the figure of Illustration of Built-in Rect Combo
            x: cfg.style.width / 2 + cfg.padding[1],
            y: (cfg.padding[2] - cfg.padding[0]) / 2,
            // The property 'collapsed' in the combo data represents the collapsing state of the Combo
            // Update the symbol according to 'collapsed'
            symbol: cfg.collapsed ? expandIcon : collapseIcon
          });
        }
      }, 'rect');

      G6.registerEdge(
        'line-arrow',
        {
          getPath(points) {
            const startPoint = points[0];
            const endPoint = points[1];
            return [
              ['M', startPoint.x, startPoint.y],
              ['L', endPoint.x / 3 + (2 / 3) * startPoint.x, startPoint.y],
              ['L', endPoint.x / 3 + (2 / 3) * startPoint.x, endPoint.y],
              ['L', endPoint.x, endPoint.y],
            ];
          },
          getShapeStyle(cfg) {
            const startPoint = cfg.startPoint;
            const endPoint = cfg.endPoint;
            const controlPoints = this.getControlPoints(cfg);
            let points = [startPoint]; // the start point
            // the control points
            if (controlPoints) {
              points = points.concat(controlPoints);
            }
            // the end point
            points.push(endPoint);
            const path = this.getPath(points);
            const style = Object.assign(
              {},
              G6.Global.defaultEdge.style,
              {
                stroke: '#BBB',
                lineWidth: 1,
                path,
              },
              cfg.style,
            );
            return style;
          },
        },
        'line',
      );

      const width = document.getElementById('container').scrollWidth;
      const height = (document.getElementById('container').scrollHeight || 500) - 20;

      graph.data(data);
      graph.render();

      // collapse/expand when click the marker
      graph.on('combo:click', e => {
        if (e.target.get('name') === 'combo-marker-shape') {
          // graph.collapseExpandCombo(e.item.getModel().id);
          graph.collapseExpandCombo(e.item);
          if (graph.get('layout')) graph.layout();
          else graph.refreshPositions();
        }
      });

      graph.on('combo:dragend', e => {
        graph.getCombos().forEach(combo => {
          graph.setItemState(combo, 'dragenter', false);
        })
      });
      graph.on('node:dragend', e => {
        graph.getCombos().forEach(combo => {
          graph.setItemState(combo, 'dragenter', false);
        })
      });

      graph.on('combo:dragenter', e => {
        graph.setItemState(e.item, 'dragenter', true);
      });
      graph.on('combo:dragleave', e => {
        graph.setItemState(e.item, 'dragenter', false);
      });
}
然后在你需要引入该图的vue文件中引入该函数及数据:
import {renderMap} from '../../../assets/common/http' //引入刚才封装的函数

 data(){
    return{
      data_map:{  //定义一个数组就是这组图中需要传入的数据,包含节点、分组及边的信息
        nodes: [
          { id: 'node2', x: 300, y: 200,label:'i系统', comboId: 'combo2' },
          { id: 'node4', x: 300, y: 300,label:'i系统', comboId: 'combo4' },
          { id: 'node5', x: 300, y: 400,label:'i系统', comboId: 'combo4' },

          { id: 'node3', x: 100, y: 200,label:'数据工厂系统', comboId: 'combo3' },
          { id: 'node1', x: 500, y: 200,label:'数据工厂系统', comboId: 'combo1' },

        ],
        combos: [
          { id: 'combo2', label: 'Combo 2'},
          { id: 'combo3', label: 'Combo 3' },
          { id: 'combo1', label: 'Combo 1'},
          { id: 'combo4', label: 'Combo 4' ,parentId: 'combo2'},
        ],
        edges: [
          {
            source: 'node3',
            target: 'node5',

          },
        ],
      },
      graph:{}, //定义一个全局graph
    }
  },
  methods:{
    changeMapModel(e){  //这个函数大家可以不用看,他是用来按钮触发刷新的时候调用的函数
      setTimeout( ()=>{ //此处注意需要写延时器渲染函数,不然会出现dom元素未找到的错误
        this.graph.read(this.data_map1) //刷新图的时候只需要渲染里面的数据即可,因此调用graph
                                    中自带的read方法去刷新
      },100)
    }
  },
  mounted(){
    this.graph = new G6.Graph({
        container: 'container',
        width:1000,
        height:500,
        groupByTypes: false,
        defaultCombo: {
          type: 'cRect',
        },
        comboStateStyles: {
          dragenter: {
            lineWidth: 4,
            stroke: '#FE9797'
          }
        },
        defaultEdge: {
          type: 'line-arrow',
          style: {
            stroke: '#F6BD16',
            endArrow: {
              path: 'M 0,0 L 12,6 L 9,0 L 12,-6 Z',
              fill: '#F6BD16',
            },
          },
        },
        defaultNode: {
          type: 'rect',
          size: [110,40],
          style: {
            fill: '#9EC9FF',
            stroke: '#5B8FF9',
            lineWidth: 3,
          },
          labelCfg: {
            style: {
              fill: '#fff',
              fontSize: 14,
            },
          },
          linkPoints: {
            left: true,
            right: true,
            size: 10,
            fill: '#fff',
            lineWidth: 1,
            stroke: '#1890FF',
          },
        },
        modes: {
          default: [
            'drag-combo',
            'drag-node',
            'drag-canvas'
          ]
        }
    })
    renderMap(this.data_map,this.graph) //所有参数准备好之后,调用刚才封装的渲染函数去渲染组件
  },
还有附上我在angualr中也是用的antvG6画的树形关系图,跟vue里面的原理一样,可以参考一下:
https://blog.csdn.net/qq_41579104/article/details/105861713
效果是这样:

还有一种是节点可增删改的树形结构图,vue写的,可参考一下:
https://blog.csdn.net/qq_41579104/article/details/113388616
效果是这样:


 1977
1977


 被折叠的 条评论
为什么被折叠?
被折叠的 条评论
为什么被折叠?
 到【灌水乐园】发言


