


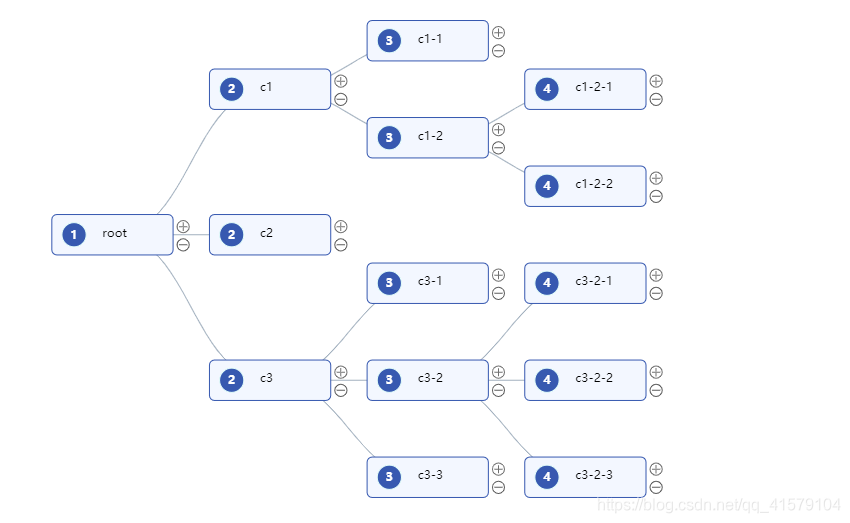
效果图:
- 先在vue项目中安装antv G6
npm install --save @antv/g6- 安装完之后引入,我是将整个结构图的某些相关配置进行了封装,写在了公共js文件里面,若是你们不想封装可以直接在你们相关的vue文件里面引入
import G6 from '@antv/g6';
- 然后封装名称为renderMap的函数,名字可以自定义
export function renderMap(data,graph){
  const COLLAPSE_ICON = function COLLAPSE_ICON(x, y, r) {
    return [
      ['M', x - r, y - r],
      ['a', r, r, 0, 1, 0, r * 2, 0],
      ['a', r, r, 0, 1, 0, -r * 2, 0],
      ['M', x + 2 - r, y - r],
      ['L', x + r - 2, y - r],
    ];
  };
  const EXPAND_ICON = function EXPAND_ICON(x, y, r) {
    return [
      ['M', x - r, y - r],
      ['a', r, r, 0, 1, 0, r * 2, 0],
      ['a', r, r, 0, 1, 0, -r * 2, 0],
      ['M', x + 2 - r, y - r],
      ['L', x + r - 2, y - r],
      ['M', x, y - 2 * r + 2],
      ['L', x, y - 2],
    ];
  };
  G6.Util.traverseTree(data, (d) => {
    d.leftIcon = {
      style: {
        fill: '#3759B0',
        stroke: '#e6fffb',
      },
    };
    return true;
  });

  G6.registerNode('icon-node', {
    options: {
      size: [60, 20],
      stroke: '#73D13D',
      fill: '#fff'
    },
    draw(cfg, group) {
      const styles = this.getShapeStyle(cfg)
      const { labelCfg = {} } = cfg

      const keyShape = group.addShape('rect', {
        attrs: {
          ...styles,
          x: 0,
          y: 0
        }
      })

      /**
       * leftIcon 格式如下:
       *  {
       *    style: ShapeStyle;
       *    img: ''
       *  }
       */
     // console.log('cfg.leftIcon', cfg.leftIcon);
      if (cfg.leftIcon) {
        const { style, img } = cfg.leftIcon
        group.addShape('rect', {
          attrs: {
            x: 10,
            y: 8,
            width: 24,
            radius: 12,
            height: styles.height - 16,
            fill: '#8c8c8c',
            ...style
          }
        })
        group.addShape('text', {
            attrs: {
              text: cfg.name,
              x: 22,
              y: 21,
              fill: '#ffffff',
              fontSize: 12,
              textAlign: 'center',
              textBaseline: 'middle',
              fontWeight: 'bold',
            },
            name: 'text-shape',
          });
        group.addShape('image', {
          attrs: {
            x: 8,
            y: 8,
            width: 24,
            height: 24,
          },
          name: 'image-shape',
        });
      }

      // 如果不需要动态增加或删除元素,则不需要 add 这两个 marker
      group.addShape('marker', {
        attrs: {
          x: 130,
          y: 18,
          r: 6,
          stroke: '#707070',
          cursor: 'pointer',
          symbol: EXPAND_ICON
        },
        name: 'add-item'
      })

      group.addShape('marker', {
        attrs: {
          x: 130,
          y: 36,
          r: 6,
          stroke: '#5C5C5C',
          cursor: 'pointer',
          symbol: COLLAPSE_ICON
        },
        name: 'remove-item'
      })

      if (cfg.label) {
        group.addShape('text', {
          attrs: {
            ...labelCfg.style,
            text: cfg.label,
            x: 50,
            y: 25,
          }
        })
      }

      return keyShape
    }
  }, 'rect')

  G6.registerEdge('flow-line', {
    draw(cfg, group) {
      const startPoint = cfg.startPoint;
      const endPoint = cfg.endPoint;

      const { style } = cfg
      const shape = group.addShape('path', {
        attrs: {
          stroke: style.stroke,
          endArrow: style.endArrow,
          path: [
            ['M', startPoint.x, startPoint.y],
            ['L', startPoint.x, (startPoint.y + endPoint.y) / 2],
            ['L', endPoint.x, (startPoint.y + endPoint.y) / 2,],
            ['L', endPoint.x, endPoint.y],
          ],
        },
      });

      return shape;
    }
  });

  const width = document.getElementById('container').scrollWidth;
  const height = document.getElementById('container').scrollHeight || 500;

  graph.data(data);
  graph.render();
  graph.fitView();

  graph.on('node:mouseenter', evt => {
    const { item } = evt
    graph.setItemState(item, 'hover', true)
  })

  graph.on('node:mouseleave', evt => {
    const { item } = evt
    graph.setItemState(item, 'hover', false)
  })
}- 然后需要在相关的vue文件中引入这个封装好的公共函数renderMap
import G6 from "@antv/g6";
import { renderMap } from "../../../assets/common/http";
- 直接呈上完整vue文件,里面有几个需要注意的点,用注释标注了
<template>
  <div>
    <div id="container"></div>
  </div>
</template>

<script>
import G6 from "@antv/g6";  //注意引入
import { renderMap } from "../../../assets/common/http"; //朱茵引入封装的函数
export default {
  data() {
    return {
      graph: {}, //定义一个graph对象
      data: {    //定义一个公共数据数组
        id: "root",
        label: "root",
        name: 1,
        children: [
          {
            id: "c1",
            label: "c1",
            name: 2,

            children: [
              {
                id: "c1-1",
                label: "c1-1",
                name: 3
              },
              {
                id: "c1-2",
                label: "c1-2",
                name: 3,
                children: [
                  {
                    id: "c1-2-1",
                    label: "c1-2-1",
                    name: 4
                  },
                  {
                    id: "c1-2-2",
                    label: "c1-2-2",
                    name: 4
                  }
                ]
              }
            ]
          },
          {
            id: "c2",
            label: "c2",
            name: 2
          },
          {
            id: "c3",
            label: "c3",
            name: 2,

            children: [
              {
                id: "c3-1",
                label: "c3-1",
                name: 3
              },
              {
                id: "c3-2",
                label: "c3-2",
                name: 3,

                children: [
                  {
                    id: "c3-2-1",
                    label: "c3-2-1",
                    name: 4
                  },
                  {
                    id: "c3-2-2",
                    label: "c3-2-2",
                    name: 4
                  },
                  {
                    id: "c3-2-3",
                    label: "c3-2-3",
                    name: 4
                  }
                ]
              },
              {
                id: "c3-3",
                label: "c3-3",
                name: 3
              }
            ]
          }
        ]
      },
    };
  },
  mounted() {
    this.render(); //注意渲染
  },
  methods: {
    render() {
      const defaultStateStyles = {
        hover: {
          stroke: "#1890ff",
          lineWidth: 2
        }
      };
      const defaultNodeStyle = {
        fill: "#F3F7FF",
        stroke: "#3759B0",
        radius: 5
      };
      const defaultEdgeStyle = {
        stroke: "#91d5ff",
        endArrow: {
          path: "M 0,0 L 12, 6 L 9,0 L 12, -6 Z",
          fill: "#91d5ff",
          d: -20
        }
      };
      const defaultLabelCfg = {
        style: {
          fill: "#000",
          fontSize: 12
        }
      };
      const defaultLayout = {
        type: "compactBox",
        direction: "LR",
        getId: function getId(d) {
          return d.id;
        },
        getHeight: function getHeight() {
          return 16;
        },
        getWidth: function getWidth() {
          return 16;
        },
        getVGap: function getVGap() {
          return 40;
        },
        getHGap: function getHGap() {
          return 70;
        }
      };
      const width = document.getElementById("container").scrollWidth;
      const height = document.getElementById("container").scrollHeight || 450;
      this.graph = new G6.TreeGraph({
        container: "container",
        width: width,
        height: height,
        linkCenter: true,
        modes: {
          default: ["drag-canvas", "zoom-canvas"]
        },
        defaultNode: {
          type: "icon-node",
          size: [120, 40],
          style: defaultNodeStyle,
          labelCfg: defaultLabelCfg
        },
        defaultEdge: {
          type: "cubic-horizontal",
          style: {
            stroke: "#A3B1BF"
          }
        },
        nodeStateStyles: defaultStateStyles,
        edgeStateStyles: defaultStateStyles,
        layout: defaultLayout
      });
      //节点双击事件,这里的编辑页面用的是浏览器的弹窗,也可自己编写页面进行调用
      this.graph.on('node:dblclick', (evt,element) => {
          console.log(evt,element)
          const { item, target } = evt
          console.log(evt)
          const targetType = target.get('type')
          const name = target.get('name')
          console.log(target)
          var str=prompt("随便写点儿啥吧",target.attrs.text);
        })
      this.graph.on('node:click', evt => {
          const { item, target } = evt
          const targetType = target.get('type')
          const name = target.get('name')

      // 增加元素,这里增加元素也是用的浏览器的弹窗
      if (targetType === 'marker') {
        const model = item.getModel()
        if (name === 'add-item') {
          if (!model.children) {
            model.children = []
      }
          const id = 'ra';
          var str=prompt("请输入节点名称","比如c3-3-4");
      if(str){
            target.attrs.text = str
            model.children.push({
                id,
                name:1,
                label: str,
            })
          this.graph.updateChild(model, model.id)
      }
      //删除节点
        } else if (name === 'remove-item') {
          this.graph.removeChild(model.id)
        }
      }
    })
      renderMap(this.data, this.graph); //别忘了渲染
    },
  }
};
</script>

<style scoped lang="less">
@media screen and (min-width: 200px) and (max-width: 1600px) {
  #container {
    margin-top: 1%;
    height: 350px;
  }
}
@media screen and (min-width: 1601px) {
  #container {
    height: 500px;
    margin-top: 2%;
  }
}
</style>
以上内容若有问题,欢迎各位指正,共同学习~~


 447
447


 被折叠的 条评论
为什么被折叠?
被折叠的 条评论
为什么被折叠?
 到【灌水乐园】发言


