


echart
提示框
tooltip: {
            // trigger 设置触发类型,默认数据触发,可选值:'item' ¦ 'axis'
            trigger: 'item',

            // 显示延迟,添加显示延迟可以避免频繁切换,单位ms
            showDelay: 20,
            // 隐藏延迟,单位ms
            hideDelay: 20,
            backgroundColor: 'rgba(255,0,0,0.7)',  // 提示框背景颜色
            textStyle: {
              fontSize: '16px',
              color: '#000'  // 设置文本颜色 默认#FFF
            },
            // formatter设置提示框显示内容
            // {a}指series.name  {b}指series.data的name
            // {c}指series.data的value  {d}%指这一部分占总数的百分比
            formatter: '{a} <br/>{b} : {c}个 ({d}%)'
          }
实例
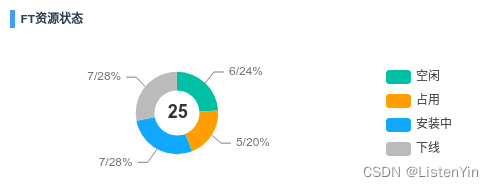
echart实例-FT资源状态
<template>
    <div class="main">
        <div class="header">
            <span>FT资源状态</span>
        </div>
        <div class="chart-container" ref="chart"></div>
    </div>
</template>

<script>
import { onMounted, ref, getCurrentInstance, computed } from 'vue';
import * as echarts from "echarts";
import { useStore } from 'vuex';


export default {
    name: 'FTResourceStatus',
    setup() {
        const store = useStore();
        const envStatus = computed(() => {
            return store.state.ftResourceAbout.envStatus;
        })
        // 加载表格
        function loadChart(envStatuList) {
            var myChart = echarts.init(getCurrentInstance().refs.chart);
            var option = {
                legend: {
                    orient: 'vertical',
                    right: 30,
                    top: 'center'
                },
                title: {
                    text: '25',
                    left: '32%',
                    top: 'center'
                },
                series: [
                    {
                        type: 'pie',
                        color: [
                            '#00C0A4',
                            '#FF9E00',
                            '#10A9FD',
                            '#bbb',
                        ],
                        data: envStatuList,
                        radius: ['30%', '55%'],
                        center: ['35%', '50%'],
                        // 设置值域的那指向线
                        labelLine: {
                            normal: {
                                show: true,  // show设置线是否显示,默认为true,可选值:true ¦ false
                                length: 15,
                                length2: 10,
                                lineStyle: {
                                    color: 'grey',
                                    // width: 2
                                },
                                position: 'outer'
                            }
                        },
                        // 设置值域的标签
                        label: {
                            normal: {
                                show: true,
                                // 设置标签位置,默认在饼状图外 可选值:'outer' ¦ 'inner(饼状图上)'
                                position: 'outer',
                                // formatter: '{a} {b} : {c}个 ({d}%)'   设置标签显示内容 ,默认显示{b}
                                // {a}指series.name  {b}指series.data的name
                                // {c}指series.data的value  {d}%指这一部分占总数的百分比
                                formatter: '{c}/{d}%',
                                color: '#737373'
                            }

                        }
                    }
                ],
                tooltip: {
                    trigger: 'axis',
                    formatter: '{b}: {c} ({d}%)'
                },
            };
            myChart.setOption(option)
        }
        onMounted(() => {
            loadChart(envStatus.value);
        });
        return {
            envStatus
        }
    }
}
</script>
<style lang="less" scoped>
.main {
    width: 100%;
    height: 210px;
    background-color: #fff;
    border: solid 1px rgb(231, 231, 235);
    padding: 15px 20px;
    border-radius: 4px;
    box-shadow: 0 1px 2px rgb(150 150 150 / 30%);
    .header {
        width: 100%;
        display: flex;
        align-items: center;
        justify-content: space-between;
        span {
            width: 150px;
            padding-left: 5px;
            border-left: solid 5px #409EFF;
            font-size: 12px;
            height: 18px;
            line-height: 18px;
            font-weight: 700;
        }
    }
    .chart-container {
        width: 100%;
        height: 150px;
        margin-top: 10px;
    }
}
</style>


 829
829


 被折叠的 条评论
为什么被折叠?
被折叠的 条评论
为什么被折叠?
 到【灌水乐园】发言


