


gplots (version 3.1.1)
heatmap.2: Enhanced Heat Map
This heatmap provides a number of extensions to the standard R heatmap function.
heatmap.2 (x,
           # dendrogram control
           Rowv = TRUE,
           Colv=if(symm)"Rowv" else TRUE,
           distfun = dist,
           hclustfun = hclust,
           dendrogram = c("both","row","column","none"),
           reorderfun = function(d, w) reorder(d, w),
           symm = FALSE,

           # data scaling
           scale = c("none","row", "column"),
           na.rm=TRUE,

           # image plot
           revC = identical(Colv, "Rowv"),
           add.expr,

           # mapping data to colors
           breaks,
           symbreaks=any(x < 0, na.rm=TRUE) || scale!="none",

           # colors
           col="heat.colors",

           # block sepration
           colsep,
           rowsep,
           sepcolor="white",
           sepwidth=c(0.05,0.05),

           # cell labeling
           cellnote,
           notecex=1.0,
           notecol="cyan",
           na.color=par("bg"),

           # level trace
           trace=c("column","row","both","none"),
           tracecol="cyan",
           hline=median(breaks),
           vline=median(breaks),
           linecol=tracecol,

           # Row/Column Labeling
           margins = c(5, 5),
           ColSideColors,
           RowSideColors,
           cexRow = 0.2 + 1/log10(nr),
           cexCol = 0.2 + 1/log10(nc),
           labRow = NULL,
           labCol = NULL,
           srtRow = NULL,
           srtCol = NULL,
           adjRow = c(0,NA),
           adjCol = c(NA,0),
           offsetRow = 0.5,
           offsetCol = 0.5,
           colRow = NULL,
           colCol = NULL,

           # color key + density info
           key = TRUE,
           keysize = 1.5,
           density.info=c("histogram","density","none"),
           denscol=tracecol,
           symkey = any(x < 0, na.rm=TRUE) || symbreaks,
           densadj = 0.25,
           key.title = NULL,
           key.xlab = NULL,
           key.ylab = NULL,
           key.xtickfun = NULL,
           key.ytickfun = NULL,
           key.par=list(),

           # plot labels
           main = NULL,
           xlab = NULL,
           ylab = NULL,

           # plot layout
           lmat = NULL,
           lhei = NULL,
           lwid = NULL,

           # extras
           extrafun=NULL,
           ...
           )
Arguments
-
x矩阵数据library(gplots) mat <- matrix(data = c(0.1, 0.3, 0.4, 0.6, 0.2, 0.5, 0.7, 0.8, 0.9, 0.15, 0.25, 0.35, 0.4, 0.55, 0.65, 0.75), ncol = 4, nrow = 4) heatmap.2(mat)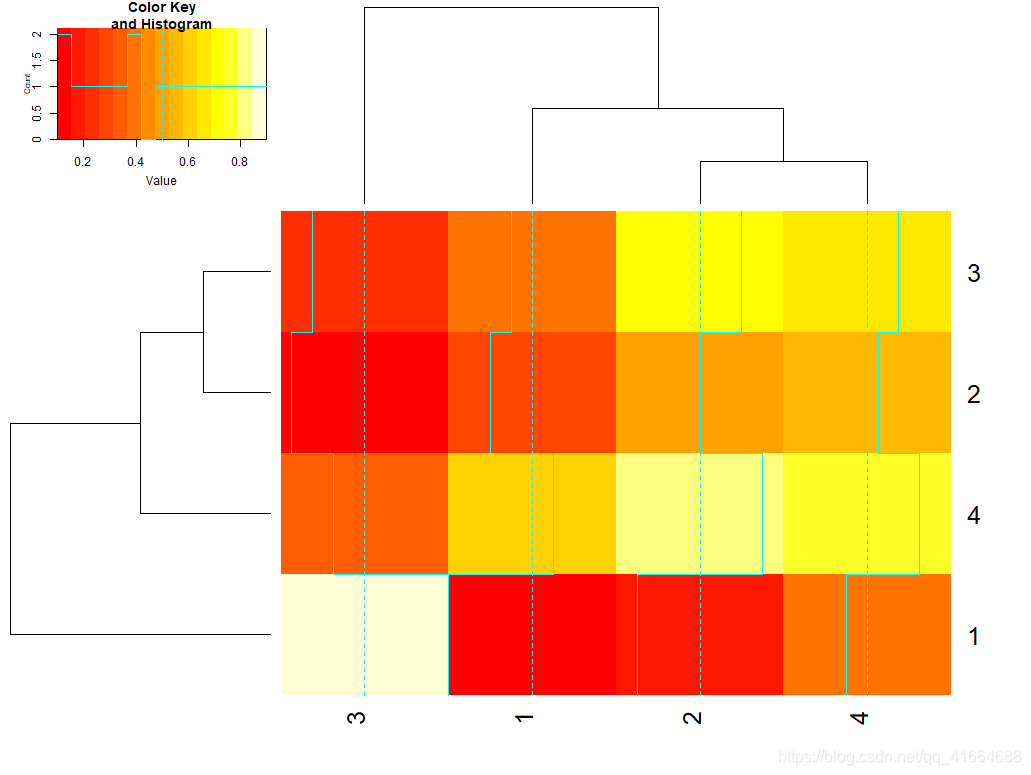
-
Rowv默认为TRUE,即画出行树状图,且如果是整数向量,则根据向量的顺序计算并重新排序。若为FALSE,则不给出树状图且不重新排序。 -
Colv与Rowv相同,若输入为方阵,还可以设置Colv = Rowv表明相同设置heatmap.2(mat, Rowv = F, Colv = F)
-
distfunc用于计算行和列之间的距离(相异性)的函数,默认dist -
hclustfun当Rowv或Colv不是树状图时,用于计算层次聚类的函数,默认为hclust -
dendrogram绘制树状图,参数可以是none,both,column,row,当与Rowv和Colv参数冲突时,以Rowv和Colv为准 -
reorderfun -
symm对称,只有当x为方阵时才有可能设置为TRUE -
scale -
na.rm -
revC -
add.expr -
breaks设置key的范围heatmap.2(mat, Rowv = F, Colv = F, breaks = seq(0,1,0.04))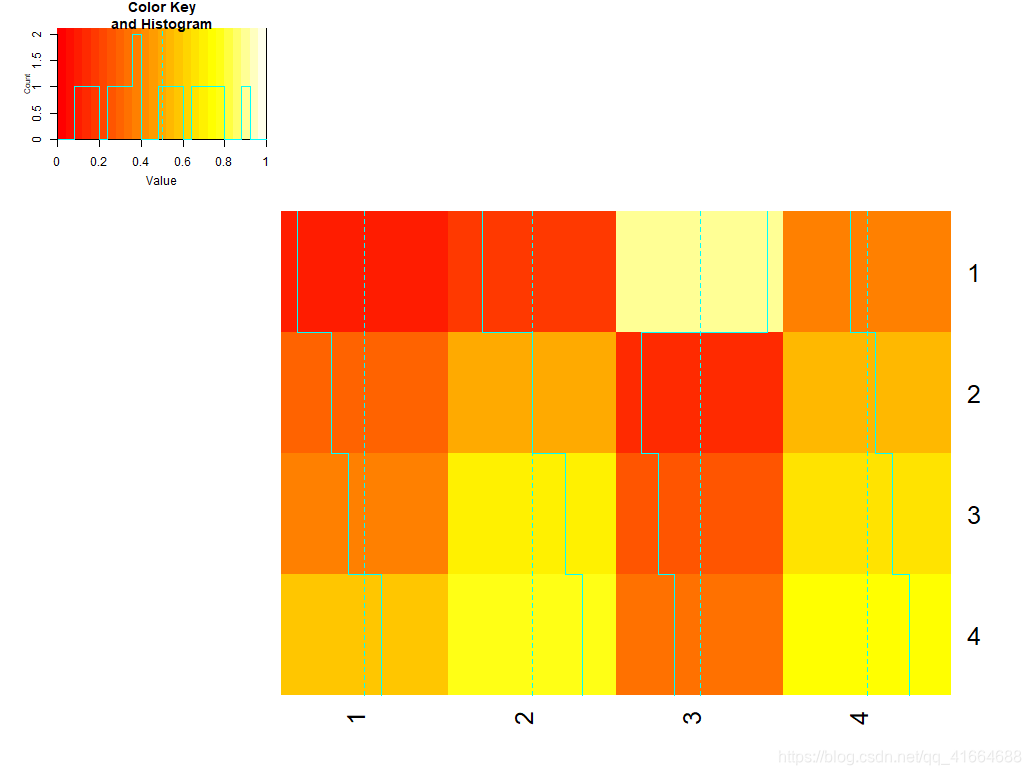
-
symbreaks -
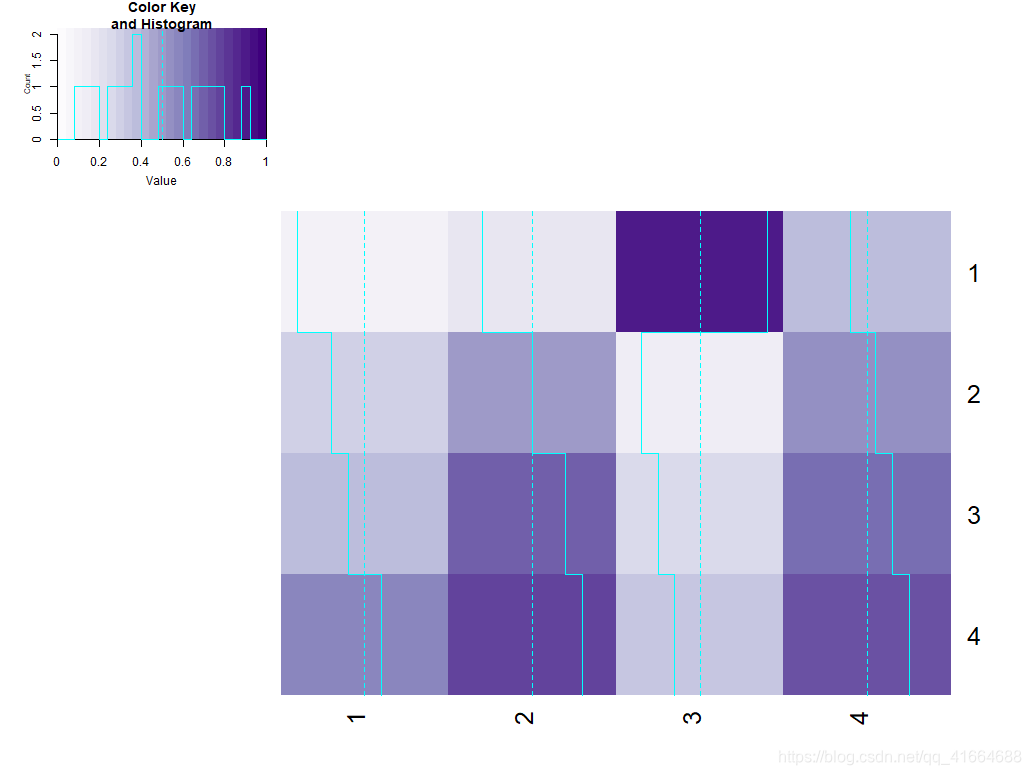
col热图颜色设置coul <- colorRampPalette(brewer.pal(8, "PiYG"))(25) coul2 <- colorRampPalette(brewer.pal(9, "Purples"))(25) heatmap.2(mat, Rowv = F, Colv = F, breaks = seq(0,1,0.04), col=coul) heatmap.2(mat, Rowv = F, Colv = F, breaks = seq(0,1,0.04), col=coul2)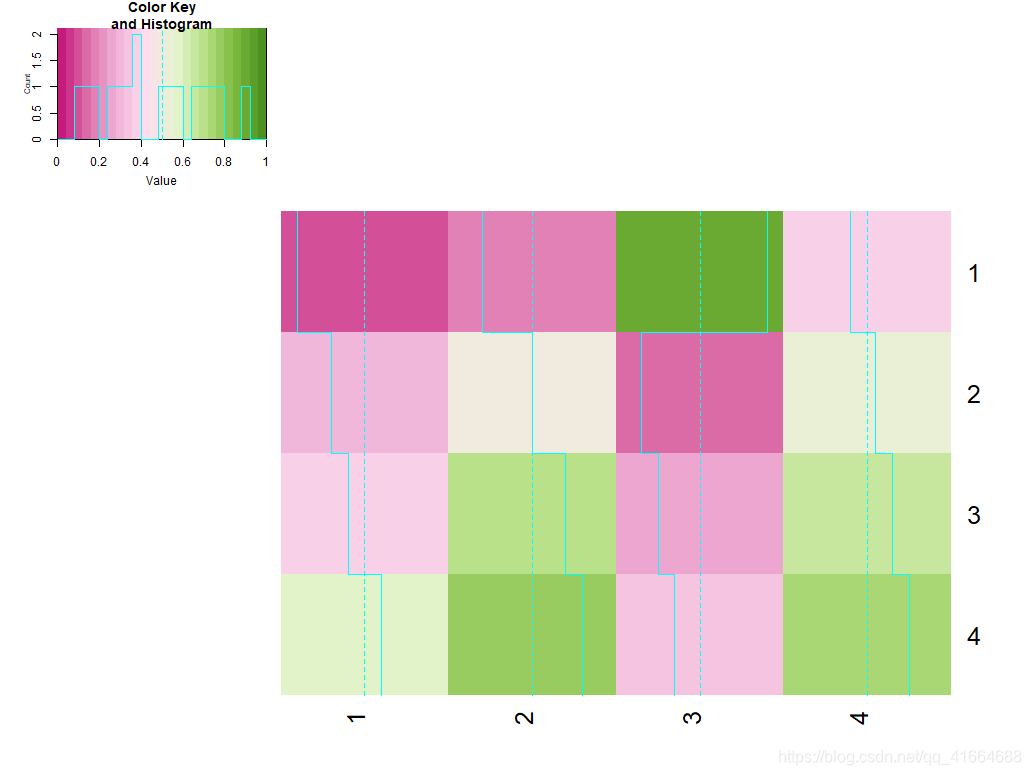
-
colsep,rowsep,sepco -
sepwidth -
cellnote块里加上数字 -
notecexnote的大小 -
notecolnote的颜色heatmap.2(mat, Rowv = F, Colv = F, breaks = seq(0,1,0.04), col=coul2, cellnote = mat, notecol = "black", notecex = 2)
-
na.colorNA值的颜色 -
trace -
tracecol -
hline, vline, linecol -
margins -
ColSideColors长度为ncol (x)的字符向量,其中包含可用于标注 x 的列的水平边条的颜色名称。 -
RowSideColors同ColSideColorsheatmap.2(mat, Rowv = F, Colv = F, breaks = seq(0,1,0.04), col=coul2, cellnote = mat, notecol = "black", notecex = 2, RowSideColors = c("red","blue","red","blue"), ColSideColors = c("red","blue","red","blue") )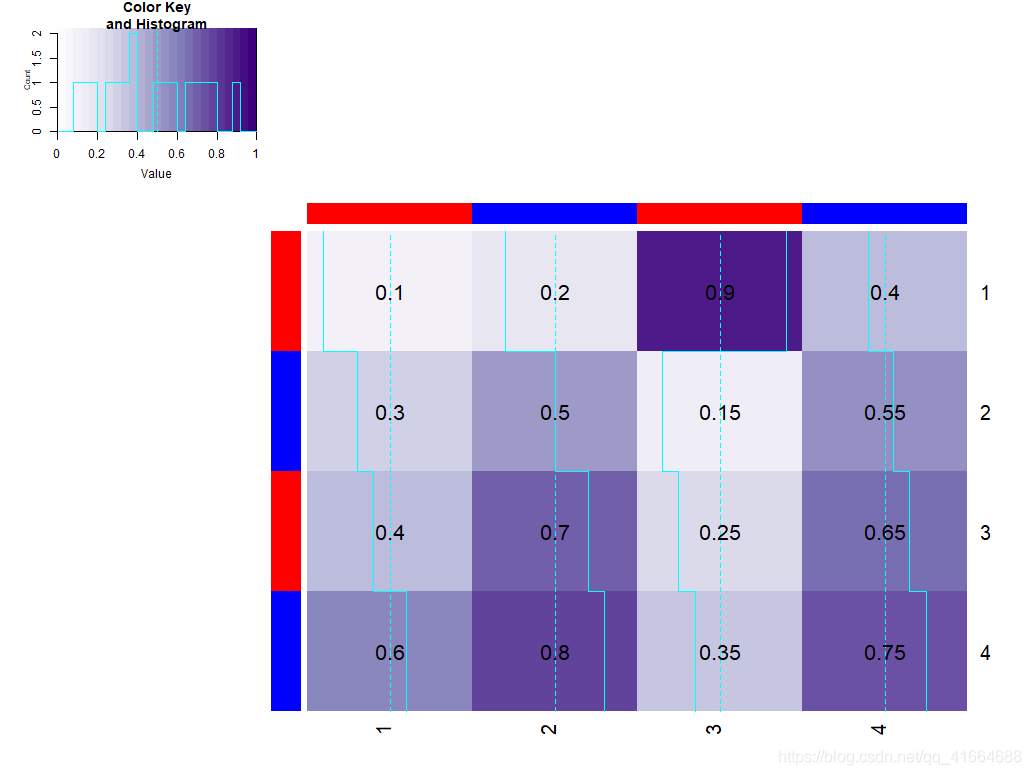
-
cexRow, cexColheatmap.2(mat, Rowv = F, Colv = F, breaks = seq(0,1,0.04), col=coul2, cellnote = mat, notecol = "black", notecex = 2, cexRow = 4,cexCol = 4 )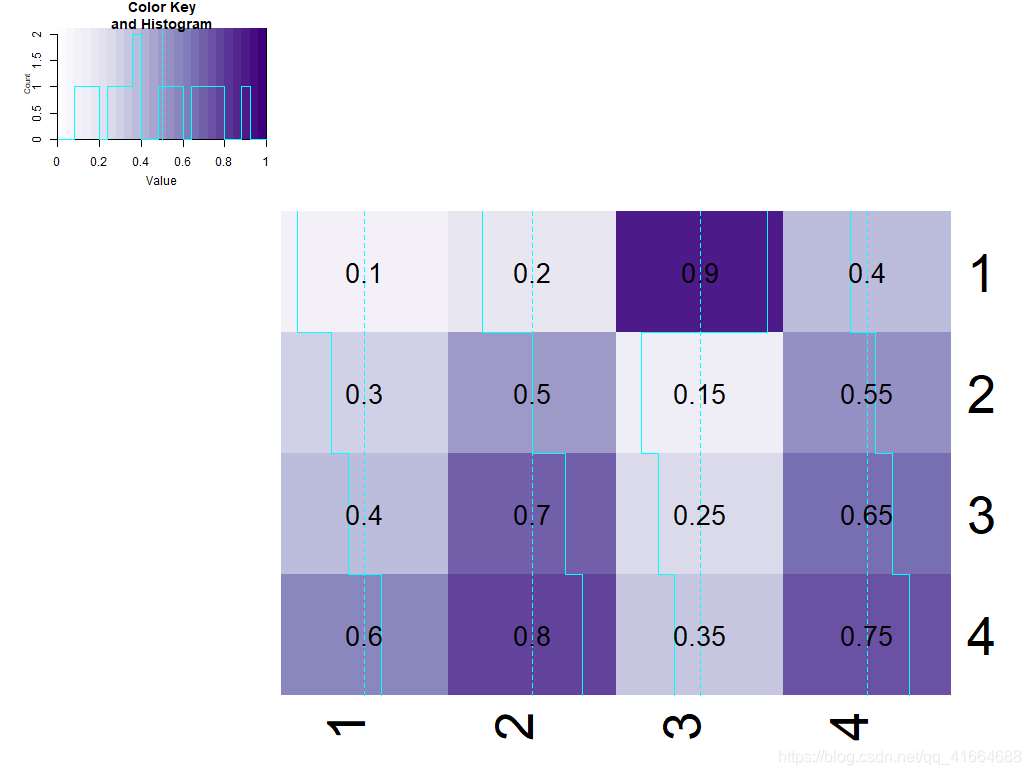
-
labRow, labCol重新设置坐标轴名称heatmap.2(mat, Rowv = F, Colv = F, breaks = seq(0,1,0.04), col=coul2, cellnote = mat, notecol = "black", notecex = 2, cexRow = 2,cexCol = 2, labRow = c("A","B","C","D"), labCol = c("E","F","G","H") )
-
srtRow, srtCol行列坐标旋转角度heatmap.2(mat, Rowv = F, Colv = F, breaks = seq(0,1,0.04), col=coul2, cellnote = mat, notecol = "black", notecex = 2, cexRow = 2,cexCol = 2, labRow = c("A","B","C","D"), labCol = c("E","F","G","H"), srtCol = 0 )
-
adjRow, adjCol -
offsetRow, offsetCol调整坐标轴标签上下位置 -
colRow, colColheatmap.2(mat, Rowv = F, Colv = F, breaks = seq(0,1,0.04), col=coul2, cellnote = mat, notecol = "black", notecex = 2, cexRow = 2,cexCol = 2, labRow = c("A","B","C","D"), labCol = c("E","F","G","H"), srtCol = 0, colRow = "red", colCol = c("red","blue","green","pink") )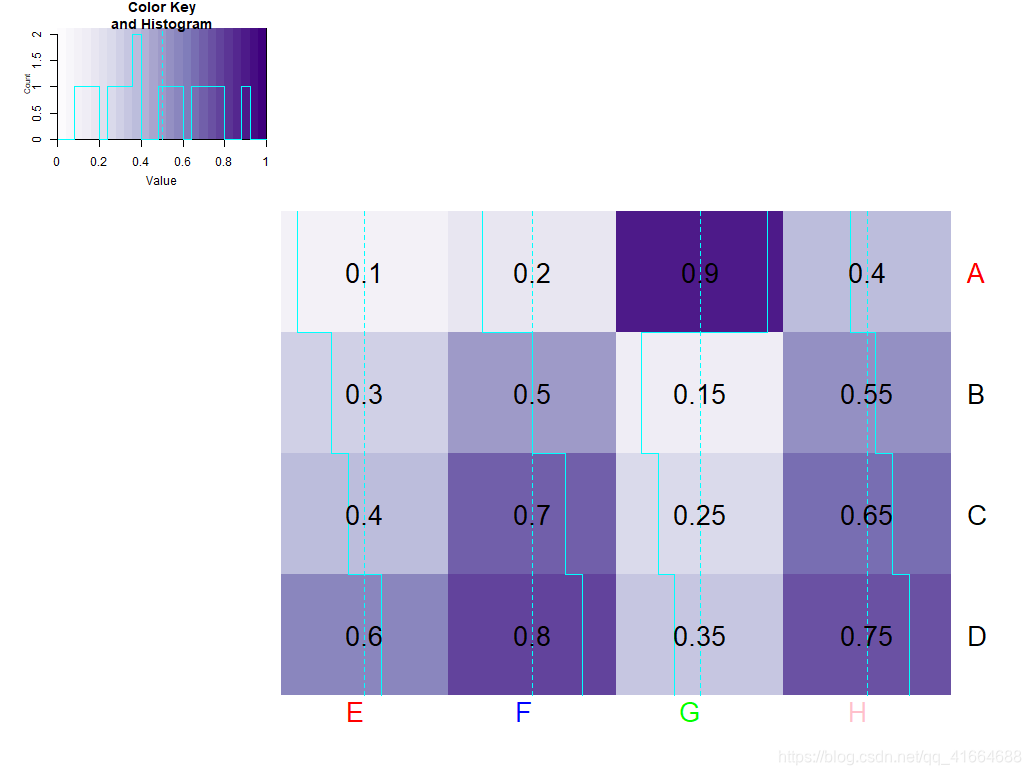
-
keylogical indicating whether a color-key should be shown. -
keysizekey大小 -
key.title -
key.xlab -
key.ylabheatmap.2(mat, Rowv = F, Colv = F, breaks = seq(0,1,0.04), col=coul2, cellnote = mat, notecol = "black", notecex = 2, cexRow = 2,cexCol = 2, labRow = c("A","B","C","D"), labCol = c("E","F","G","H"), srtCol = 0, colRow = "red", colCol = c("red","blue","green","pink"), keysize = 1, key.title = "title", key.xlab = "xlab", key.ylab = "ylab" )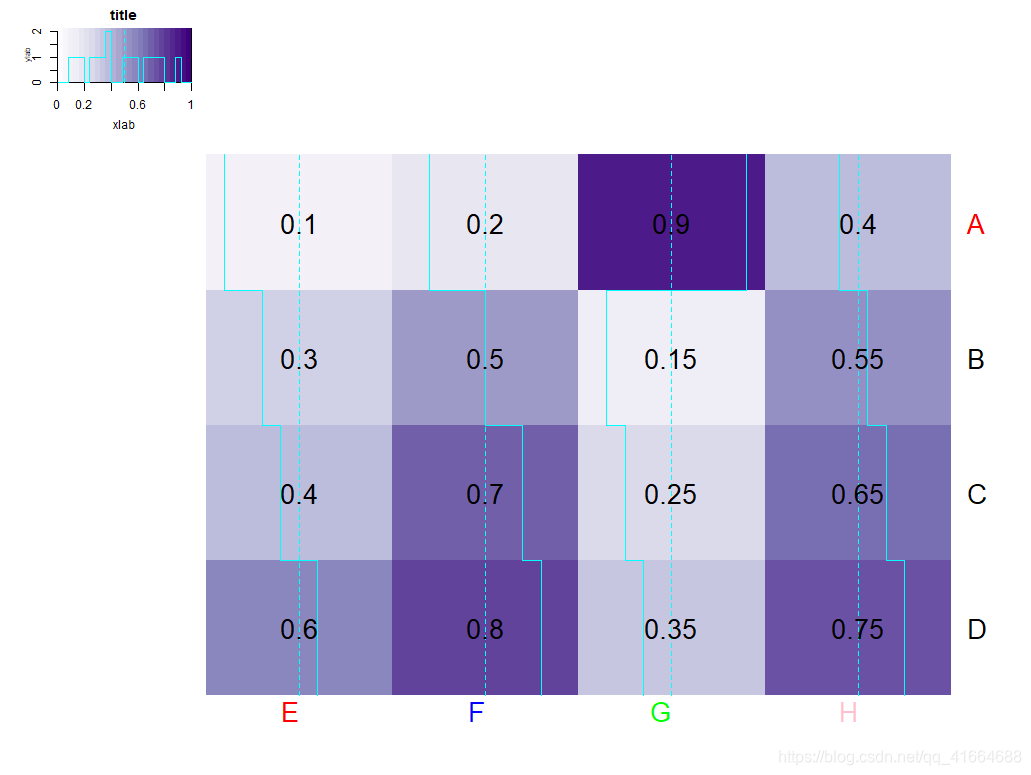
-
key.xtickfun -
key.ytickfun -
key.par -
density.info -
denscol -
symkey -
densadj -
main, xlab, ylab -
lmat, lhei, lwid控制plot位置 -
extrafun
R文档
暂时只用到了这些,其余的以后用到补充


 1946
1946

 被折叠的 条评论
为什么被折叠?
被折叠的 条评论
为什么被折叠?
 到【灌水乐园】发言


