


安装
在这里选择合适的下载方式:https://software.intel.com/content/www/cn/zh/develop/tools/oneapi/base-toolkit/download.html
如果没有GUI,就用Command Line Installation里的命令来下载安装。我的是这样的:
wget https://registrationcenter-download.intel.com/akdlm/irc_nas/17769/l_BaseKit_p_2021.2.0.2883.sh
sudo bash l_BaseKit_p_2021.2.0.2883.sh
注意在命令行下安装时,终端窗口要足够大,不然显示不全。
跑样例工程
安装完成后可以使用vscode来连接服务器使用vtune。官方教程:https://software.intel.com/content/www/us/en/develop/documentation/get-started-with-intel-oneapi-base-linux/top/run-a-sample-project-with-vscode.html
下面简单介绍一下基础用法。
首先安装两个插件:Sample Browser for Intel oneAPI Toolkits和Environment Configurator for Intel oneAPI Toolkits
然后按Ctrl+Shift+P,输入Intel oneAPI,点击Intel oneAPI: Initialize environment variables,一般可以自动发现安装目录(如果安装在默认的/opt/intel/oneapi下的话)。
然后点击最左边导航栏里的oneapi图标,会提示oneapi-cli找不到,问你是否下载,点击Yes即可。但是可能会下载失败。这时可能要在https://github.com/intel/oneapi-cli手动下载下来上传到服务器,然后更名为oneapi-cli放到/usr/local/bin里,记得要给执行权限。
然后选择cpp->Get Started->Base: Vector Add,点击右边的加号,编辑路径后,vscode会新建一个样例工程并且在新窗口打开。可以查看README.md,里面有这个样例工程的介绍以及运行流程。对于Vector Add这个样例,流程是:
先Ctrl+Shift+P跑Intel oneAPI: Initialize environment variables,然后新建终端,执行:
make all
./vector-add-buffers
Running on device: Intel(R) Xeon(R) Platinum 8269CY CPU @ 2.50GHz
Vector size: 10000
[0]: 0 + 0 = 0
[1]: 1 + 1 = 2
[2]: 2 + 2 = 4
...
[9999]: 9999 + 9999 = 19998
Vector add successfully completed on device.
vtune
vtune的教程:https://software.intel.com/content/www/us/en/develop/documentation/get-started-with-vtune/top.html
服务器上用的话,主要看命令行界面的用法:https://software.intel.com/content/www/us/en/develop/documentation/vtune-help/top/command-line-interface/command-syntax.html
注意如果是开普通终端,而不是在vscode里用的话,要先
source /opt/intel/oneapi/setvars.sh
可以运行vtune --help查看基本用法,运行vtune -help collect查看可以搜集的性能数据。
例子:
vtune -collect hotspots -result-dir hotspots -quiet ./vector-add-buffers
注意这个./不能省略。-collect可以缩写为-c,-result-dir可以缩写为-r,-quiet可以缩写为-q。
输出:
vtune: Warning: Hardware collection of CPU events is not possible on this system. Microarchitecture performance insights will not be available.
Running on device: Intel(R) Xeon(R) Platinum 8269CY CPU @ 2.50GHz
Vector size: 10000
[0]: 0 + 0 = 0
[1]: 1 + 1 = 2
[2]: 2 + 2 = 4
...
[9999]: 9999 + 9999 = 19998
Vector add successfully completed on device.
vtune: Warning: Cannot locate debugging information for file `/lib/x86_64-linux-gnu/libgcc_s.so.1'.
vtune: Warning: Cannot locate debugging information for file `/opt/intel/oneapi/vtune/2021.2.0/lib64/runtime/libittnotify_collector.so'.
vtune: Warning: Cannot locate debugging information for file `/opt/intel/oneapi/compiler/2021.2.0/linux/lib/libOpenCL.so.1'.
vtune: Warning: Cannot locate debugging information for file `/opt/intel/oneapi/vtune/2021.2.0/lib64/libtpsstool.so'.
vtune: Warning: Cannot locate debugging information for file `/usr/lib/x86_64-linux-gnu/libstdc++.so.6'.
vtune: Warning: Cannot locate debugging information for file `/lib64/ld-linux-x86-64.so.2'.
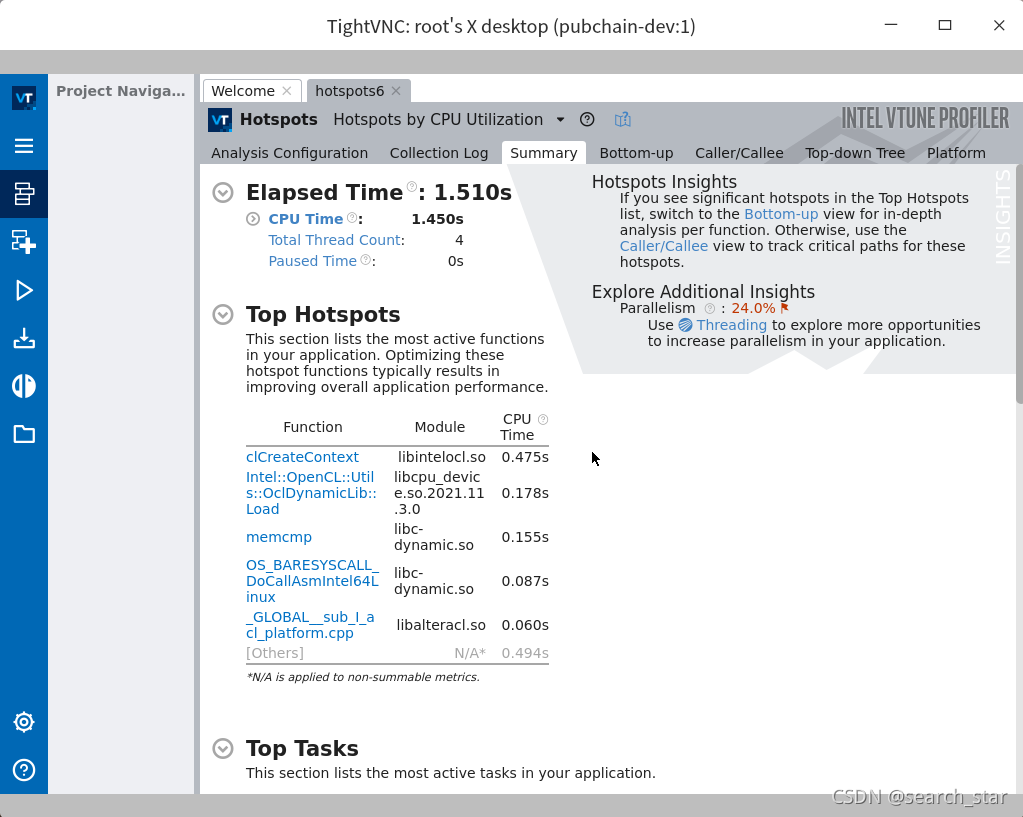
Elapsed Time: 1.510s
CPU Time: 1.450s
Effective Time: 1.450s
Idle: 0.030s
Poor: 1.420s
Ok: 0s
Ideal: 0s
Over: 0s
Spin Time: 0s
Imbalance or Serial Spinning: 0s
Lock Contention: 0s
Other: 0s
Overhead Time: 0s
Creation: 0s
Scheduling: 0s
Reduction: 0s
Atomics: 0s
Other: 0s
Total Thread Count: 4
Paused Time: 0s
Top Hotspots
Function Module CPU Time
----------------------------------------- ---------------------------- --------
clCreateContext libintelocl.so 0.475s
Intel::OpenCL::Utils::OclDynamicLib::Load libcpu_device.so.2021.11.3.0 0.178s
memcmp libc-dynamic.so 0.155s
OS_BARESYSCALL_DoCallAsmIntel64Linux libc-dynamic.so 0.087s
_GLOBAL__sub_I_acl_platform.cpp libalteracl.so 0.060s
[Others] N/A 0.494s
Top Tasks
Task Type Task Time Task Count Average Task Time
---------------- --------- ---------- -----------------
tbb_parallel_for 0.086s 11 0.008s
tbb_custom 0.033s 8 0.004s
Collection and Platform Info
Application Command Line: ./vector-add-buffers
Operating System: 4.15.0-144-generic DISTRIB_ID=Ubuntu DISTRIB_RELEASE=18.04 DISTRIB_CODENAME=bionic DISTRIB_DESCRIPTION="Ubuntu 18.04.5 LTS"
Computer Name: pubchain-dev
Result Size: 7.2 MB
Collection start time: 06:18:08 19/09/2021 UTC
Collection stop time: 06:18:10 19/09/2021 UTC
Collector Type: User-mode sampling and tracing
CPU
Name: Intel(R) Xeon(R) Processor code named Cascadelake
Frequency: 2.500 GHz
Logical CPU Count: 4
Cache Allocation Technology
Level 2 capability: not detected
Level 3 capability: not detected
If you want to skip descriptions of detected performance issues in the report,
enter: vtune -report summary -report-knob show-issues=false -r <my_result_dir>.
Alternatively, you may view the report in the csv format: vtune -report
<report_name> -format=csv.
查看结果
运行vtune -help report来查看如何生成报告。最简单的例子:
vtune -report hotspots -r <结果目录>
或者生成summary(其实就是刚跑完输出的那个东西):
vtune -report summary -r hotspots6/
或者把结果目录传送到本地,然后在本地也安装vtune,然后
vtune-gui <结果目录>
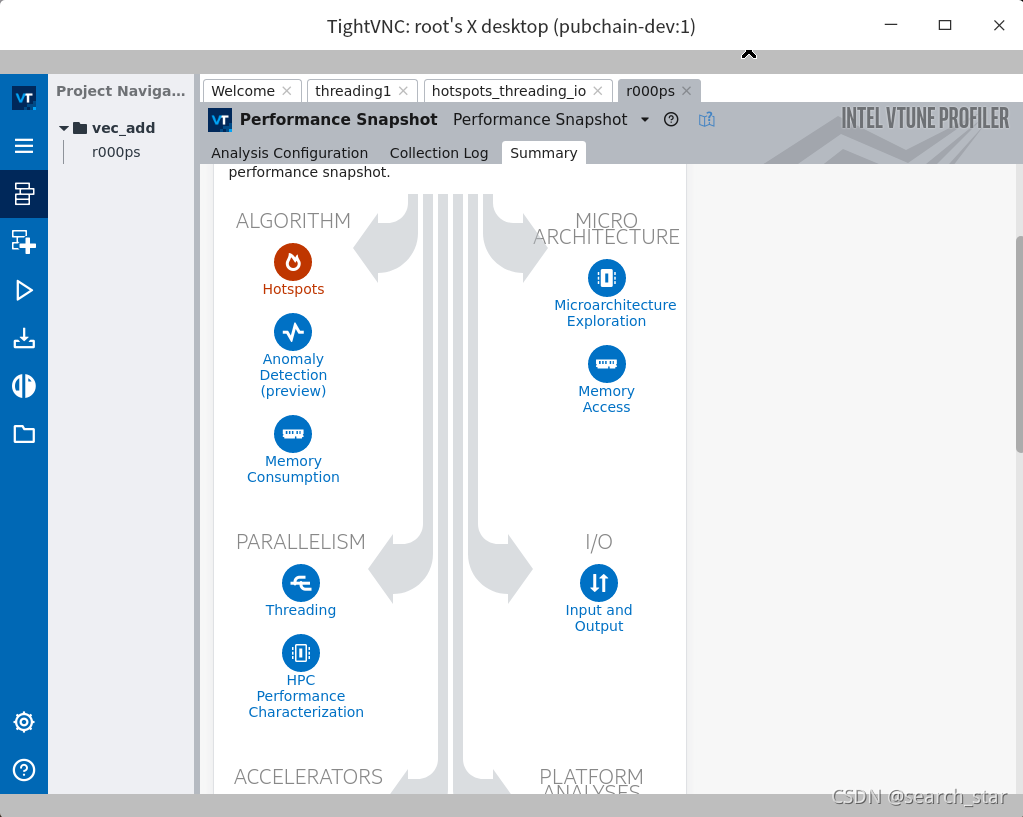
或者也可以参考这篇文章:vnc通过ssh隧道连接到Linux服务器,然后直接用服务器上的vtune-gui打开结果文件,并把窗口显示在本地:
事实上,通过vnc的方式,可以直接建一个vtune工程来做性能测试:


 1万+
1万+

 被折叠的 条评论
为什么被折叠?
被折叠的 条评论
为什么被折叠?
 到【灌水乐园】发言


