


1 介绍
osquery是一个由FaceBook开源用于对系统进行查询、监控以及分析的一款软件 。
我们在Linux中使用诸如ps、top、ls -l等等命令的时候,可以发下其实他们的输出结果的格式都是很固定的很像一张表。或许是基于这样的想法,facebook开发了osquery。osquery将操作系统当作是一个高性能的关系型数据库。使用osquery运行我们能够使用类似于SQL语句的方式去查询数据库中的信息,比如正在运行的进程信息,加载的内核模块,网络连接,浏览器插件等等信息(一切查询的信息的粒度取决于osquery的实现粒度了)。
2 安装:
下载地址:https://osquery.io/downloads/official/4.5.1
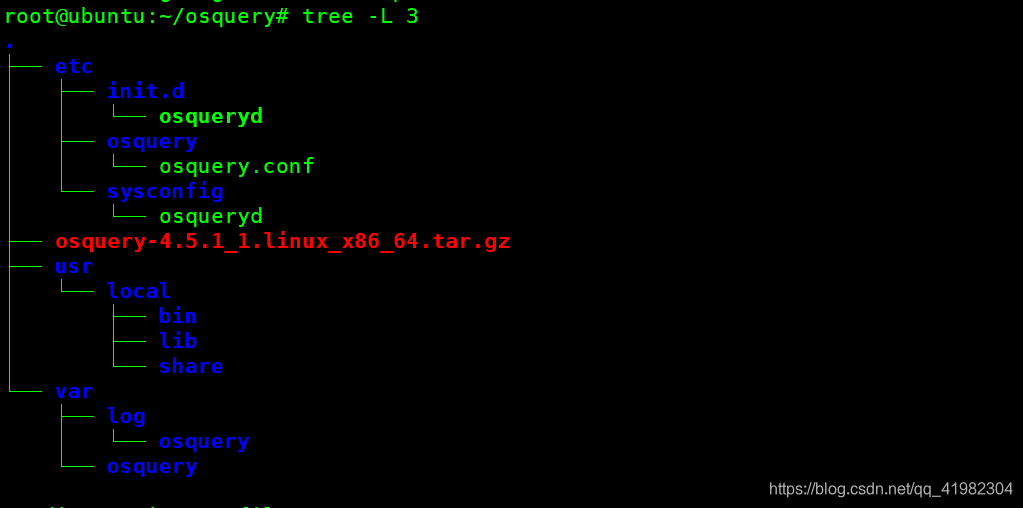
在根目录/下面解压
工具目录结构
3 启动
osqueryd存在两种运行模式,分别是osqueryi(交互模式),osqueryd(后台进程模式)
- osqueryi,与osqueryd安全独立,不需要以管理员的身份运行,能够及时地查看当前操作系统的状态信息。
- osqueryd,我们能够利用osqueryd执行定时查询记录操作系统的变化,例如在第一次执行和第二次执行之间的进程变化(增加/减少),osqueryd会将进程执行的结果保存(文件或者是直接打到kafka中)。osqueryd还会利用操作系统的API来记录文件目录的变化、硬件事件、网络行为的变化等等。osqueryd在Linux中是以系统服务的方式来运行。
3.1 启动osqueryi交互模式
-
[user@localhost Desktop]$ osqueryi
Using a virtual database. Need help, type '.help'
osquery> .help
Welcome to the osquery shell. Please explore your OS!
You are connected to a transient 'in-memory' virtual database.

.all [TABLE]     Select all from a table
.bail ON|OFF     Stop after hitting an error
.echo ON|OFF     Turn command echo on or off
.exit            Exit this program
.features        List osquery's features and their statuses
.headers ON|OFF  Turn display of headers on or off
.help            Show this message
.mode MODE       Set output mode where MODE is one of:
                   csv      Comma-separated values
                   column   Left-aligned columns see .width
                   line     One value per line
                   list     Values delimited by .separator string
                   pretty   Pretty printed SQL results (default)
.nullvalue STR   Use STRING in place of NULL values
.print STR...    Print literal STRING
.quit            Exit this program
.schema [TABLE]  Show the CREATE statements
.separator STR   Change separator used by output mode
.socket          Show the osquery extensions socket path
.show            Show the current values for various settings
.summary         Alias for the show meta command
.tables [TABLE]  List names of tables
.width [NUM1]+   Set column widths for "column" mode
.timer ON|OFF      Turn the CPU timer measurement on or off


============================================================================

osquery> .table
  => acpi_tables
  => apt_sources
  => arp_cache
  => augeas
  => authorized_keys
  => block_devices
  => carbon_black_info
  => carves
  => chrome_extensions
  => cpu_time
  => cpuid
  => crontab


============================================================================
# 查看系统信息

osquery> select * from system_info;
          hostname = localhost
              uuid = 4ee0ad05-c2b2-47ce-aea1-c307e421fa88
          cpu_type = x86_64
       cpu_subtype = 158
         cpu_brand = Intel(R) Core(TM) i5-8400 CPU @ 2.80GHz
cpu_physical_cores = 1
 cpu_logical_cores = 1
     cpu_microcode = 0x84
   physical_memory = 2924228608
   hardware_vendor =
    hardware_model =
  hardware_version =
   hardware_serial =
     computer_name = localhost.localdomain
    local_hostname = localhost


============================================================================
# 查看os版本
osquery> select * from os_version;
         name = CentOS Linux
      version = CentOS Linux release 7.4.1708 (Core)
        major = 7
        minor = 4
        patch = 1708
        build =
     platform = rhel
platform_like = rhel
     codename =


============================================================================
# 查看网卡信息

osquery> SELECT * FROM interface_addresses;
     interface = lo
       address = 127.0.0.1
          mask = 255.0.0.0
     broadcast =
point_to_point = 127.0.0.1
          type =

     interface = virbr0
       address = 192.168.122.1
          mask = 255.255.255.0
     broadcast = 192.168.122.255
point_to_point =
          type =

     interface = lo
       address = ::1
          mask = ffff:ffff:ffff:ffff:ffff:ffff:ffff:ffff
     broadcast =
point_to_point =
          type =
3.2 通过osqueryd后台进程记录日志
1 允许osquery访问系统日志
在此步骤中,我们修改操作系统的syslog程序,以允许osquery使用和查询系统日志。在Ubuntu上,这意味着修改 rsyslog配置文件。您需要进行的唯一修改是在配置文件中附加几行代码。
首先,打开/etc/rsyslog.conf文件,将以下行附加到文件
template(
  name="OsqueryCsvFormat"
  type="string"
  string="%timestamp:::date-rfc3339,csv%,%hostname:::csv%,%syslogseverity:::csv%,%syslogfacility-text:::csv%,%syslogtag:::csv%,%msg:::csv%\n"
)
*.* action(type="ompipe" Pipe="/var/osquery/syslog_pipe" template="OsqueryCsvFormat")
然后保存并关闭文件,并重新启动syslog守护程序。
sudo systemctl restart rsyslog2 创建osquery配置文件
创建配置文件可以更容易地运行osqueryi。osqueryi可以从位于其/etc/osquery/osquery.conf中的配置文件中读取这些选项,而不必传递大量命令行选项。当然,配置文件也可供守护进程使用。
配置文件还包含需要按计划执行的查询。但是,您可以按计划运行的大多数查询都将作为所谓的packs发送。软件包packs是位于/usr/share/osquery/packs目录中的文件。
osquery没有配置文件,但是有一个示例配置文件可以复制到/etc/osquery并修改。但是,该文件没有在Ubuntu等Linux发行版上运行它所需的所有选项,因此我们将创建自己的文件。
配置文件有三个部分:
- 守护程序选项和功能设置列表。这些也可以通过阅读
osqueryi。 - 要运行的计划查询列表以及运行时间。
- 用于执行更具体的计划查询的软件包列表。
以下是我们将用于配置文件的选项列表,它们的含义以及我们将其设置的值。此选项列表是足以运行osqueryi和osqueryd在Ubuntu and 其它Linux发行版。
config_plugin:希望osquery从哪里读取其配置。默认情况下,它们是从磁盘上的文件中读取的,因此它的值为filesystem。
logger_plugin:指定osquery应写入预定查询结果的位置。我们将再次使用filesystem。
logger_path:这是日志目录的路径,您可以在其中找到包含信息,警告,错误和计划查询结果的文件。默认情况下为/var/log/osquery。
disable_logging:通过将此值设置为false,我们可以启用日志记录。
log_result_events:通过将此值设置为true,日志中的每一行都将表示一个状态更改。
schedule_splay_percent:这告诉osquery,当以相同的间隔调度大量查询时,为了限制对服务器的性能影响,将它们分开运行。默认值为10百分比。
pidfile:在哪里编写osquery守护进程的进程id。默认为/var/osquery/osquery.pidfile。
events_expiry:以秒为单位,将订阅者结果保留在osquery后备存储中的时间。开箱后设置为3600。
database_path:osquery数据库的路径。我们将使用默认值,即/var/osquery/osquery.db。
verbose:启用日志记录后,将用于启用或禁用详细信息性消息。我们将此设置为false。
worker_threads:用于处理查询的工作分派线程数。默认设置为2,我们将保留它。
enable_monitor:用于启用或禁用计划监视器。我们将启用它,因此值将设置为true。
disable_events:用于管理osquery的发布/订阅系统。我们需要启用此功能,因此此处的值将设置为false。
disable_audit:用于禁用从操作系统的审计子系统接收事件。我们需要启用它,因此这里使用的值将是false。
audit_allow_config:允许审计发布者更改审计配置。默认是true。
audit_allow_sockets:允许审计发布者安装与套接字相关的规则。此值设置为true。
host_identifier:用于标识运行osquery的主机。当聚合来自多个服务器的结果时,有助于轻松确定特定日志条目来自哪个服务器。此值为hostname或uuid。开箱后设置为hostname,所以我们将使用该值。
enable_syslog:为了使osquery使用syslog信息,必须将其设置为true。
schedule_default_interval:未设置预定查询的时间间隔时,请使用此值。它大约几秒钟,我们将把它设置为3600。
打开配置文件 sudo vi /etc/osquery/osquery.conf ,将以下内容复制到文件中:/etc/osquery/osquery.conf
{
  "options": {
    "config_plugin": "filesystem",
    "logger_plugin": "filesystem",
    "logger_path": "/var/log/osquery",
    "disable_logging": "false",
    "log_result_events": "true",
    "schedule_splay_percent": "10",
    "pidfile": "/var/osquery/osquery.pidfile",
    "events_expiry": "3600",
    "database_path": "/var/osquery/osquery.db",
    "verbose": "false",
    "worker_threads": "2",
    "enable_monitor": "true",
    "disable_events": "false",
    "disable_audit": "false",
    "audit_allow_config": "true",
    "host_identifier": "hostname",
    "enable_syslog": "true",
    "audit_allow_sockets": "true",
    "schedule_default_interval": "3600"
  },
配置文件的下一部分是调度部分。每个查询都由一个键或名称标识,该键或名称在文件中必须是唯一的,然后是要运行的查询以及运行查询的间隔(以秒为单位)。我们将添加一个每300秒查看crontab表的预定查询。
将这些行添加到配置文件中:
  "schedule": {
    "crontab": {
      "query": "SELECT * FROM crontab;",
      "interval": 300
    }
  },
您可以编写任意数量的查询。只需保持正确的格式。如果不这样做,该文件将无法通过验证。例如,要添加更多查询,请添加以下行:
/etc/osquery/osquery.conf
  "schedule": {
    "crontab": {
      "query": "SELECT * FROM crontab;",
      "interval": 300
    },
    "system_profile": {
      "query": "SELECT * FROM osquery_schedule;"
    },
    "system_info": {
      "query": "SELECT hostname, cpu_brand, physical_memory FROM system_info;",
      "interval": 3600
    }
},在计划的查询之后,您可以添加称为装饰器(decorators)的特殊查询,这些查询是将数据添加到其他计划查询的查询。此处显示的装饰器查询将将运行osquery的主机的UUID和用户的用户名添加到每个计划的查询中。
将这些行附加到文件:
 "decorators": {
    "load": [
      "SELECT uuid AS host_uuid FROM system_info;",
      "SELECT user AS username FROM logged_in_users ORDER BY time DESC LIMIT 1;"
    ]
},最后,我们将osquery指向包含更多特定查询的包列表。每次安装osquery都会在/usr/share/osquery/packs中的提供一组默认包。其中一个包用于macOS,其余用于Linux系统。虽然您可以使用默认位置的包,但您也可以将它们复制到/etc/osquery目录中。
将这些行添加到文件中以完成该文件。
 "packs": {
     "osquery-monitoring": "/usr/share/osquery/packs/osquery-monitoring.conf",
     "incident-response": "/usr/share/osquery/packs/incident-response.conf",
     "it-compliance": "/usr/share/osquery/packs/it-compliance.conf",
     "vuln-management": "/usr/share/osquery/packs/vuln-management.conf"
  }
}
请注意末尾的右大括号,它与文件第一行的左大括号相匹配。完成的配置文件应如下所示:
{
  "options": {
    "config_plugin": "filesystem",
    "logger_plugin": "filesystem",
    "logger_path": "/var/log/osquery",
    "disable_logging": "false",
    "log_result_events": "true",
    "schedule_splay_percent": "10",
    "pidfile": "/var/osquery/osquery.pidfile",
    "events_expiry": "3600",
    "database_path": "/var/osquery/osquery.db",
    "verbose": "false",
    "worker_threads": "2",
    "enable_monitor": "true",
    "disable_events": "false",
    "disable_audit": "false",
    "audit_allow_config": "true",
    "host_identifier": "hostname",
    "enable_syslog": "true",
    "audit_allow_sockets": "true",
    "schedule_default_interval": "3600"
  },
  "schedule": {
    "crontab": {
      "query": "SELECT * FROM crontab;",
      "interval": 300
    },
    "system_profile": {
      "query": "SELECT * FROM osquery_schedule;"
    },
    "system_info": {
      "query": "SELECT hostname, cpu_brand, physical_memory FROM system_info;",
      "interval": 3600
    }
  },
  "decorators": {
    "load": [
      "SELECT uuid AS host_uuid FROM system_info;",
      "SELECT user AS username FROM logged_in_users ORDER BY time DESC LIMIT 1;"
    ]
  },
  "packs": {
     "osquery-monitoring": "/usr/share/osquery/packs/osquery-monitoring.conf",
     "incident-response": "/usr/share/osquery/packs/incident-response.conf",
     "it-compliance": "/usr/share/osquery/packs/it-compliance.conf",
     "vuln-management": "/usr/share/osquery/packs/vuln-management.conf"
  }
}
保存并关闭该文件,然后使用以下命令对其进行验证
sudo osqueryctl config-check
# 如果没有报错,证明配置没有错误
3 设置osquery文件完整性监控包
密切关注服务器上文件的完整性是监控其系统安全性的关键方面。为此,osquery提供了一个现成的解决方案。
您添加到上一部分配置中的包装是开箱后的。在本节中,我们将向列表中添加一个包,其中包含将用于文件完整性监视的查询和指令。在本教程中,我们将调用该文件fim.conf。
创建此文件并在编辑器中打开它:
sudo vi /usr/local/share/osquery/packs/fim.conf我们将创建一个软件包,每隔300秒监视/home,/etc以及/tmp目录中的文件事件。软件包文件的完整设置显示在以下文件列表中。将其复制到文件中。
{
  "queries": {
    "file_events": {
      "query": "select * from file_events;",
      "removed": false,
      "interval": 300
    }
  },
  "file_paths": {
    "homes": [
      "/root/.ssh/%%",
      "/home/%/.ssh/%%"
    ],
      "etc": [
      "/etc/%%"
    ],
      "home": [
      "/home/%%"
    ],
      "tmp": [
      "/tmp/%%"
    ]
  }
}
保存并关闭文件。
要使新文件及其规则可用于osquery,请在/etc/osquery/osquery.conf 末尾的包列表中引用它。打开文件进行编辑
sudo vi /etc/osquery/osquery.conf

# 然后修改包部分以包含新文件

...

"packs": {
     "fim": "/usr/share/osquery/packs/fim.conf",
     "osquery-monitoring": "/usr/share/osquery/packs/osquery-monitoring.conf",
     "incident-response": "/usr/share/osquery/packs/incident-response.conf",
     "it-compliance": "/usr/share/osquery/packs/it-compliance.conf",
     "vuln-management": "/usr/share/osquery/packs/vuln-management.conf"
  }


# 保存并关闭文件。只是为了确保没有在文件中出错,再次验证它:

sudo osqueryctl config-check
4 启动osqueryd
守护进程osqueryd允许osquery以设定的时间间隔运行查询。这些查询包括您在第四步中配置的查询,我们在该步骤中指定的包中的查询,以及我们在第五步中配置的FIM包中的查询。如果您尚未研究它们,现在是时候应该看一下/usr/share/osquery/packs的内容。
osqueryd生成的结果将写入/var/log/osquery目录中调用的文件osqueryd.results.log中。开箱后,该文件不存在。它仅在守护程序启动时创建并开始生成结果。
你可以开始使用systemctl或osqueryctl启动osqueryd。两者都完成了同样的事情,所以你使用哪一个并不重要。osqueryd将在启动时检查配置文件是否存在,并在未找到配置文件时提醒您。它将在没有配置文件的情况下继续运行,尽管它不会做任何有用的事情。
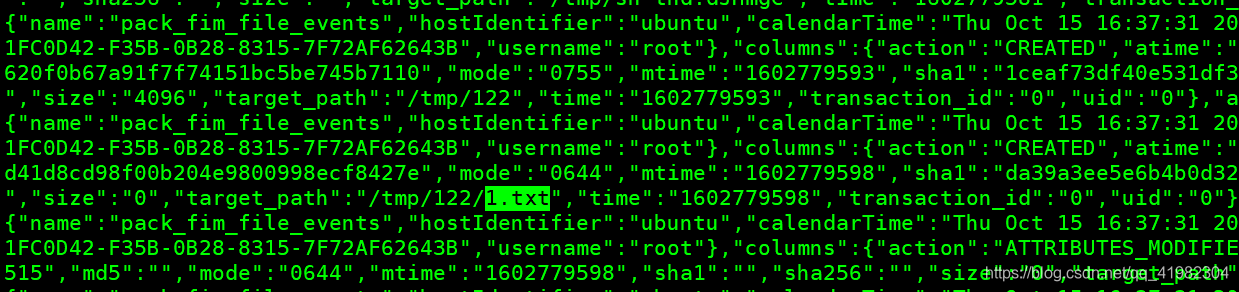
启动程序 ./osqueryd --allow_unsafe=true
测试结果: 在/tmp目录下面添加122目录和1.txt 日志记录如下
osquery官方文档:https://osquery.io/


 527
527

 被折叠的 条评论
为什么被折叠?
被折叠的 条评论
为什么被折叠?
 到【灌水乐园】发言


