


- 1.预测两个点
import numpy as np
from sklearn.linear_model import LinearRegression
import matplotlib.pyplot as plt

# # 预测两个点
# # 两个点的横坐标
X = [[1], [6]]
# # 两个点的纵坐标
y = [4, 6]

lrs = LinearRegression().fit(X, y)
plt.scatter(X, y, s=80)
z = np.linspace(0, 5, 20)
plt.xlim(0, 7)
plt.ylim(3, 7)
plt.plot(z, lrs.predict(z.reshape(-1, 1)))
# print("打印直线方程", "y=", '{:.3f}'.format(lrs.coef_[0]), "x", "+", '{:.3f}'.format(lrs.intercept_))
print("打印直线方程:y={:.3f}x+{:.3f}".format(lrs.coef_[0], lrs.intercept_))
plt.show()
拟合情况:
*
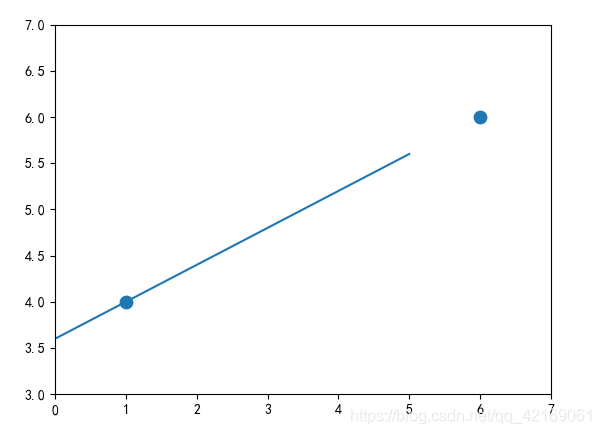
直线方程为:
- 2.预测三个点的情况。
# 预测三个点
X = [[1], [4], [3]]
y = [3, 5, 3]
lrs = LinearRegression().fit(X, y)
plt.scatter(X, y, c='orange')
z = np.linspace(0, 5, 20)
plt.plot(z, lrs.predict(z.reshape(-1, 1)), c='red')
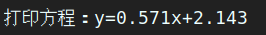
print("打印方程:y={:.3f}x+{:.3f}".format(lrs.coef_[0], lrs.intercept_))
plt.show()
拟合情况:
*
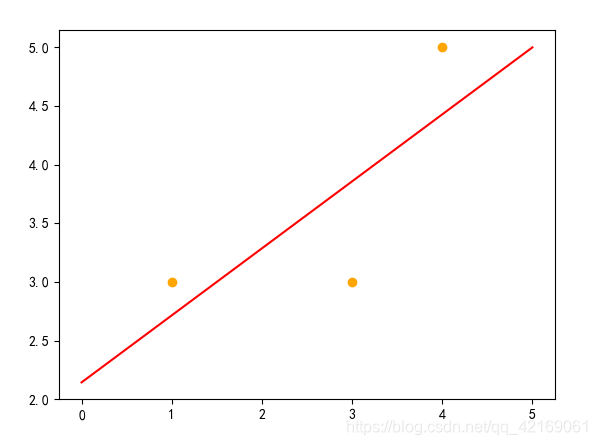
直线方程:
- 3.预测多个点是:
# 预测多个点
from sklearn.datasets import make_regression

X, y = make_regression(n_samples=50, n_features=1, n_informative=1, noise=50, random_state=1)
lrs = LinearRegression().fit(X, y)
z = np.linspace(-3, 3, 500)
print("打印方程:y={:.3f}x+{:.3f}".format(lrs.coef_[0], lrs.intercept_))

plt.scatter(X, y, c='orange')
plt.plot(z, lrs.predict(z.reshape(-1, 1)))
plt.show()
拟合情况:*
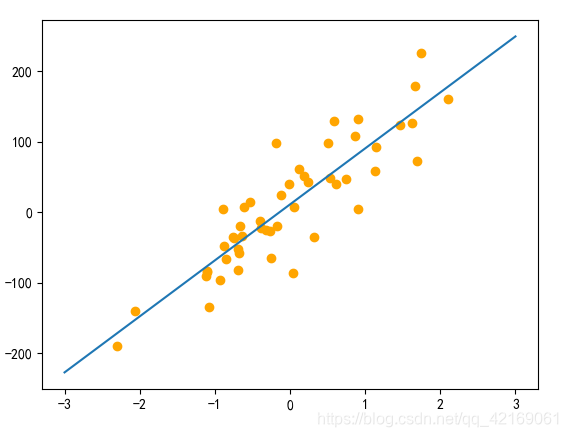
直线方程:


 5252
5252

 被折叠的 条评论
为什么被折叠?
被折叠的 条评论
为什么被折叠?
 到【灌水乐园】发言


