


一、需求描述
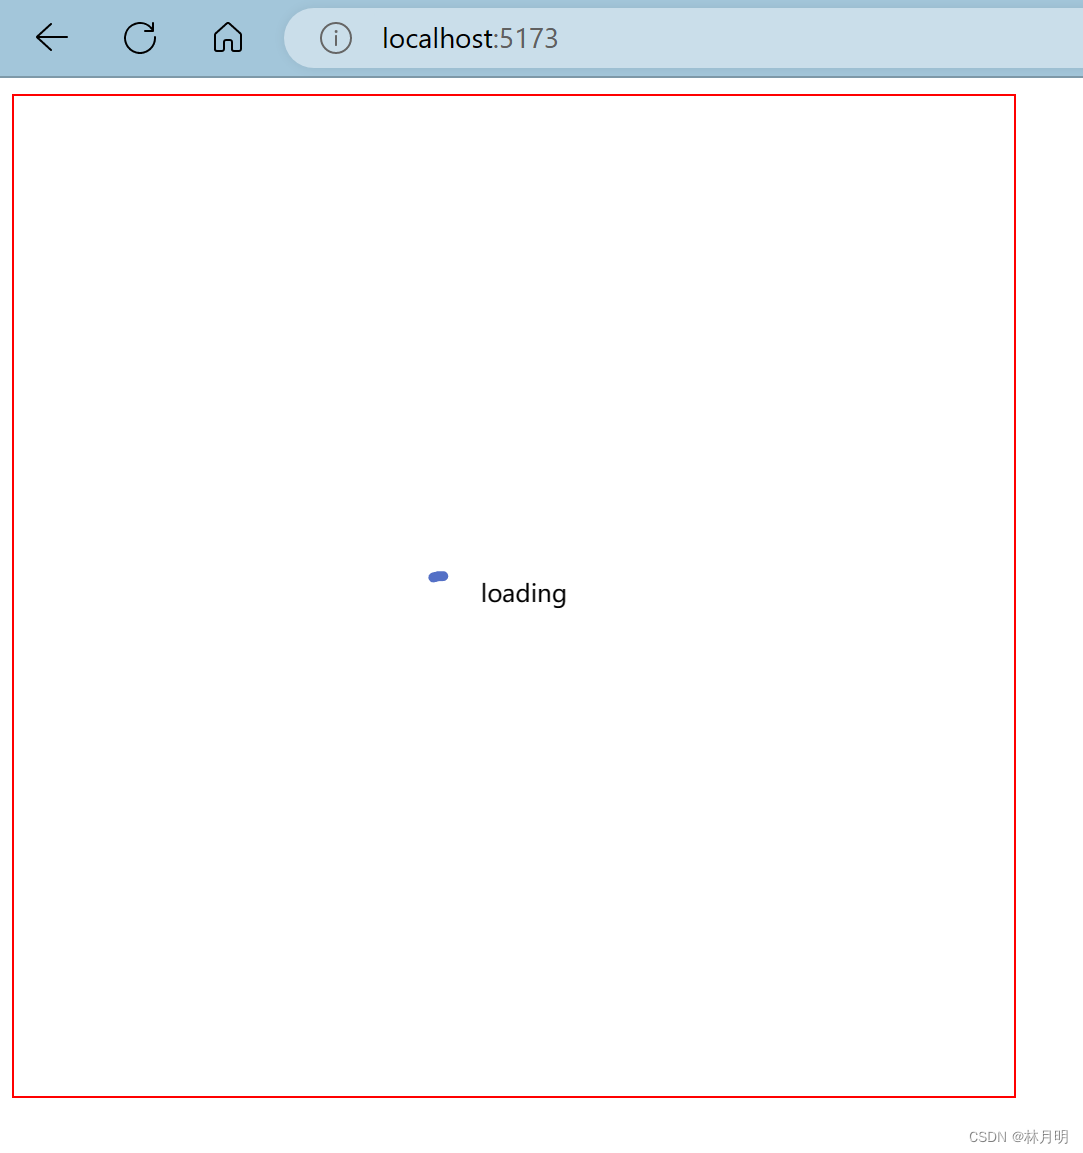
当网页正在加载而处于空白页面状态时,可以在该页面上显示加载动画提示。
二、步骤代码
1、全局下载npm install -g json-server
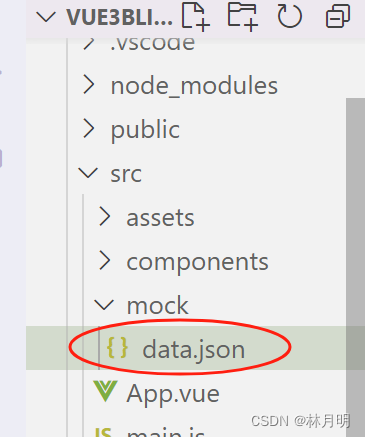
npm install -g json-server2、在src目录下新建文件夹mock,新建文件data.json存放模拟数据
{
    "one":[
        {
                "value": 67,
                "name": "美食",
                "itemStyle":{
                     "normal":{
                        "color":"rgb(132,112,255)"
                     }
                            }
            },
            {
                "value": 85,
                "name": "服饰" ,
                "itemStyle":{
                     "normal":{
                        "color":"rgb(34,139,34)"
                     }
                            }
            },
            {
                "value": 45,
                "name": "数码",
                "itemStyle":{
                     "normal":{
                        "color":"rgb(0,206,209)"
                     }
                            }
        },
            {
                "value": 98,
                "name": "家电" ,
                "itemStyle":{
                     "normal":{
                        "color":"rgb(255,127,0)"
                     }
                            }
        }
    ]
}
3、在mock目录下启动json-server
json-server --watch data.json --port 88884、下载数据请求内容npm install --save axios
npm install --save axios如果加载缓慢,先更换npm的安装镜像源为国内的:
npm config set registry https://registry.npm.taobao.org可查看镜像是否安装:
npm config get registry5、启动项目
npm run dev 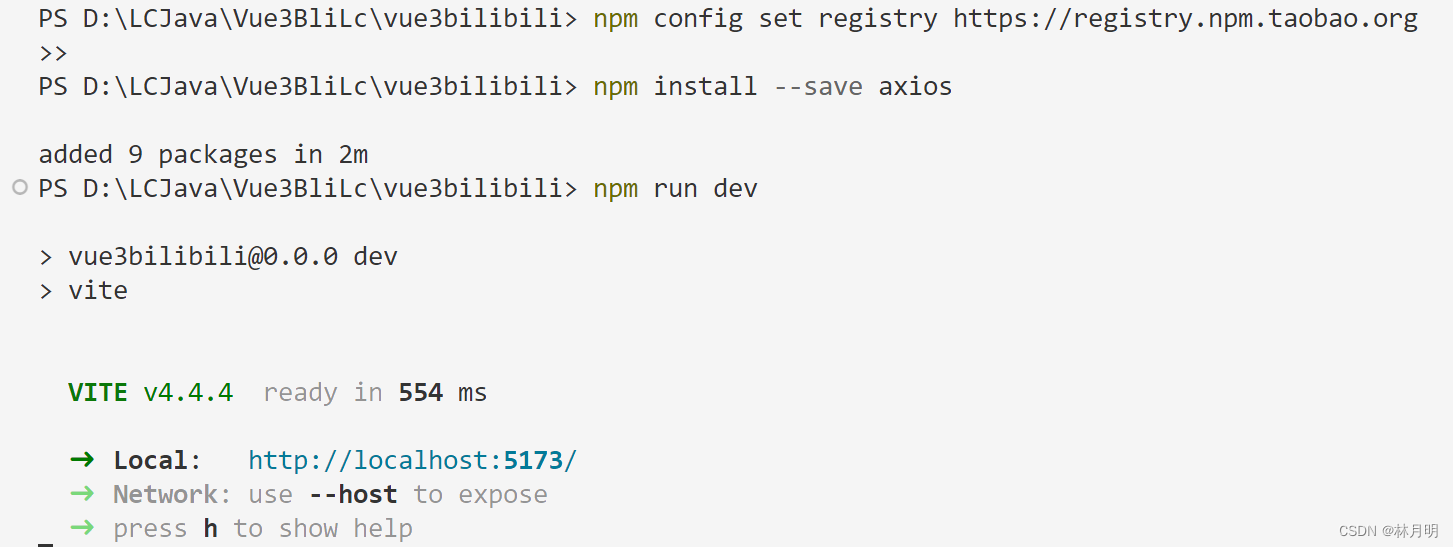
<template>
    <div ref="myChart" id="myChart"></div>
</template>
<script>
import * as echarts from "echarts"
import axios from "axios"
export default {
     data(){
         return {
             eData:[]
         }
     },
    methods:{
        async linkData(){
            let echarsdata=await axios({url:"http://localhost:8888/one"})
            console.log(echarsdata)
            this.eData=echarsdata.data
        }
    },
    mounted(){

        let myChart=echarts.init(this.$refs.myChart) // 2.设置echarts数据

        //开始等待
        myChart.showLoading()
        //请求完毕再渲染
        this.linkData().then(()=>{

        //结束等待
        myChart.hideLoading()

        //3.设置配置项

        let option={
            title: {
                text: '饼状图',
                subtext: '基本设置',
                left: 'center'//设置位置居中
                },
            tooltip: {
                trigger: 'item'//触发类型item数据项图形触发
            },
            legend: {
                orient: 'vertical',//图例列表的布局朝向vertical纵向
                left: 'left'
            },
            series: [
                    {
                    name: '销售量',
                    type: 'pie',//饼图主要用于表现不同类目的数据在总和中的占比。每个的弧度表示数据数量的比例。
                    radius: ['40%', '70%'], //饼图的半径。数组的第一项是内半径,第二项是外半径。
                    // 设置环形图
                    label: {
                        //饼图图形上的文本标签
                        show: true,
                        position:"inside",//outside饼图扇区外侧inside饼图扇区内部center在饼图中心位置
                        color:"yellow"
                     },
                    labelLine: {//标签的视觉引导线配置
                        show: false
                    },
                    roseType: 'area',//是否展示成南丁格尔图,通过半径区分数据大小
                    itemStyle: {//设置内容样式
                        color: '#c23531',
                        shadowBlur: 200,
                        //shadowColor: 'rgba(0, 0, 0, 0.5)'
                        shadowColor: 'rgba(255,193,37,0.5)'
                     },
                    data:this.eData
                    //data
                 } ]
                 }
                    // 4.设置图表绘制图表
                myChart.setOption(option)


        })


        //1.初始化
        // let data=[
        //     {
        //         value: 67,
        //         name: '美食' ,
        //         itemStyle:{
        //              normal:{
        //                 color:'rgb(132,112,255)'//香芋紫
        //              }
        //                     }
        //     },
        //     { value: 85,
        //         name: '服饰' ,
        //         itemStyle:{
        //              normal:{
        //                 color:'rgb(34,139,34)'//暗绿色
        //              }
        //                     }
        //     },
        //     { value: 45, name: '数码' ,
        //         itemStyle:{
        //              normal:{
        //                 color:'rgb(0,206,209)'//湖蓝色
        //              }
        //                     }
        // },
        //     { value: 98, name: '家电' ,
        //         itemStyle:{
        //              normal:{
        //                 color:'rgb(255,127,0)'//湖蓝色
        //              }
        //                     }
        // }
        // ]

            }
        }

</script>
<style>
    #myChart{
        width: 500px;
        height: 500px;
        border: 1px solid red;
        }
</style>
其中,在渲染完毕前后引用showLoading和hideLoading实现加载动漫效果
//开始等待
myChart.showLoading()

//请求完毕再渲染
this.linkData().then(()=>{
//结束等待
myChart.hideLoading()

//略
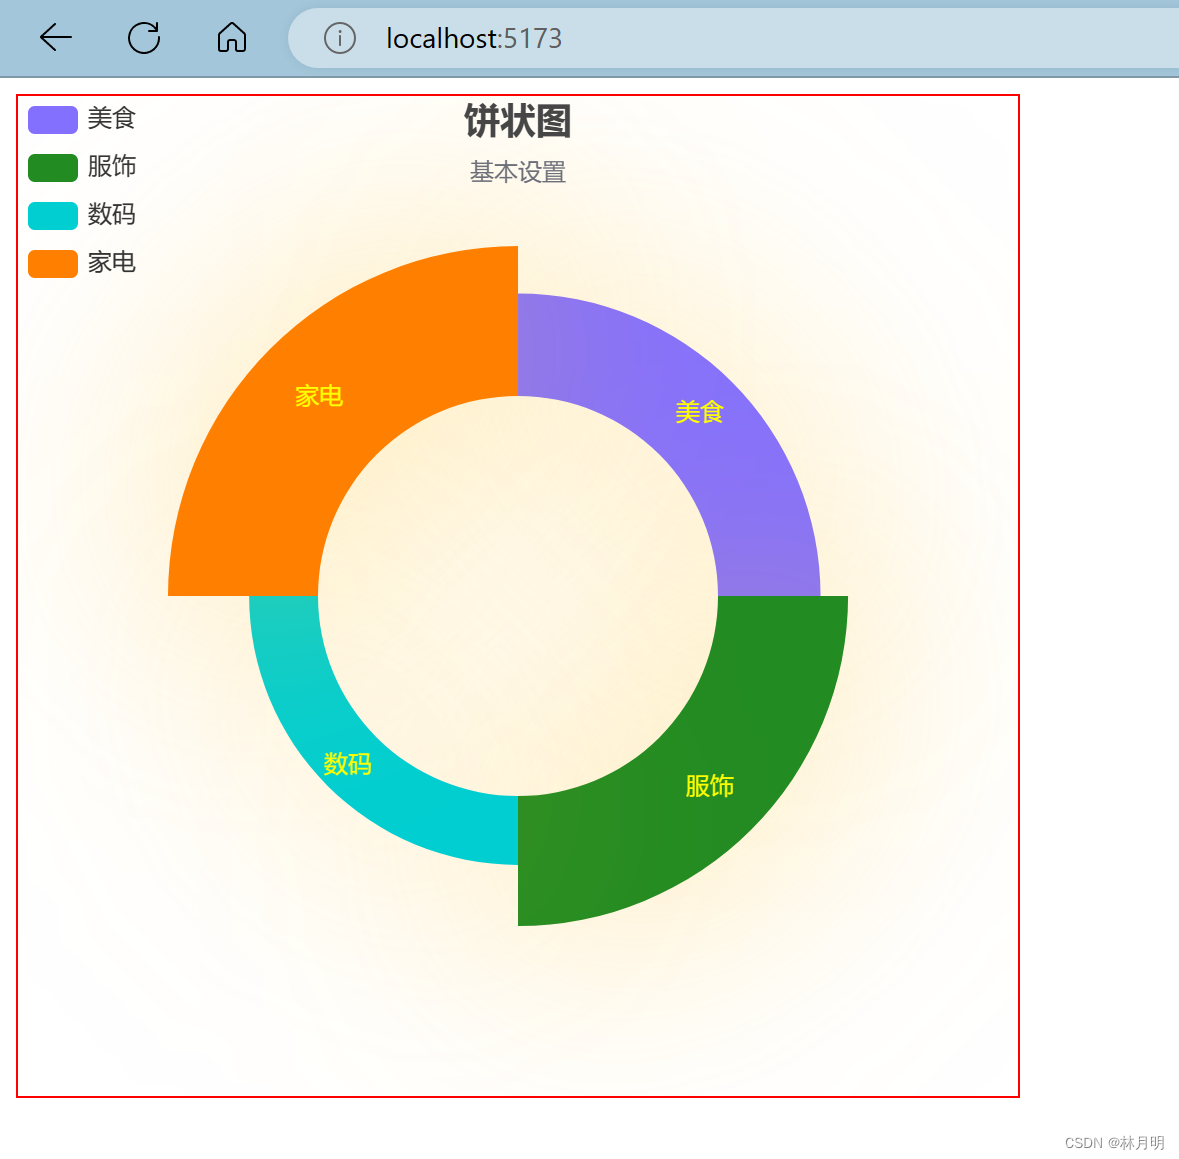
三、效果展示
1、
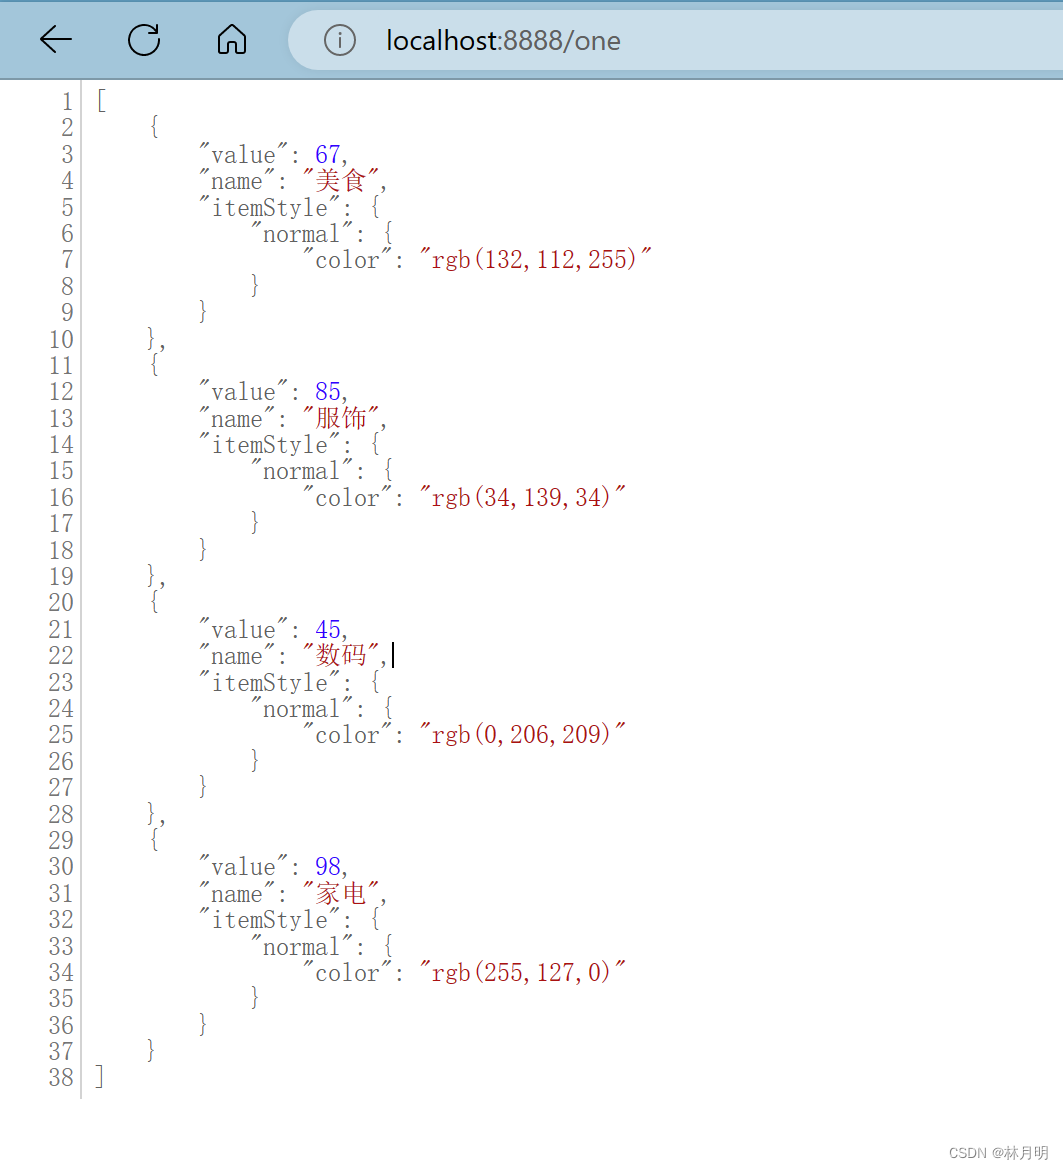
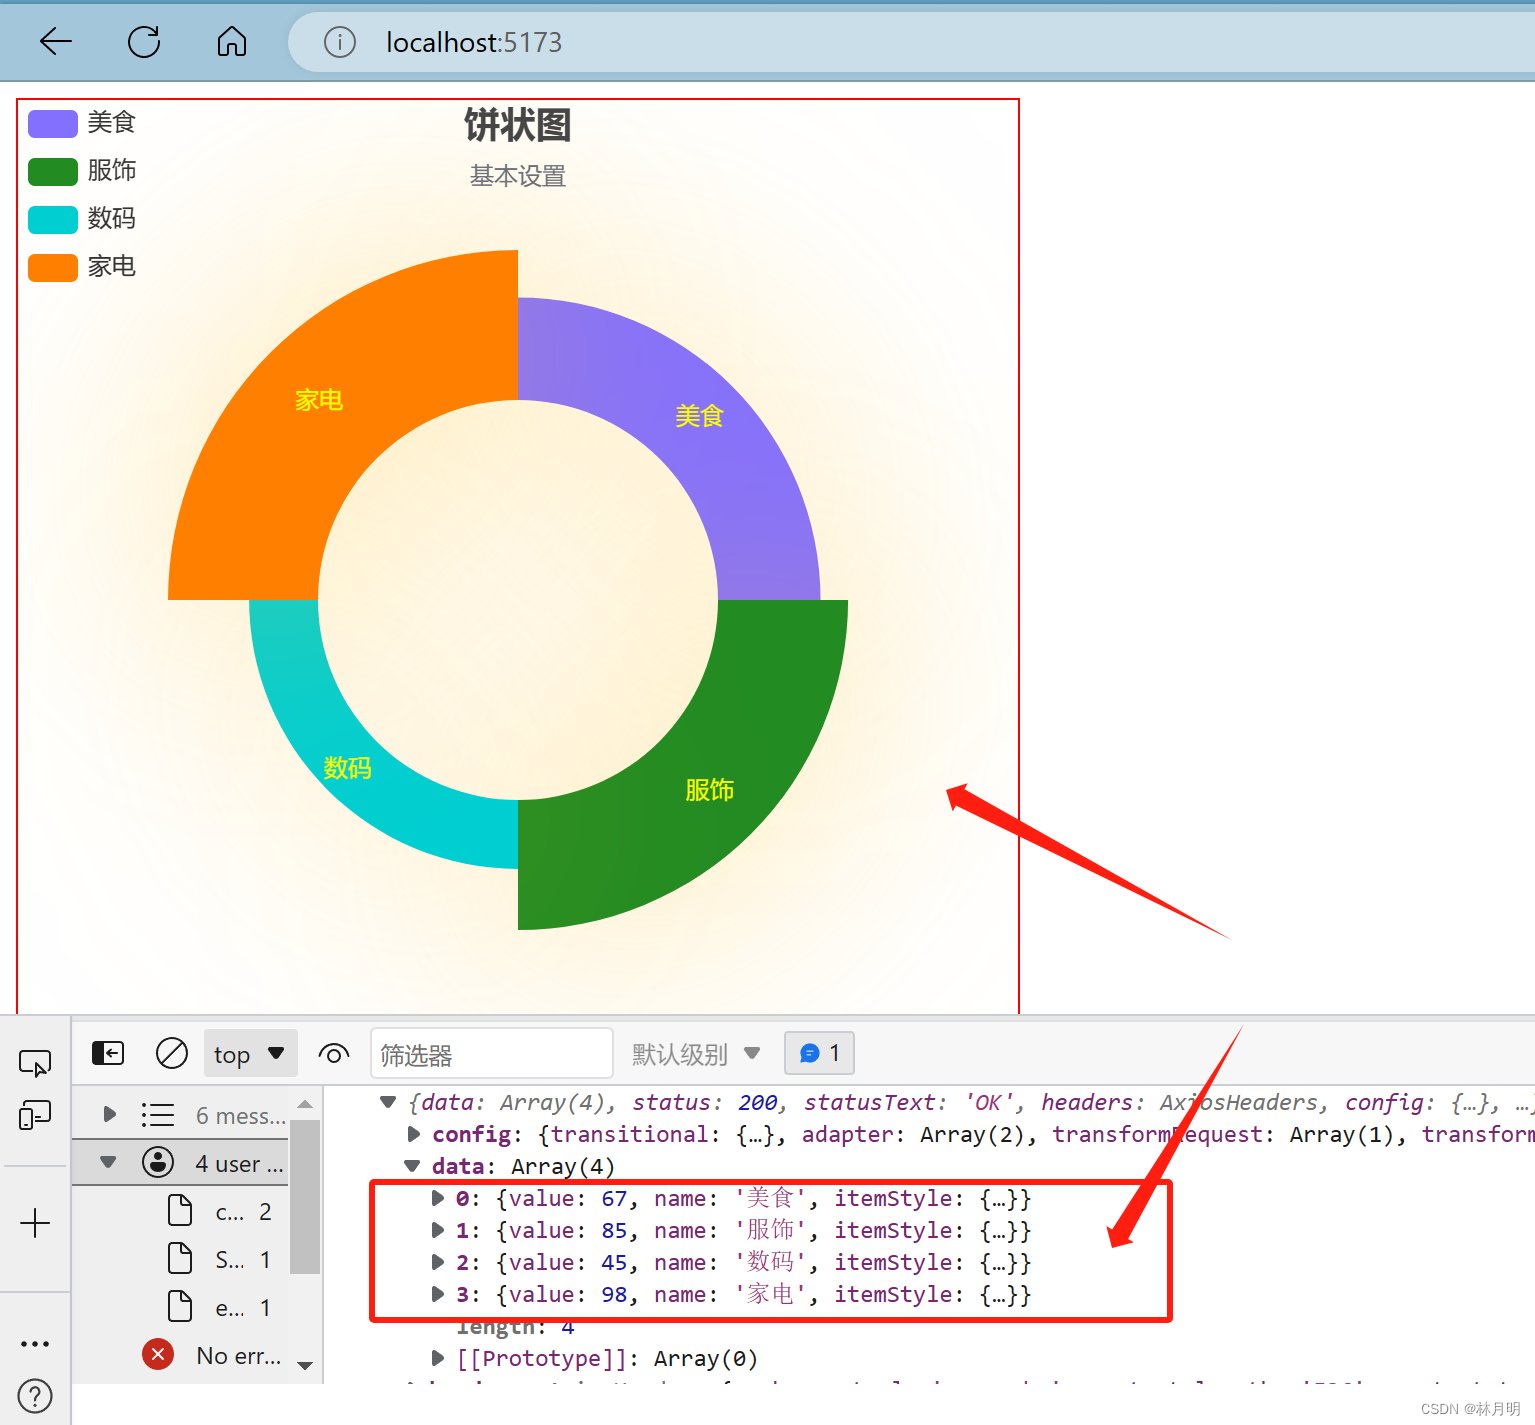
获取到上图的数据自动加载到下图中
2、加载动漫效果
网页设置网速方法:

3、页面渲染效果
四、学习链接
2、遇到的问题及解决方法https://blog.csdn.net/qq_42294095/article/details/133807195?spm=1001.2014.3001.5501


 2437
2437


 被折叠的 条评论
为什么被折叠?
被折叠的 条评论
为什么被折叠?
 到【灌水乐园】发言


