


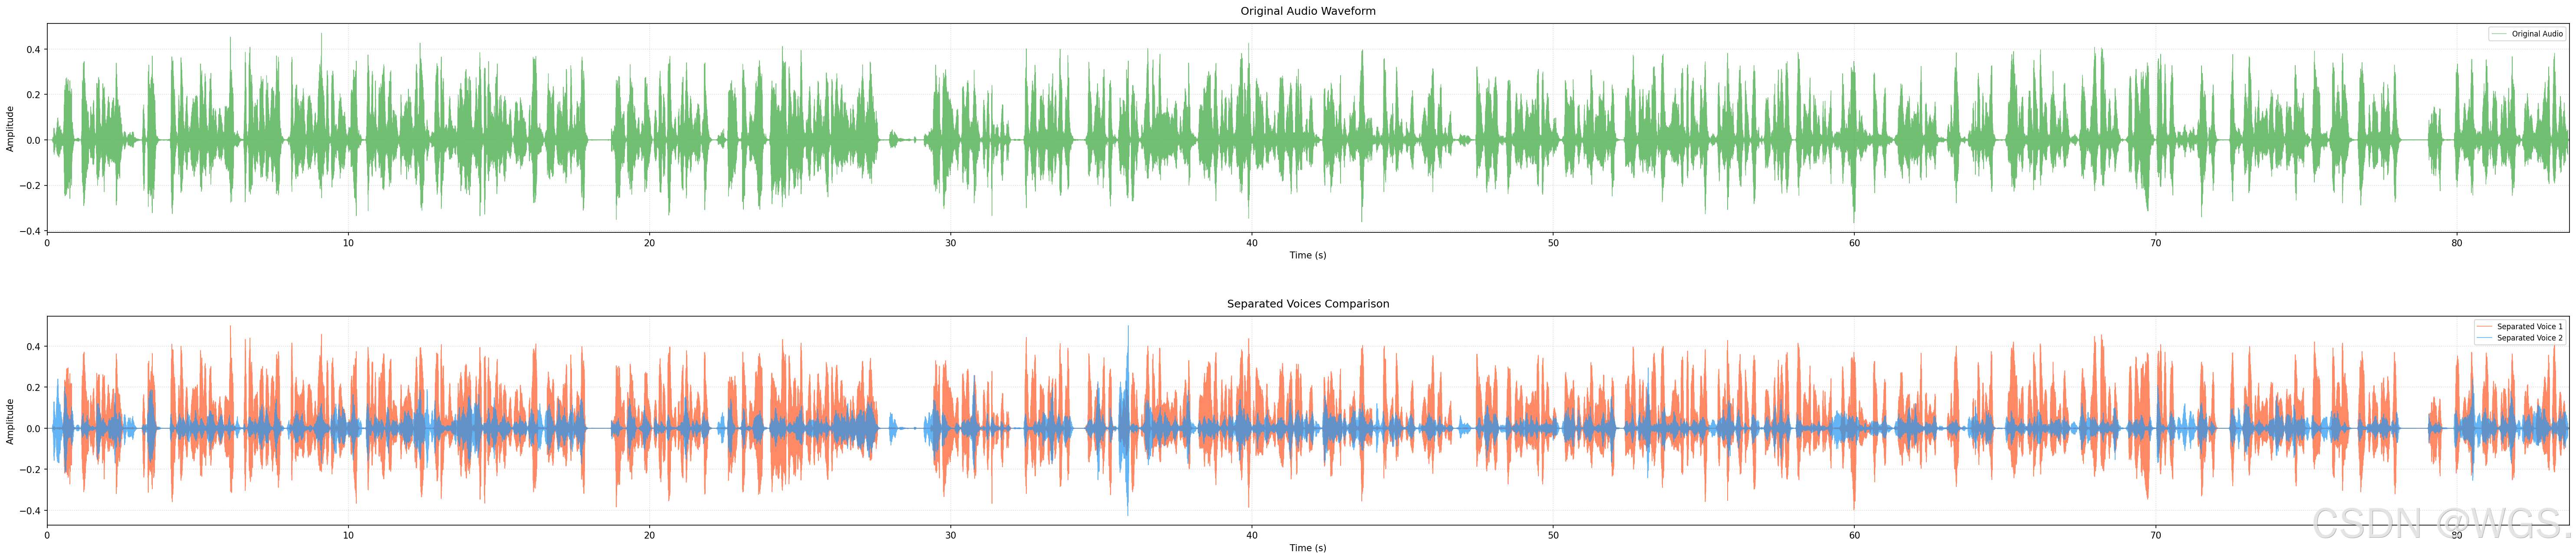
将单音轨的音频进行分离后,保存波形图作为对比:
import matplotlib.pyplot as plt
import numpy as np
import torchaudio

def plot_dual_waveforms(input_path_ori, input_path1, input_path2, output_path="waveform_comparison.png"):

    def get_array_time(input_path):
        # 单通道、8k
        arr, arr_rate = torchaudio.load(input_path)
        arr = arr.squeeze().numpy()
        # 生成时间轴(单位:秒)意味着每个采样点的时间间隔为 1/8000 秒。将每个采样点的索引除以 8000,就能得到对应的时间。例如,索引 8000 除以 8000 得到 1 秒,索引 16000 得到 2 秒,以此类推。
        time = np.arange(len(arr)) / arr_rate
        return arr, arr_rate, time

    arr_ori, arr_ori_rate, time_ori = get_array_time(input_path_ori)
    arr1, arr1_rate, time1 = get_array_time(input_path1)
    arr2, arr2_rate, time2 = get_array_time(input_path2)

    print("[DEBUG] arr_ori: ", arr_ori.shape, arr_ori_rate)
    print("[DEBUG] arr1: ", arr1.shape, arr1_rate)
    print("[DEBUG] arr2: ", arr2.shape, arr2_rate)
    print(f"[DEBUG] time_ori: {len(time_ori)} time1: {len(time1)}, time2: {len(time2)}")

    # 创建画布和子图
    plt.figure(figsize=(50, 10), dpi=150)
    plt.subplots_adjust(hspace=0.4)  # 调整子图间距

    # ----------------- 子图1:原始音频波形 -----------------
    ax1 = plt.subplot(2, 1, 1)
    ax1.plot(time_ori, arr_ori,
            color='#4CAF50',  # 绿色
            alpha=0.8,
            linewidth=0.6,
            label='Original Audio')

    # 图表装饰
    ax1.set_title("Original Audio Waveform", fontsize=12, pad=10)
    ax1.set_xlabel("Time (s)", fontsize=10)
    ax1.set_ylabel("Amplitude", fontsize=10)
    ax1.grid(True, linestyle=':', alpha=0.5)
    ax1.set_xlim(0, time_ori[-1])
    ax1.legend(loc='upper right', fontsize=8)

    # ----------------- 子图2:分离结果对比 -----------------
    ax2 = plt.subplot(2, 1, 2)
    # 绘制分离结果1(需要插值对齐)
    ax2.plot(time1, arr1,
            color='#FF5722',  # 橙色
            alpha=0.7,
            linewidth=0.8,
            label='Separated Voice 1')

    # 绘制分离结果2
    ax2.plot(time2, arr2,
            color='#2196F3',  # 蓝色
            alpha=0.7,
            linewidth=0.8,
            label='Separated Voice 2')

    # 图表装饰
    ax2.set_title("Separated Voices Comparison", fontsize=12, pad=10)
    ax2.set_xlabel("Time (s)", fontsize=10)
    ax2.set_ylabel("Amplitude", fontsize=10)
    ax2.grid(True, linestyle=':', alpha=0.5)
    ax2.set_xlim(0, time_ori[-1])
    ax2.legend(loc='upper right', fontsize=8)

    plt.savefig(output_path, bbox_inches='tight')
    print(f"结果已保存至: {output_path}")
    plt.show()
    plt.close()


 4572
4572

 被折叠的 条评论
为什么被折叠?
被折叠的 条评论
为什么被折叠?
 到【灌水乐园】发言


