import matplotlib.pyplot as plt
%matplotlib inline
import numpy as np
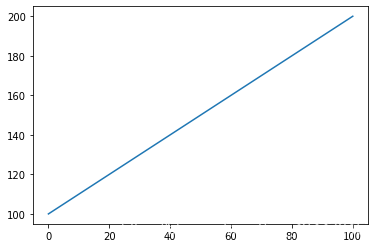
data_one = np.arange(100,201)
plt.plot(data_one)
plt.show()
figure_obj = plt.figure()
<Figure size 432x288 with 0 Axes>
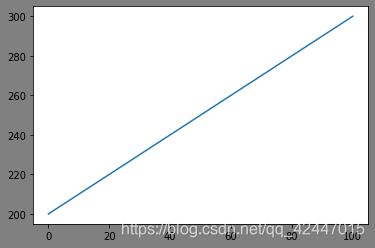
data_two = np.arange(200,301)
plt.figure(facecolor = 'gray')
plt.plot(data_two)
plt.show()
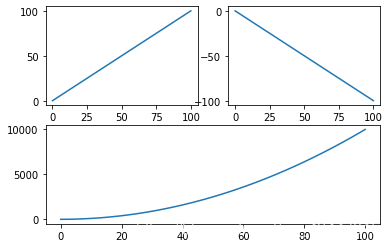
nums = np.arange(0, 101)
plt.subplot(221)
plt.plot(nums, nums)
plt.subplot(222)
plt.plot(nums, -nums)
plt.subplot(212)
plt.plot(nums, nums**2)
plt.show()
nums = np.arange(1,101)
fig,axes = plt.subplots(2,2)
ax1 = axes[0,0]
ax2 = axes[0,1]
ax3 = axes[1,0]
ax4 = axes[1,1]
ax1.plot(nums,nums)
ax2.plot(nums,-nums)
ax3.plot(nums,nums**2)
ax4.plot(nums,np.log(nums))
plt.show()
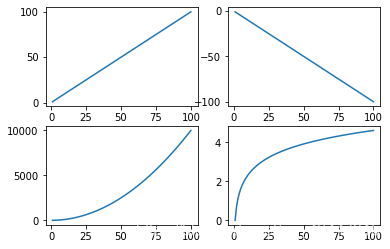
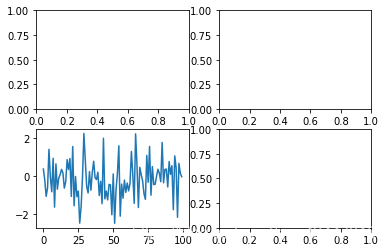
fig = plt.figure()
fig.add_subplot(2,2,1)
fig.add_subplot(2,2,2)
fig.add_subplot(2,2,4)
fig.add_subplot(2,2,3)
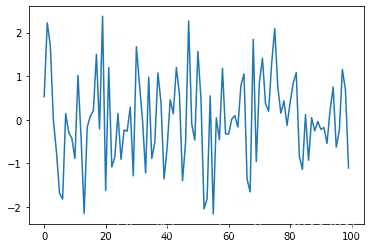
random_arr = np.random.randn(100)
plt.plot(random_arr)
plt.show()
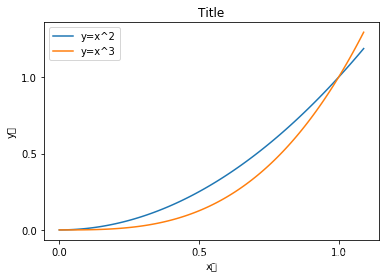
data = np.arange(0,1.1,0.01)
plt.title("Title")
plt.xlabel("x轴")
plt.ylabel("y轴")
plt.xticks([0,0.5,1.])
plt.yticks([0,0.5,1.0])
plt.plot(data,data**2)
plt.plot(data,data**3)
plt.legend(["y=x^2","y=x^3"])
plt.show()
c:\programdata\miniconda3\lib\site-packages\matplotlib\backends\backend_agg.py:211: RuntimeWarning: Glyph 36724 missing from current font.
  font.set_text(s, 0.0, flags=flags)
c:\programdata\miniconda3\lib\site-packages\matplotlib\backends\backend_agg.py:180: RuntimeWarning: Glyph 36724 missing from current font.
  font.set_text(s, 0, flags=flags)
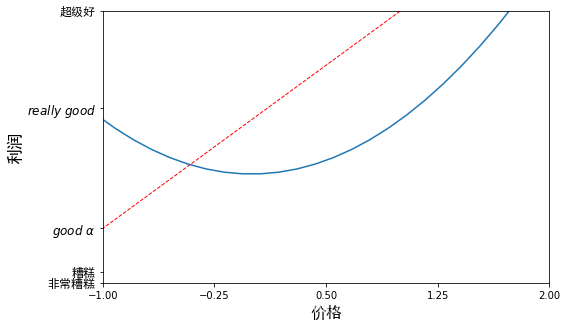
x=np.linspace(-3,3,50)
y1=2*x+1
y2=x**2
plt.figure(num=3,figsize=(8,5))
plt.plot(x,y2)
plt.plot(x,y1,color='red',linewidth=1.0,linestyle='--')
plt.xlim((-1,2))
plt.ylim((-2,3))
plt.xlabel(u'价格',fontproperties='SimHei',fontsize=16)
plt.ylabel(u'利润',fontproperties='SimHei',fontsize=16)
new_ticks = np.linspace(-1,2,5)
plt.xticks(new_ticks)
'''
设置对应坐标用汉字的话后面要加fontproperties表示中文可见,不乱码,
内部$$表示将英文括起来,r表示正则匹配,通过这个方式变好看字体
'''
plt.yticks([-2,-1.8,-1,1.22,3.],
['非常糟糕','糟糕',r'$good\ \alpha$',
r'$really\ good$','超级好'],
fontproperties='SimHei',
fontsize=12)
plt.show()
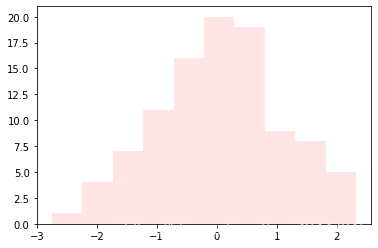
arr_random = np.random.randn(100)
plt.hist(arr_random,color='r',alpha=0.1)
plt.show()
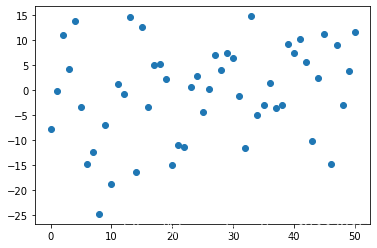
x = np.arange(51)
y=np.random.randn(51)*10
plt.scatter(x,y)
plt.show()
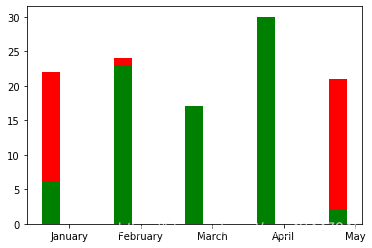
x = np.arange(5)
y1,y2 = np.random.randint(1,31,size=(2,5))
width = 0.25
ax = plt.subplot(1,1,1)
ax.bar(x,y1,width,color='r')
ax.bar(x,y2,width,color='g')
ax.set_xticks(x+width)
ax.set_xticklabels(['January','February','March','April','May'])
plt.show()
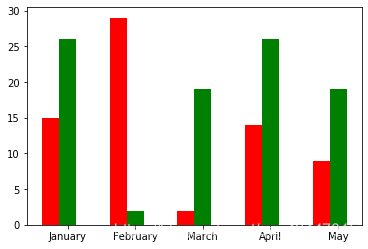
x = np.arange(5)
y1,y2 = np.random.randint(1,31,size=(2,5))
width = 0.25
ax = plt.subplot(1,1,1)
ax.bar(x,y1,width,color='r')
ax.bar(x+width,y2,width,color='g')
ax.set_xticks(x+width)
ax.set_xticklabels(['January','February','March','April','May'])
plt.show()
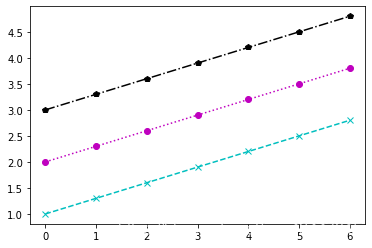
data = np.arange(1,3,0.3)
plt.plot(data,color='c',marker='x',linestyle='--')
plt.plot(data+1,color='m',marker='o',linestyle=':')
plt.plot(data+2,color='k',marker='p',linestyle='-.')
plt.show()
random_arr = np.random.randn(100)
random_arr
array([ 0.52851225,  2.22587671,  1.70541925, -0.01248011, -0.73832166,
       -1.68238072, -1.81846121,  0.14346166, -0.29146827, -0.42109824,
       -0.88699051,  1.01819922, -0.4053999 , -2.14903317, -0.1704158 ,
        0.0806964 ,  0.20905355,  1.50184498, -0.20797643,  2.37610819,
       -1.61843131,  1.19821952, -1.07977263, -0.84408483,  0.14130412,
       -0.90749214, -0.23462857, -0.25926941,  0.29015708, -1.28330241,
        1.67736094,  0.81749851, -0.02203292, -1.21862277,  0.9806513 ,
       -0.88705744, -0.51392659,  1.07381804,  0.39607708, -1.35718391,
       -0.63406392,  0.46163201,  0.13907861,  1.20005873,  0.58875872,
       -1.39768646, -0.51804181,  2.26820478, -0.10115267, -0.46235408,
        1.5684129 ,  0.48886282, -2.04363682, -1.80941274,  0.5488707 ,
       -2.15815526,  0.04489968, -0.45732648,  1.18276542, -0.32214849,
       -0.32456045,  0.01230255,  0.09536457, -0.16511463,  0.78685366,
        1.05427218, -1.36155835, -1.65287526,  1.84676703, -0.95822676,
        0.84688348,  1.41210068,  0.37439514,  0.19486922,  1.29708789,
        2.09422653,  0.74602061,  0.15137622,  0.43635037, -0.12791271,
        0.39207315,  0.84217839,  1.08197702, -0.83662675, -1.13730601,
        0.11971138, -0.92671361,  0.0500984 , -0.25444054, -0.03739957,
       -0.22052255, -0.17606328, -0.5411113 ,  0.21712851,  0.74975307,
       -0.6279891 , -0.24896474,  1.15523704,  0.67991644, -1.10354087])
plt.plot(random_arr)
plt.show()


 3万+
3万+

 被折叠的 条评论
为什么被折叠?
被折叠的 条评论
为什么被折叠?
 到【灌水乐园】发言


