


Echarts tooltip框封装(不包含show、trigger、confine、axisPointer)
仅封装了tooltip框字体颜色,字体大小
框的大小可字体大小均可以比较完美的适配不同分辨率
echarts代码中包含了x轴标签文字过长的处理办法-----请见 2处代码
(方法已更新,内边距设为0,tooltip框内边距extraCssText来控制(单位需要用vh或vw,如果用px则不会自适应,会造成分辨率切换时内边距太小的问题),以便实现屏幕分辨率改变时,框的内边距自适应屏幕)
extraCssText属性可以研究一下,可以自定义css,获取对一些特殊弹框有妙用
// 封装弹框
var tooltipCustom = function (nameNum) {
    var clientW = $('body').width() || document.documentElement.clientWidth || document.body.clientWidth;
    var scale = clientW / 1920;
    var tooltip = {
        textStyle: {
            color: "#ffffff", //字体颜色
            fontSize: 14 * scale //字体大小
        },
        padding: [0, 0], //内边距
        borderColor: "rgba(0,0,0,0.7)",//边框颜色
        backgroundColor: 'rgba(0,0,0,0.7)', // 背景
        //额外附加到浮层的 css 样式。如下为浮层添加阴影的示例:
        extraCssText: 'padding:1vh 1.5vh;box-shadow: 0 0 3px rgba(255, 255, 255, 0.4);', //添加阴影
        formatter: function (params) {
            var relVal = "";
            var marker = "";
            var res = "";
            if (params.length) {
                if (nameNum == 1) {
                    for (let i = 0; i < params.length; i++) {
                        if (typeof params[i].color == 'string' && params[i].color.substr(0, 1) == "#") {
                            marker = `<span style="display: inline-block;margin-right: 1vh;border-radius: 10px;width: 1vh;height: 1vh;background-color: ` + params[i].color + `;"></span>`
                        } else {
                            marker = `<span style="display: inline-block;margin-right: 1vh;border-radius: 10px;width: 1vh;height: 1vh;background-color: rgba(36,207,233,0.9);"></span>`
                        }
                        res += marker + params[i].seriesName + ":" + Math.abs(params[i].value) + "<br/>"
                    }
                    relVal = params[0].name + "<br/>" + res
                } else if (nameNum == 2) {
                    for (let i = 0; i < params.length; i++) {
                        if (typeof params[i].color == 'string' && params[i].color.substr(0, 1) == "#") {
                            marker = `<span style="display: inline-block;margin-right: 1vh;border-radius: 10px;width: 1vh;height: 1vh;background-color: ` + params[i].color + `;"></span>`
                        } else {
                            marker = `<span style="display: inline-block;margin-right: 1vh;border-radius: 10px;width: 1vh;height: 1vh;background-color: rgba(36,207,233,0.9);"></span>`
                        }
                        res += params[i].name + "<br/>" + marker + params[i].seriesName + ":" + Math.abs(params[i].value) + "<br/>"
                    }
                    relVal = res
                }

            } else {
                if (typeof params.color == 'string' && params.color.substr(0, 1) == "#") {
                    marker = `<span style="display: inline-block;margin-right: 1vh;border-radius: 10px;width: 1vh;height: 1vh;background-color: ` + params.color + `;"></span>`
                } else {
                    marker = `<span style="display: inline-block;margin-right: 1vh;border-radius: 10px;width: 1vh;height: 1vh;background-color: rgba(36,207,233,0.9);"></span>`
                }
                relVal = params.seriesName + "<br/>" + marker + params.name + ": " + params.value;
            }
            return relVal;
        }
    }
    return tooltip
}
1.只有一个name时

$.get("",function(res){
	var xData = [], yData = [];
    var myChart = new om1e1Echarts('om1e1Echarts');
    myChart.init(xData, yData)
})
       function om1e1Echarts(id) {
            this.chart = echarts.init(document.getElementById(id));
            this.init = function (xData, yData) {
                var option = {
                    grid: {
                        top: 10 * scale,
                        bottom: 20 * scale,
                        left: 10 * scale,
                        right: 10 * scale
                    },
                    animation: true,
                    animationDuration: 3000,
                    animationEasing: 'quadraticOut',
                    tooltip: {
                        show: "true",
                        trigger: 'axis',
                        confine: "true",
                        axisPointer: {
                            type: 'shadow', //默认为line,line直线,cross十字准星,shadow阴影
                            label: {
                                // backgroundColor: '#283b56'
                            }
                        },
                        ...tooltipCustom(1) //当只有1个name时参数填1(另一种说法就是1个x轴)
                        //注释部分是不封装的写法
                        // textStyle: {
                        //     color: "#ffffff",
                        //     fontSize: 10 * scale
                        // },
                        // backgroundColor: 'rgba(0,0,0,0.7)', // 背景
                        // borderColor: "rgba(0,0,0,0.7)",//边框颜色
                        // padding: [10, 15], //内边距
                        // extraCssText: 'box-shadow: 0 0 3px rgba(255, 255, 255, 0.4);', //添加阴影
                        // formatter: function (params) {
                        //     // var relVal = '';
                        //     // var res = '';
                        //     // for (var i = 0, l = params.length; i < l; i++) {
                        //     //     res += '<div style="font-size: 1.5vh;"><span style="display: inline-block;margin-right: 1vh;border-radius: 10px;width: 1vh;height: 1vh;background-color: ' + params[i].color + ';"></span>' + params[i].seriesName + ': ' + Math.abs(params[i].value) + '</div>';
                        //     // }
                        //     // relVal = '<div style="font-size: 1.5vh;display: flex;flex-direction: column;justify-content: space-evenly;">' +
                        //     //     '<div style="margin-bottom:.5vh;">' + params[0].name + '</div>' + res +
                        //     //     '</div>'
                        //     var marker = `<span style="display: inline-block;margin-right: 1vh;border-radius: 10px;width: 1vh;height: 1vh;background-color: ` + params[0].color + `;"></span>`
                        //     var relVal = params[0].seriesName + "<br/>" + marker + params[0].name + ": " + params[0].value;
                        //     return relVal;
                        // }
                    },
                    xAxis: [{
                        name: '',
                        type: 'category',
                        boundaryGap: true,
                        data: xData,
                        // 轴线
                        axisLine: {
                            show: true,
                            lineStyle: {
                                color: '#608CB3',
                            }
                        },
                        // 轴刻度
                        axisTick: {
                            show: false,
                        },
                        // 轴标签
                        axisLabel: {
                            show: true,
                            textStyle: {
                                color: '#ffffff',
                                fontSize: 8 * scale,
                            }
                        },
                        // 区域中的分隔线
                        splitLine: {
                            show: false,
                        },
                        // 网格区域
                        splitArea: {
                            show: false,
                        }
                    }],
                    yAxis: [{
                        show: false,
                        type: 'value',
                        scale: true,
                        name: '',
                        min: 0,
                        boundaryGap: [0.2, 0.2],
                        // 轴刻度
                        axisTick: {
                            show: false,
                        },
                        splitLine: {
                            show: false
                        },
                        nameTextStyle: {
                            color: '#f1f1f1'
                        },
                        axisLabel: {
                            show: true,
                            textStyle: {
                                color: '#6D6D6D',
                                fontSize: 8 * scale
                            }
                        },
                    }],
                    series: [{
                        name: '信息资源',
                        type: 'bar',
                        data: yData,
                        showBackground: true,
                        backgroundStyle: {
                            color: "rgba(67, 91, 177, .5)"
                        },
                        color: "#2c9cfe",
                        barWidth: '25%',
                        label: {
                            show: false,
                            position: 'top',
                            fontSize: 10 * scale
                        },
                    }]
                }
                this.chart.clear();
                if (this.chart.getOption()) {
                    this.chart.dispose()
                    this.chart = echarts.init(document.getElementById(id));
                }
                this.chart.setOption(option);
                tools.loopShowTooltip(this.chart, option, { loopSeries: true });
            }
            this.resize = function () {
                this.chart.resize();
            }
        }
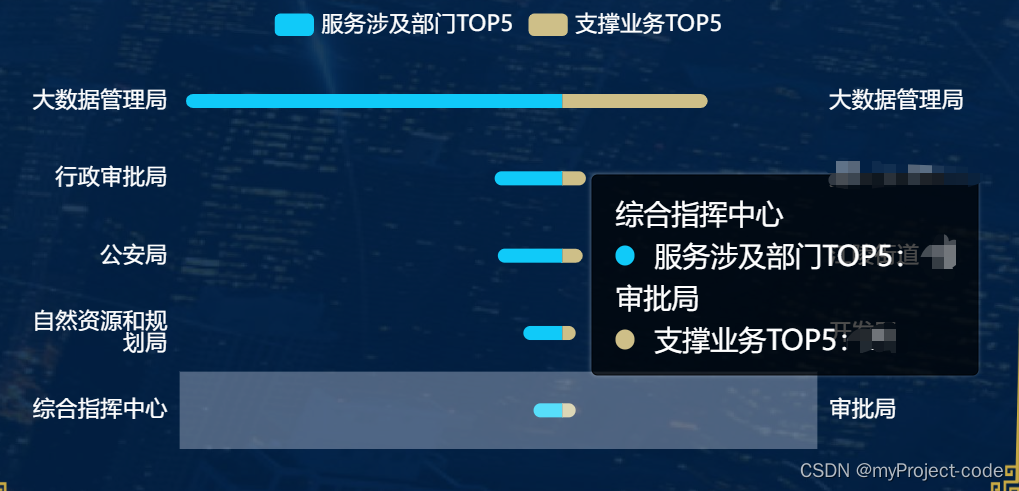
2.两个name时
$.get("",function(res){
var ageArea = [], ageArea2 = [], MbarData = [], FbarData = []
var myChart = new tm3e1Echarts('tm3e1Echarts');
myChart.init(ageArea.reverse(), ageArea2.reverse(), FbarData.reverse(), MbarData.reverse());
})
function tm3e1Echarts(id) {
this.chart = echarts.init(document.getElementById(id));
this.init = function (ageArea, ageArea2, FbarData, MbarData) {
var option = {
tooltip: {
show: "true", //是否展示
confine: "true", //限制框在div内
trigger: 'axis', //'item'散点图,饼图 'axis'柱状图,折线图 'none'不触发
axisPointer: {
type: 'shadow',
snap: false, //自动吸附到最近的点上
},
...tooltipCustom(2) //此时为两个name(另一种说法就是两个x轴)参数填2
// textStyle: {
// color: "#ffffff", //字体颜色
// fontSize: 10 * scale //字体大小
// },
// padding: [10, 15], //内边距
// borderColor: "rgba(0,0,0,0.7)",//边框颜色
// backgroundColor: 'rgba(0,0,0,0.7)', // 背景
// extraCssText: 'box-shadow: 0 0 3px rgba(255, 255, 255, 0.4);', //添加阴影
// formatter: function (params) {
// var relVal = "";
// var marker = "";
// var res = "";
// for (let i = 0; i < params.length; i++) {
// marker = `<span style="display: inline-block;margin-right: 1vh;border-radius: 10px;width: 1vh;height: 1vh;background-color: ` + params[i].color + `;"></span>`
// res += params[i].name + "<br/>" + marker + params[i].seriesName + ":" + Math.abs(params[i].value) + "<br/>"
// }
// relVal = res
// return relVal;
// }
},
legend: {
data: ['服务涉及部门TOP5', '支撑业务TOP5'],
top: 10 * scale,
x: "center",
itemHeight: 8 * scale,
itemWidth: 14 * scale,
textStyle: {
color: "#ffffff",
fontSize: 8 * scale,
}
},
animation: true,
animationDuration: 3000,
animationEasing: 'quadraticOut',
grid: {
top: 30 * scale,
bottom: 0 * scale,
left: 60 * scale,
right: 60 * scale
},
xAxis: [{
type: 'value',
boundaryGap: false,
scale: true,
splitLine: {
show: false
},
axisLine: { //坐标轴轴线设置
show: false,
},
axisTick: { //坐标轴刻度设置
show: false
},
axisLabel: {
show: false,
textStyle: {
color: '#ffffff',
fontSize: 8 * scale,
},
formatter: function (value) {
return Math.abs(value); //显示的数值都取绝对值
}
},
}],
yAxis: [{
// name: '年龄段',
type: 'category',
boundaryGap: true,
data: ageArea,
splitLine: {
show: false
},
axisLine: { //坐标轴轴线设置
show: false,
lineStyle: {
color: "#1153A9"
}
},
axisTick: { //坐标轴刻度设置
show: false
},
axisLabel: {
show: true,
interval: 0,
formatter: function (params) {
var newParamsName = ""; // 最终拼接成的字符串
var paramsNameNumber = params.length; // 实际标签的个数
var provideNumber = 6; // 每行能显示的字的个数
var rowNumber = Math.ceil(paramsNameNumber / provideNumber); // 换行的话,需要显示几行,向上取整
/**
* 判断标签的个数是否大于规定的个数, 如果大于,则进行换行处理 如果不大于,即等于或小于,就返回原标签
*/
// 条件等同于rowNumber>1
if (paramsNameNumber > provideNumber) {
/** 循环每一行,p表示行 */
for (var p = 0; p < rowNumber; p++) {
var tempStr = ""; // 表示每一次截取的字符串
var start = p * provideNumber; // 开始截取的位置
var end = start + provideNumber; // 结束截取的位置
// 此处特殊处理最后一行的索引值
if (p == rowNumber - 1) {
// 最后一次不换行
tempStr = params.substring(start, paramsNameNumber);
} else {
// 每一次拼接字符串并换行
tempStr = params.substring(start, end) + "\n";
}
newParamsName += tempStr; // 最终拼成的字符串
}
} else {
// 将旧标签的值赋给新标签
newParamsName = params;
}
//将最终的字符串返回
return newParamsName
},
textStyle: {
color: '#ffffff',
fontSize: 8 * scale,
}
}
}, {
// name: '服务调用次数',
type: 'category',
boundaryGap: true,
data: ageArea2,
splitLine: {
show: false
},
axisLine: { //坐标轴轴线设置
show: false,
lineStyle: {
color: "#1153A9"
}
},
axisTick: { //坐标轴刻度设置
show: false
},
axisLabel: {
show: true,
textStyle: {
color: '#ffffff',
fontSize: 8 * scale,
}
}
}],
series: [{
name: '服务涉及部门TOP5',
type: 'bar',
stack: '总量',
barWidth: 5 * scale,
yAxisIndex: 0,
itemStyle: {
normal: {
show: true,
color: '#10CAF9',
barBorderRadius: [30, 0, 0, 30],
}
},
data: FbarData
},
{
name: '支撑业务TOP5',
type: 'bar',
stack: '总量',
barWidth: 5 * scale,
yAxisIndex: 1,
itemStyle: {
normal: {
show: true,
color: '#CEBF88',
barBorderRadius: [0, 30, 30, 0],
}
},
data: MbarData
}
]
}
this.chart.clear();
if (this.chart.getOption()) {
this.chart.dispose()
this.chart = echarts.init(document.getElementById(id));
}
this.chart.setOption(option);
tools.loopShowTooltip(this.chart, option, { loopSeries: true });
}
this.resize = function () {
this.chart.resize();
}
}


 3749
3749


 被折叠的 条评论
为什么被折叠?
被折叠的 条评论
为什么被折叠?
 到【灌水乐园】发言


