


一、准备
1、prometheus下载
https://prometheus.io/download/#prometheus
2、上传:
/opt/module/prometheus-2.30.0.linux-amd64.tar.gz
二、安装配置prometheus
1、解压
tar -zxvf prometheus-2.30.0.linux-amd64.tar.gz -C /opt/module/
2、更改目录名
mv prometheus-2.30.0.linux-amd64 prometheus
3、创建启动脚本
touch prometheus-start.sh && chmod +x prometheus-start.sh
vim prometheus-start.sh
#!/bin/bash
/opt/module/prometheus/prometheus --config.file=/opt/module/prometheus/prometheus.yml > /dev/null 2>&1 &
4、创建关闭脚本
touch prometheus-stop.sh && chmod +x prometheus-stop.sh
vim prometheus-stop.sh
#!/bin/bash
ps -ef|grep prometheus | xargs kill `awk 'NR==1 {print $2}'`
5、验证
ps -ef |grep prometheus

浏览器打开IP:9090端口即可打开普罗米修斯自带的监控页面

三、安装Grafana
官网:https://grafana.com/grafana/download?pg=get&plcmt=selfmanaged-box1-cta1
1、安装
wget https://dl.grafana.com/enterprise/release/grafana-enterprise-8.1.4-1.x86_64.rpm
sudo yum install grafana-enterprise-8.1.4-1.x86_64.rpm
配置文件
/etc/grafana/grafana.ini
2、启动
systemctl daemon-reload
systemctl start grafana-server.service
systemctl enable grafana-server.service
3、访问grafana
浏览器访问IP:3000端口,即可打开grafana页面,默认用户名密码都是admin,初次登录会要求修改默认的登录密码

4、添加数据源


四、安装clickhouse相关插件
ClickHouse 从 v20.1.2.4 开始,内置了对接 Prometheus 的功能,可以将其作为 Prometheus 的 Endpoint 服务,从而自动的将 metrics、events 和 asynchronous_metrics 三张系统的表的数据发送给 Prometheus
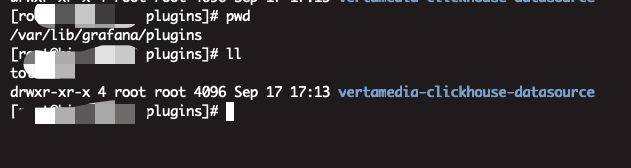
1、安装插件
grafana-cli plugins install vertamedia-clickhouse-datasource
2、修改Clickhouse集群的config.xml,将注释去掉
vim /etc/clickhouse-server/config.xml
<prometheus>
    <endpoint>/metrics</endpoint>
    <port>9363</port>

    <metrics>true</metrics>
    <events>true</events>
    <asynchronous_metrics>true</asynchronous_metrics>
    <status_info>true</status_info>
</prometheus>
vim users.xml
<log_queries>1</log_queries>
3、重启集群
systemctl start clickhouse-server
配置prometheus.yml
global:
  scrape_interval:     15s # Set the scrape interval to every 15 seconds. Default is every 1 minute.
  evaluation_interval: 15s # Evaluate rules every 15 seconds. The default is every 1 minute.

alerting:
  alertmanagers:
  - static_configs:
    - targets:

rule_files:
   - "first_rules.yml"
   - "second_rules.yml"

scrape_configs:
  - job_name: 'clickhouse_9363'

    static_configs:
    - targets: ['10.15.1.23:9363','10.15.1.38:9363','10.15.1.39:9363']
重启prometheus
4、验证
curl http://*****:9363/metrics

5、配置数据源
](https://img-blog.csdnimg.cn/de12201b12314d73984a4a55e3d434f4.png?x-oss-process=image/watermark,type_ZHJvaWRzYW5zZmFsbGJhY2s,shadow_50,text_Q1NETiBAQ2Fyb25feGNi,size_20,color_FFFFFF,t_70,g_se,x_16)
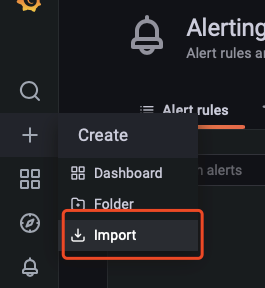
6、导入监控模版
更多模版
https://grafana.com/grafana/dashboards/2515


 1511
1511


 被折叠的 条评论
为什么被折叠?
被折叠的 条评论
为什么被折叠?
 到【灌水乐园】发言


