


一、结果展示
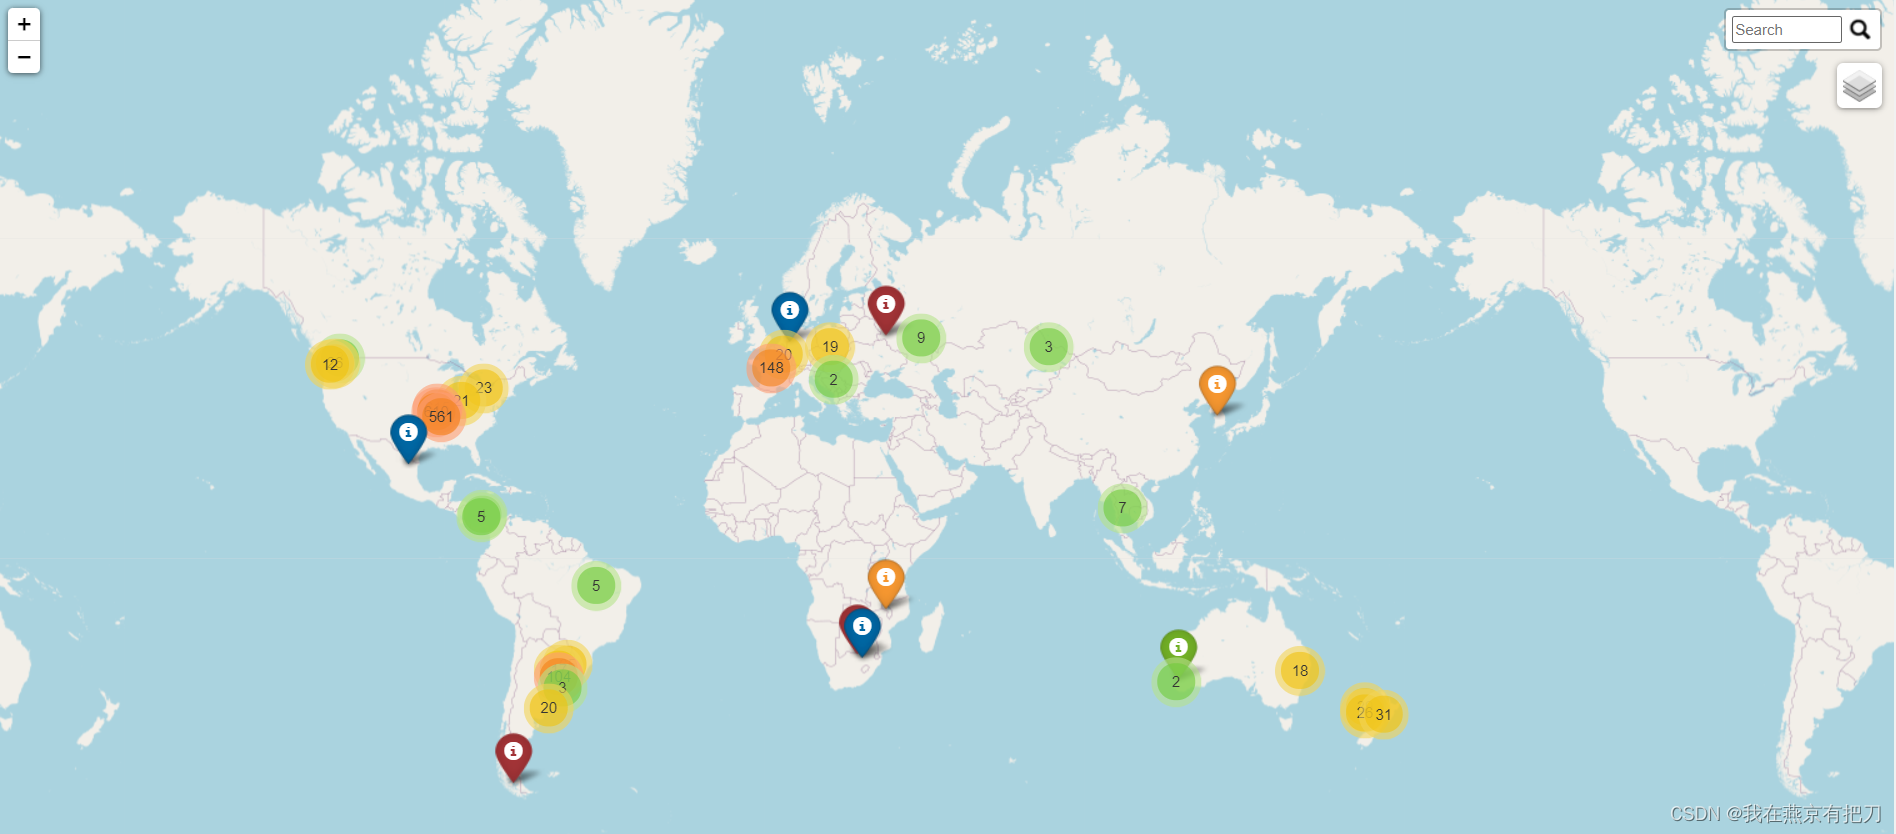
数据汇聚结果会根据地图的放大/缩小,进行离散/聚合。不同种类无法聚合,有需要可以自己添加。
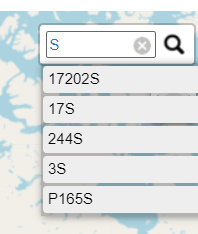
右上角搜索框,可以指定搜索列
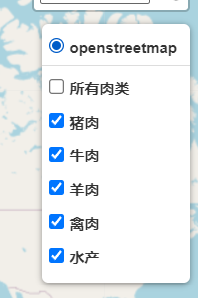
搜索框下面可以指定选择图层。
二、源码
因为涉及公司业务,不做完全展示。
import json
import pandas as pd
import folium
from folium.plugins import MarkerCluster
from folium.plugins import Search

# 先读取excel文件数据,创建df
df4 = pd.read_excel('I:\Codes\\02-Python\Work_Unit\A02_Factory\data\some_data.xlsx')
print(df4.columns)
data = df4

pork = ['猪']
# 筛选需要的数据
pork_df = data[data['大类'].isin(pork)]

# 创建一个空的Map对象
m = folium.Map(location=[31.23, 121.47], zoom_start=3)
# add html title
loc = '在华注册工厂号地图'
title_html = '''
             <h4 align="center" style="font-size:16px"><b>{}</b></h4>
             '''.format(loc)
# 创建一个Marker_cluster对象,这个是图上用来聚合的
marker_cluster = MarkerCluster().add_to(m)

# 筛选用到的列
useful_cols = ['Number', '企业名称Name of Plant', '大类', 'Latitude', 'Longitude']
df_geo = data[useful_cols]

# 数据格式转换
def df_to_geojson(df_json, properties, lat='Latitude', lng='Longitude'):
    geojson = {'type': 'FeatureCollection', 'features': []}

    # 遍历dataframe的每一行,并转换为json格式
    for _, row in df_json.iterrows():
        # create a feature template to fill in
        feature = {'type': 'Feature',
                   'properties': {},
                   'geometry': {'type': 'Point', 'coordinates': []}}

        # 填写坐标
        feature['geometry']['coordinates'] = [row[lng], row[lat]]

        # for each column, get the value and add it as a new feature property
        for prop in properties:
            feature['properties'][prop] = row[prop]

        # add this feature (aka, converted dataframe row) to the list of features inside our dict
        geojson['features'].append(feature)

    return geojson


geojson_dict = df_to_geojson(df_geo, properties=useful_cols)
geojson_str = json.dumps(geojson_dict, indent=2)

m = folium.Map(location=[31.23, 121.47], zoom_start=3, control_scale=True)

loc = '在华注册工厂信息互动地图'
title_html = '''
             <h3 align="center" style="font-size:16px"><b>{}</b></h3>
             '''.format(loc)

pork_layer = folium.FeatureGroup(name="猪肉")
pork_cluster = MarkerCluster().add_to(pork_layer)


# add marker one by one on the map
# 遍历大类df,将数据导入到一个 FeatureGroupSubGroup 中
# add pork
for i in range(0, len(pork_df)):
    html = f"""
        <h3>工厂:{pork_df.iloc[i]['Number']}</h3>
        <b>大类:</b>{pork_df.iloc[i]['大类']}<br><br>
        <b>企业名称:</b>{pork_df.iloc[i]['企业名称Name of Plant']}<br><br>
        <b>企业地址:</b>{pork_df.iloc[i]['企业地址Address of Plant']}<br><br>
            """

    iframe = folium.IFrame(html=html, width=500, height=200)
    popup = folium.Popup(iframe, max_width=2650, min_width=500)
    folium.Marker(
        location=[pork_df.iloc[i]['Latitude'], pork_df.iloc[i]['Longitude']],
        popup=popup,
        icon=folium.Icon(color="darkpurple")
    ).add_to(pork_cluster)


geojson_obj = folium.GeoJson(geojson_dict, name='所有肉类', show=False,
                             tooltip=folium.GeoJsonTooltip(
                                 fields=['Number', '企业名称Name of Plant', '大类'],
                                 aliases=['工厂', '企业名称', '大类'],
                                 localize=True)
                             ).add_to(m)

# 设定搜索框
factorysearch = Search(layer=geojson_obj,
                       geom_type='Point',
                       placeholder="Search",
                       collapsed=False,
                       search_label='Number',
                       search_zoom=6,
                       position='topright'
                       ).add_to(m)

m.add_child(pork_layer)
m.add_child(folium.map.LayerControl())

m.get_root().html.add_child(folium.Element(title_html))
m.save("test.html")


 935
935

 被折叠的 条评论
为什么被折叠?
被折叠的 条评论
为什么被折叠?
 到【灌水乐园】发言


