


目录
3.title() 标题 & xlabel & ylabel & zlabel 坐标轴信息
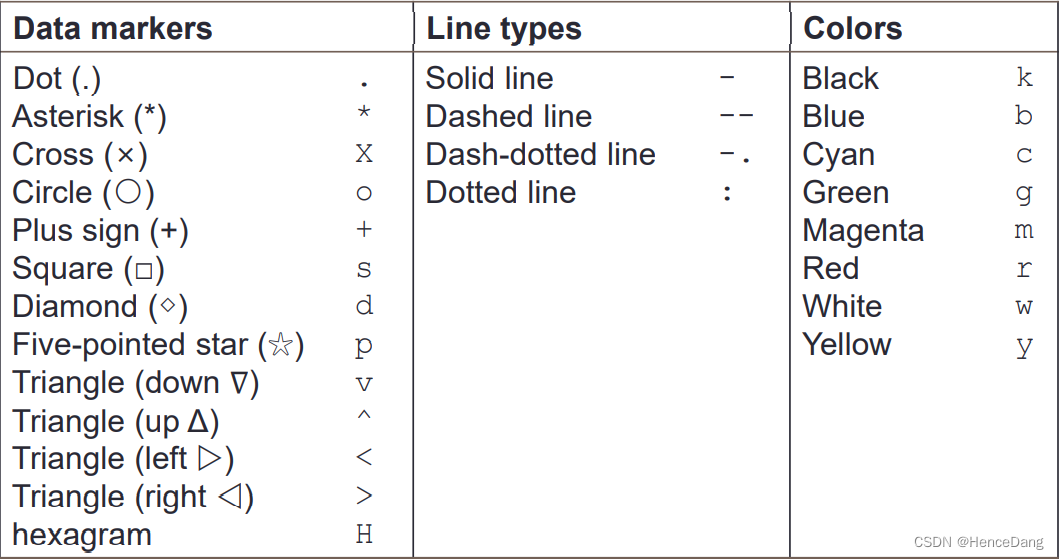
6.标记器规格---Marker Specification
10.Control of Grid, Box, and Axis
1.plot()
示例:
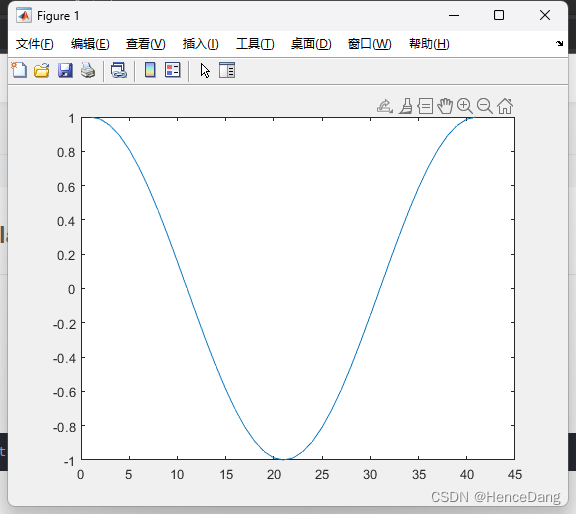
>> plot(cos(0:pi/20:2*pi));
结果:
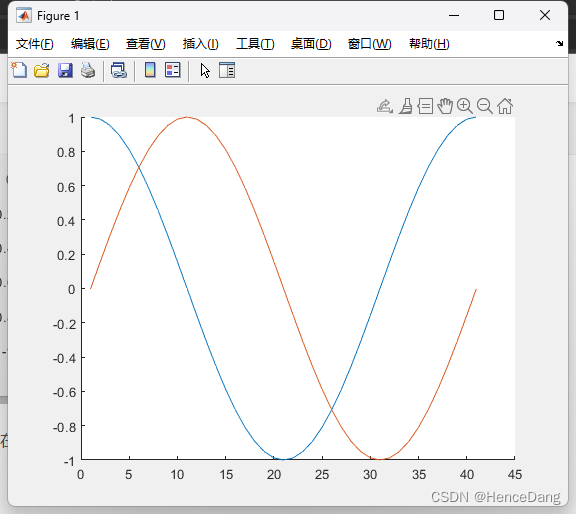
如果想要在一个figure上画多个图,需要使用hold on & hold off
示例:
>> hold on
>> plot(cos(0:pi/20:2*pi));
>> plot(sin(0:pi/20:2*pi));
>> hold off
结果:
2.legend()在坐标区上添加图例
示例:
x=0:0.5:4*pi;
y=sin(x);
h=cos(x);
w=1./(1+exp(-x));
g=(1/(2*pi*2)^0.5).*exp((-1.*(x-2*pi).^2)./(2*2^2));
plot(x, y, 'bd-', x, h, 'gp:', x, w, 'ro-', x, g, 'c^-'); % gp-:g是颜色green p是数据标记(坐标轴上的点) - 是线条样式 这三个位置可以互换同时可多可少,后面同理,下面会赘述常用的这些标识
legend('sin(x)', 'cos(x)', 'Sigmoid', 'Gauss function'); % 四个参数
结果:

样式风格--Plot Style:
3.title() 标题 & xlabel & ylabel & zlabel 坐标轴信息
示例:
% .m文件
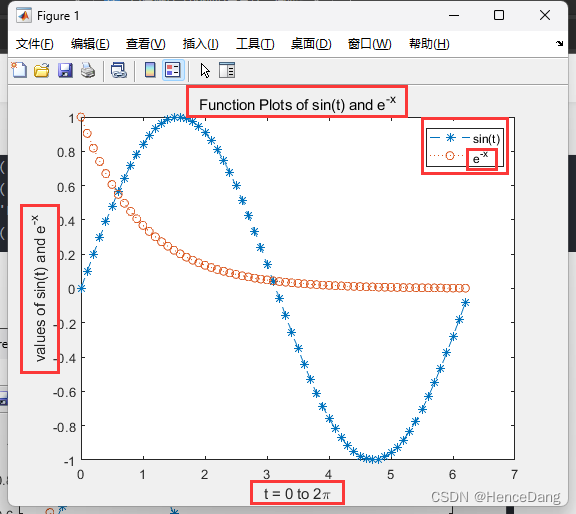
x = 0:0.1:2*pi;
y1 = sin(x);
y2 = exp(-x);
plot(x, y1, '--*', x, y2, ':o'); % 也可以分开画,但是要加hold on/off
xlabel('t = 0 to 2\pi'); % 显示π的话要加个\转义字符
ylabel('values of sin(t) and e^{-x}') % 直接看图e^{-x}就是这种写法记住就行
title('Function Plots of sin(t) and e^{-x}');
legend('sin(t)','e^{-x}');结果:
4.text() &annotation()
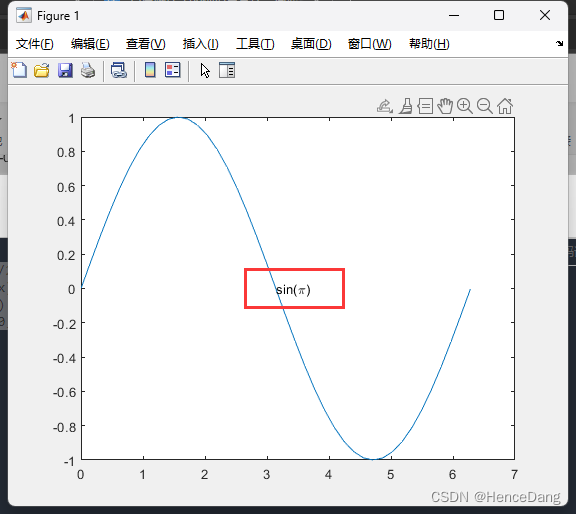
4.1text()
text(x,y,txt)使用由txt指定的文本,向当前坐标区中的一个或多个数据点添加文本描述。若要将文本添加到一个点,请将x和y指定为标量。若要将文本添加到多个点,请将x和y指定为长度相同的向量。
添加一个点:
示例:
x = 0:pi/20:2*pi;
y = sin(x);
plot(x,y)
text(pi,0,'sin(\pi)')
结果:
添加多个点:
示例:
x = linspace(-5,5);
y = x.^3-12*x;
plot(x,y)

xt = [-2 2];
yt = [16 -16]; % 两个坐标(-2, 16) & (2, 16)
str = 'dy/dx = 0';
text(xt, yt, str)
结果: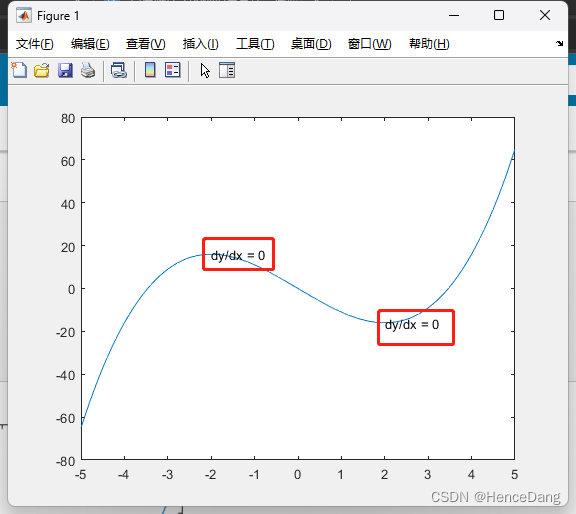
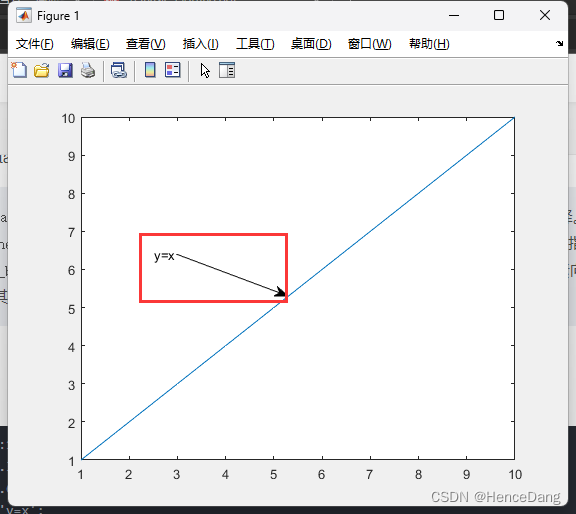
4.2 annotation()
annotation(lineType,x,y)创建一个在当前图窗中的两个点之间延伸的线条或箭头注释。将lineType指定为'line'、'arrow'、'doublearrow'或'textarrow'。将x和y分别指定为[x_begin x_end]和[y_begin y_end]形式的二元素向量。这里需要解释一下二元素向量,其实就是你把这个图看成是一个1×1的坐标轴,左下角是(0, 0) 右上角是(1, 1)
示例:
plot(1:10)
x = [0.3 0.5];
y = [0.6 0.5];
str = 'y=x';
annotation('textarrow',x,y, 'String', str)
结果:
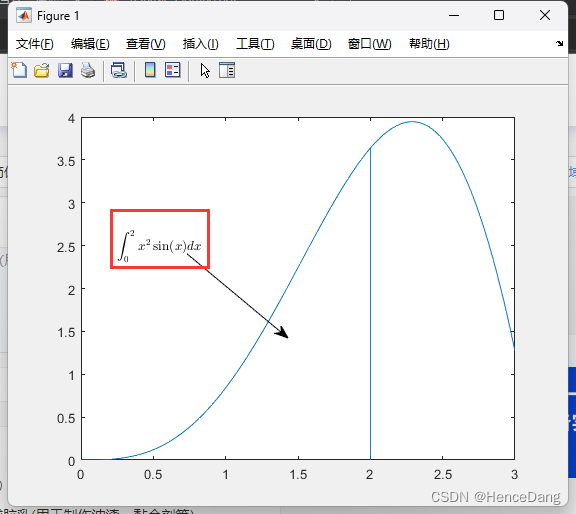
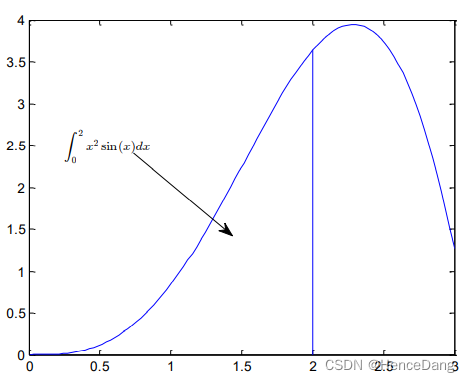
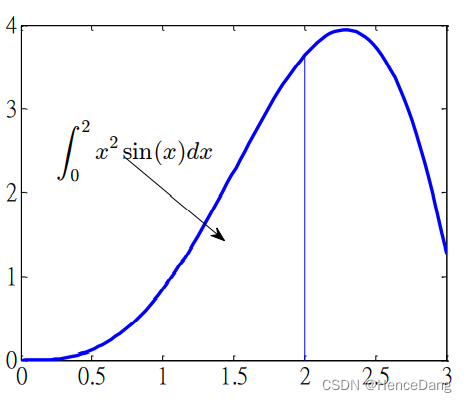
基于上述的综合示例:
x = linspace(0,3);
y = x.^2.*sin(x);
plot(x,y);
line([2,2],[0,2^2*sin(2)]); % 图中的哪条竖线从(2, 0)延伸到(2, 2^2*sin(2))
str = '$$ \int_{0}^{2} x^2\sin(x)dx $$'; % 积分 \int(积分符号) _{0}(积分下线) ^{2}(积分上限)固定写法
text(0.25,2.5,str,'Interpreter','latex'); % 积分的显示位置(0.25, 2.5)'Interpreter','latex'可以理解为固定格式,latex的其中一个写法加$$ $$
x = [0.32,0.5];
y = [0.6,0.4]; % 从(0.32, 0.6)到(0.5, 0.4)
%annotation('arrow','x',[0.32,0.5],'y',[0.6,0.4]); % 也可以这种写法进行箭头指示
annotation('arrow',x, y);
结果:
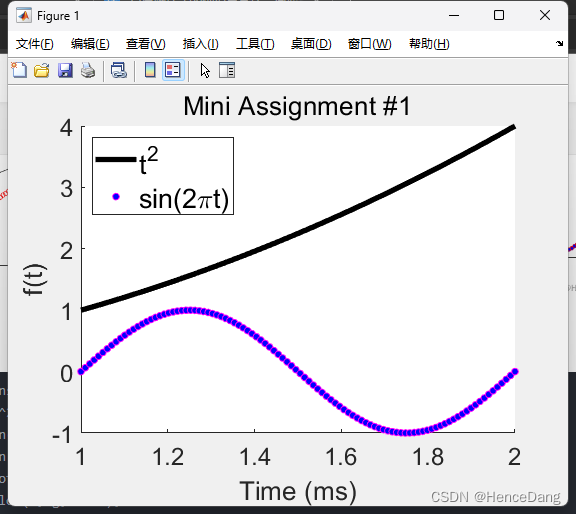
练习:
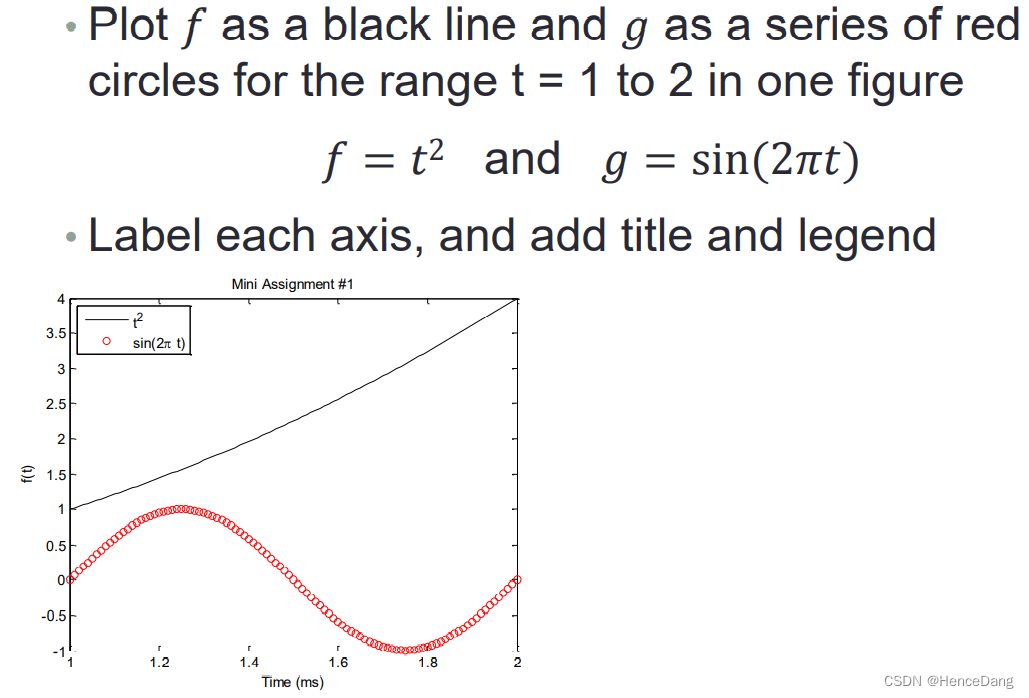
示例(仅供参考):
t = linspace(1, 2);
f = t.^2; % 注意是点乘
g = sin(2*pi.*t); % 注意是点乘
hold on
plot(t, f, 'k', t, g, 'ro');
title('Mini Assignment #1');
xlabel('Time (ms)');
ylabel('f(t)');
%legend('t^2', 'sin(2\pit)', 'Location','northwest', 'Orientation','vertical'); % 写法1:Orientation方向 vertical-垂直 horizontal-水平
legend({'t^2', 'sin(2\pit)'}, 'Location','northwest', 'NumColumns',1);% Location指定位置,关于位置可以自行官网查找; NumColumns表示几列,1的话就是垂直的2的话就是水平的
hold off
结果: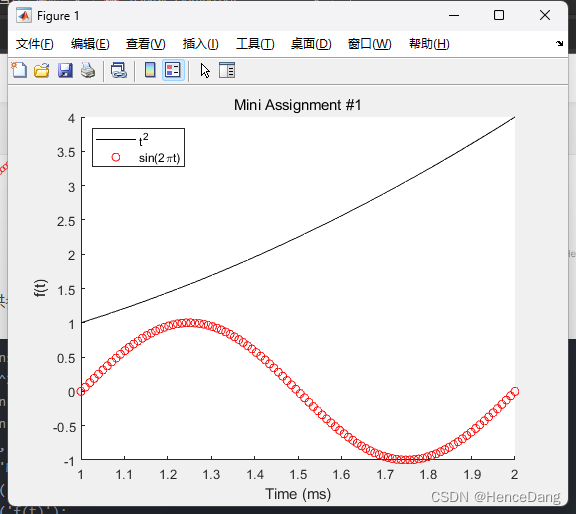
5.修改figure
比如怎么修改线、坐标轴等的样式?
介绍:figure默认gcf, Axes默认是gca 我们画的图可以自己定义。相关参数的修改也可以用编辑-->图窗属性修改。
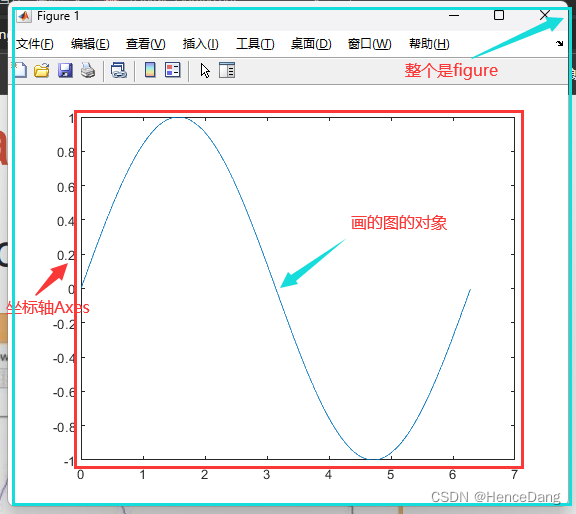

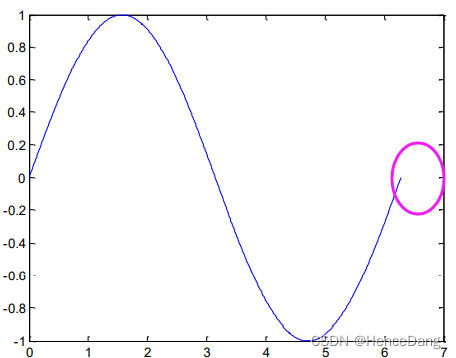
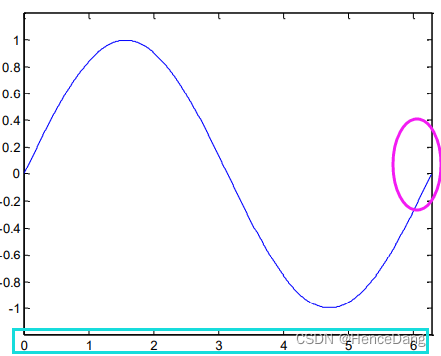
问题:如何加你个紫色的空白修改成右边这样也就是改变x坐标轴的大小
5.1get() & set()
用get获取对应句柄的参数信息:get(gca) get(gcf) get(plot的对象)
示例:
x = linspace(0, 2*pi, 1000);
y = sin(x);
plot(x,y);
h = plot(x, y);
%get(h);
%get(gca);
%get(gcf);
xlim([0, 2*pi]); % 修改x轴的范围到2pi
ylim([-1.2, 1.2]);
结果:

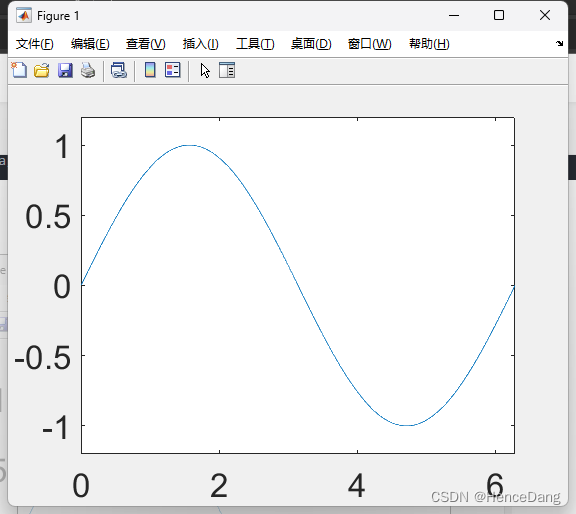
在上述的代码中加入
set(gca, 'FontSize', 25); % 改变坐标轴的大小结果:
继续添加:
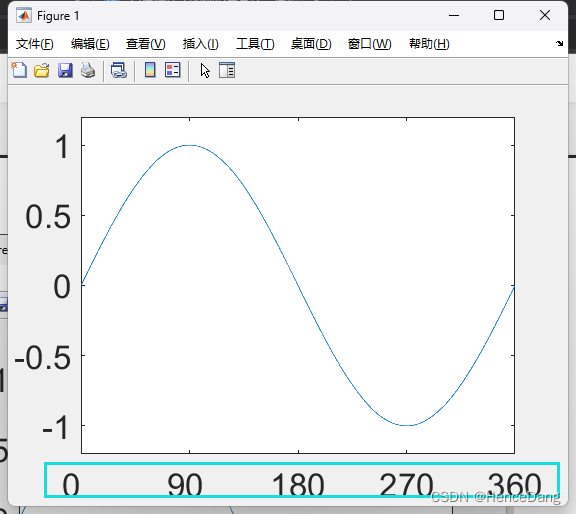
set(gca, 'XTick', 0:pi/2:2*pi); % 0到2pi步长为pi/2
set(gca, 'XTickLabel', 0:90:360); % 上述以90度的形式
结果:
继续添加:
%17版本之后不支持symble
%set(gca, 'FontName', 'symbol');
%set(gca, 'XTickLabel', {'0', 'p/2', 'p', '3p/2', '2p'});
%换个方式写
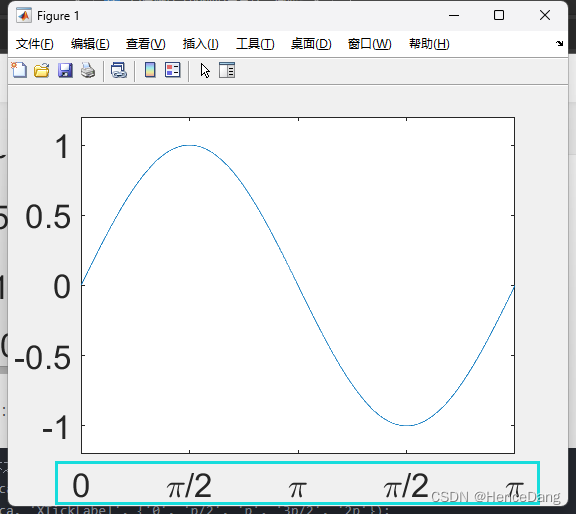
set(gca, 'FontName', 'tex'); % tex换成str也可以
set(gca, 'XTickLabel', {'0', '\pi/2', '\pi', '\pi/2', '\pi'}); % 别忘了 转义字符直接看图结果:
继续添加:
set(h, 'LineStyle', '-.', 'LineWidth', 3.0, 'Color', 'g'); % 修改线的样式
%delete(h) % 线消失可自行尝试
结果:

6.标记器规格---Marker Specification
示例:
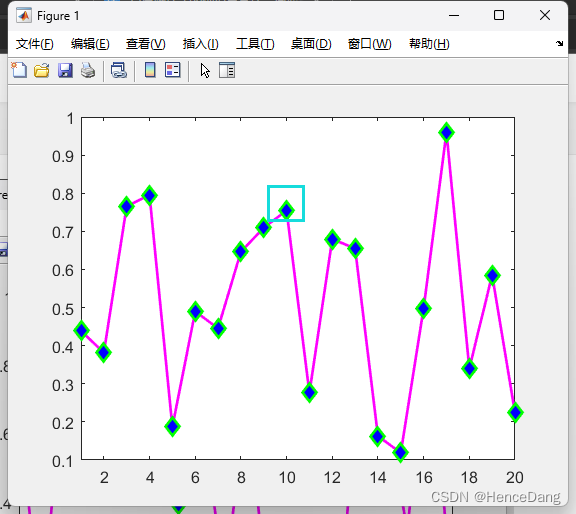
x=rand(20,1);
plot(x,'-md','LineWidth', 2, 'MarkerEdgeColor', 'g', 'MarkerFaceColor', 'b', 'MarkerSize', 10); % 边缘是绿色里面的是蓝色 直接看图 包括大小随便调试
set(gca, 'FontSize', 12);
xlim([1, 20]);
结果:
练习:
示例:
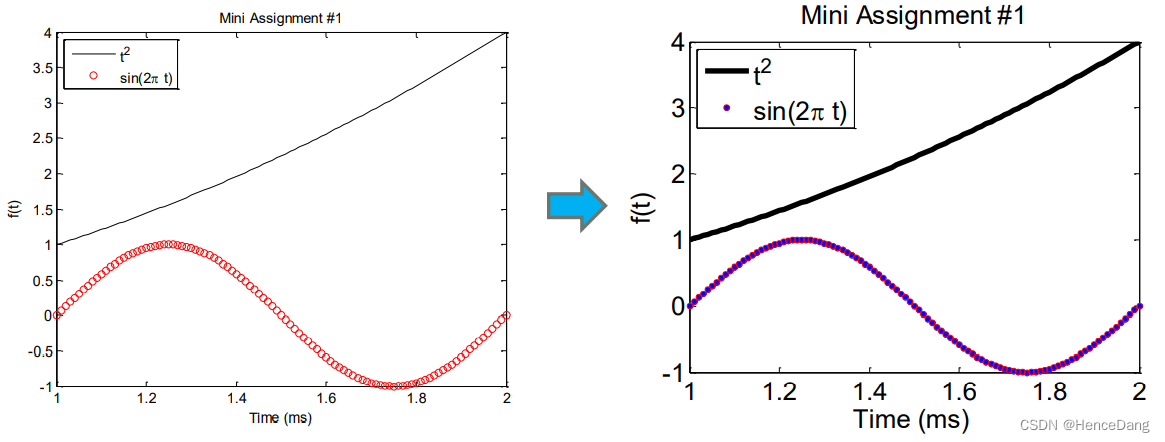
t = linspace(1, 2);
f = t.^2;
g = sin(2*pi.*t);
hold on
h = plot(t, f, 'k'); % 这里图中的两条线需要分别设置对象 所以需要hold on/off
h1 = plot(t, g, 'ro');
title('Mini Assignment #1');
xlabel('Time (ms)');
ylabel('f(t)');
%legend('t^2', 'sin(2\pit)', 'Location','northwest', 'Orientation','vertical'); %方向,垂直,水平
legend({'t^2', 'sin(2\pit)'}, 'Location', 'northwest', 'NumColumns', 1, 'FontSize', 20);%1列 线的粗细20
hold off
set(gca, "FontSize", 18); % 坐标轴变大包括xlabel和ylabel和title
set(h, 'LineWidth', 4); % 线变粗
set(h1, 'MarkerEdgeColor', 'm', 'MarkerFaceColor','b', 'MarkerSize', 5);
结果:
7.多个figure--Multiple Figures
示例:
就是用figure可以一直画。注意和hold on/off的区别。前者是每张图都是一个figure,后者是在一个figure中画多张图
x = -10:0.1:10;
y1 = x.^2 - 8;
y2 = exp(x);
y3 = sin(x);
figure, plot(x,y1);
figure, plot(x,y2);
figure, plot(x,y3);
结果:

注意如果在修改的时候修改的是最近的一个此示例中如果修改的话会修改figure3
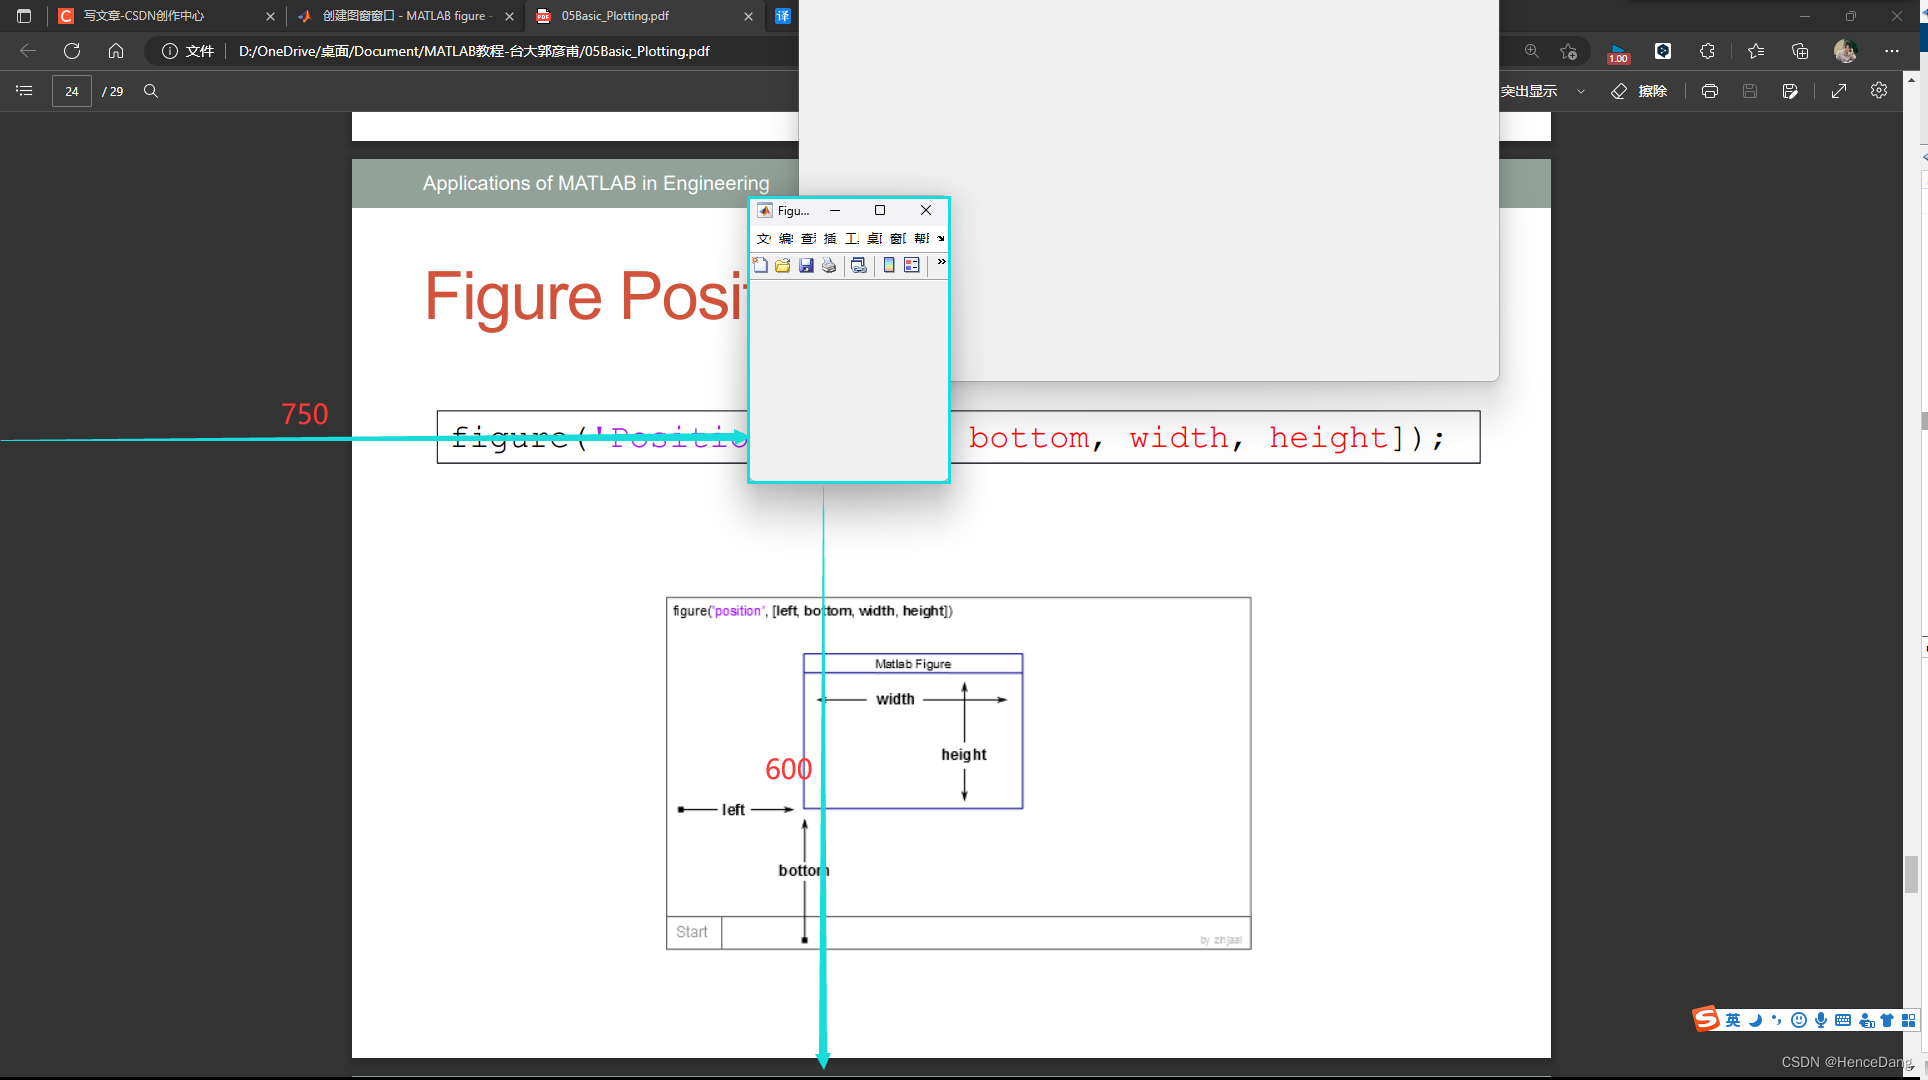
8.figure
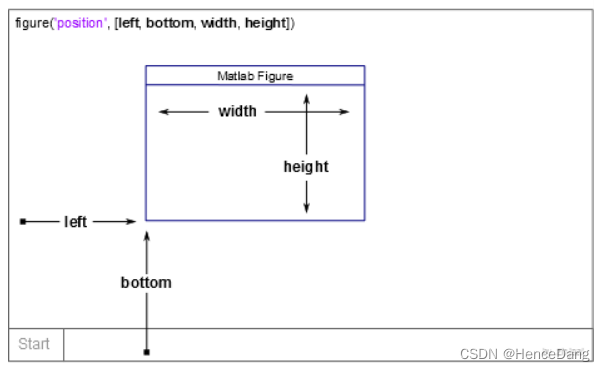
示例:
>> figure('Position', [750, 600, 200, 200]) % 相对于显示屏的左下角
结果:
9.subplot在一个figure中绘制多个相对独立的图

示例:
t = 0:0.1:2*pi; x = 3*cos(t);
y = sin(t);
subplot(2, 2, 1); plot(x, y); axis normal
subplot(2, 2, 2); plot(x, y); axis square
subplot(2, 2, 3); plot(x, y); axis equal
subplot(2, 2, 4); plot(x, y); axis equal tight| normal | 默认 |
| square | 使用相同长度的坐标轴线。相应调整数据单位之间的增量。 |
| equal | 沿每个坐标轴使用相同的数据单位长度。 |
| tight | 将坐标轴范围设置为等同于数据范围,使轴框紧密围绕数据。 |
结果:

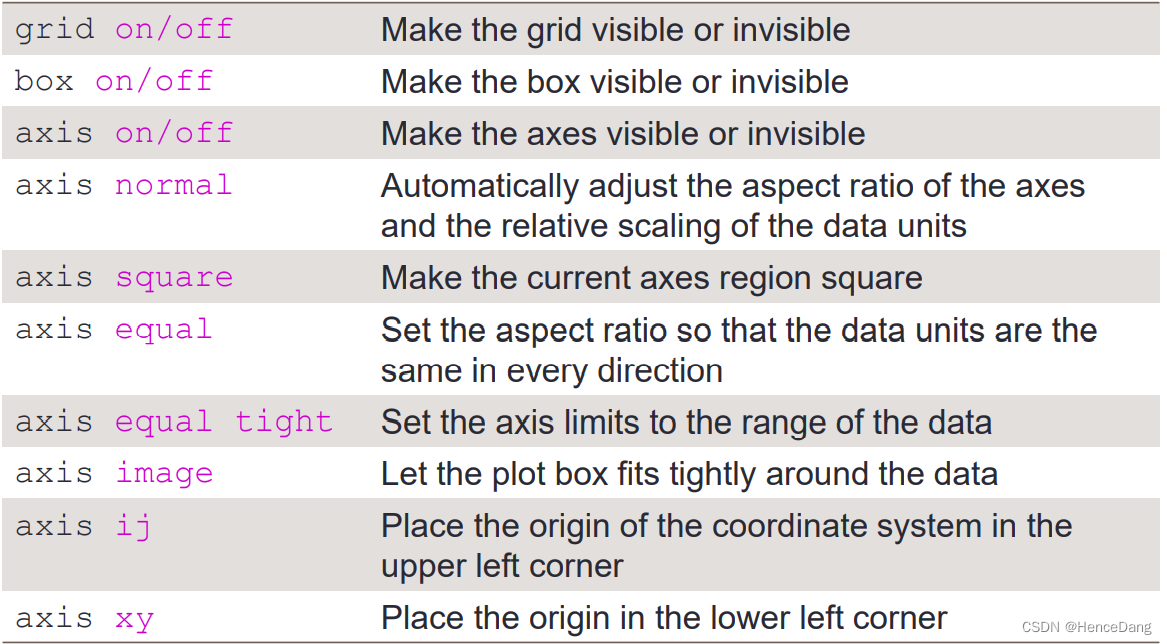
10.Control of Grid, Box, and Axis
11.Saving Figures into Files
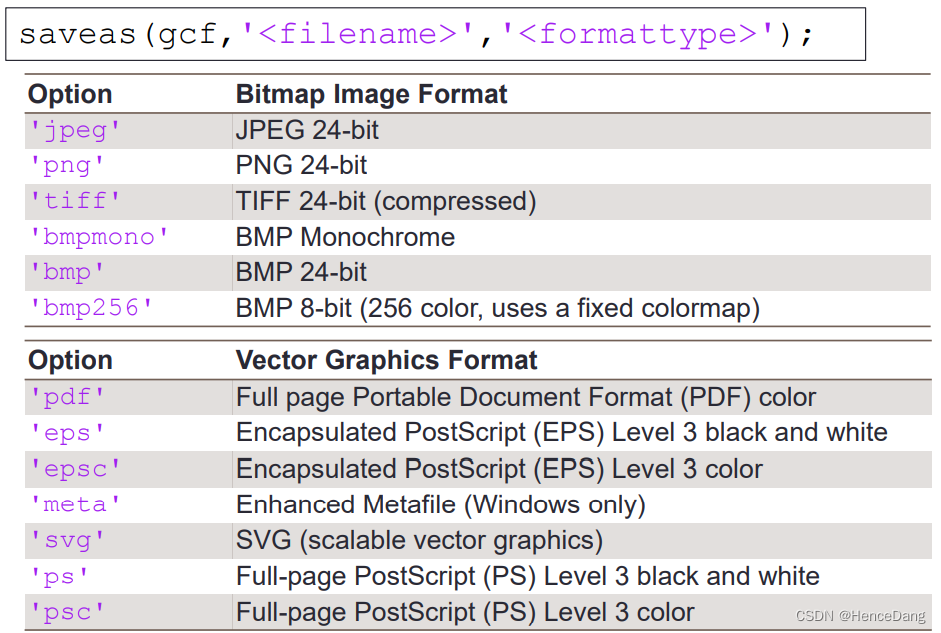
示例:
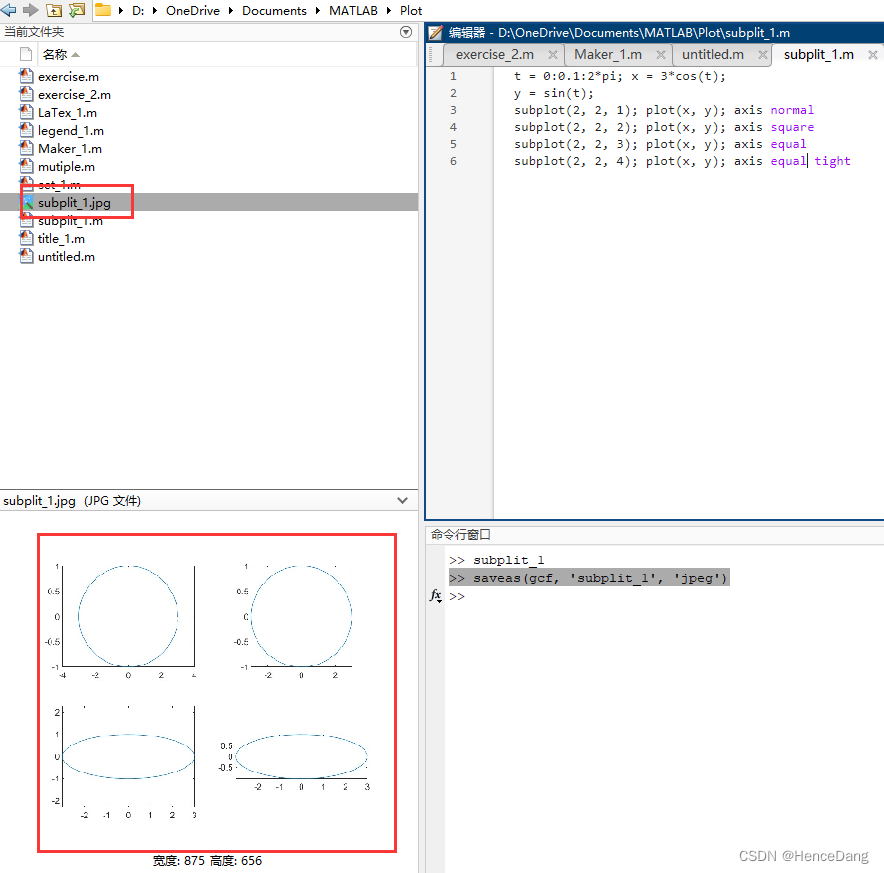
将第9节subplot的图片保存为jpeg
>> saveas(gcf, 'subplit_1', 'jpeg')结果在工作目录中可以可看到:
总结:
用到什么直接官网查。
OVER


 被折叠的 条评论
为什么被折叠?
被折叠的 条评论
为什么被折叠?
 到【灌水乐园】发言


