


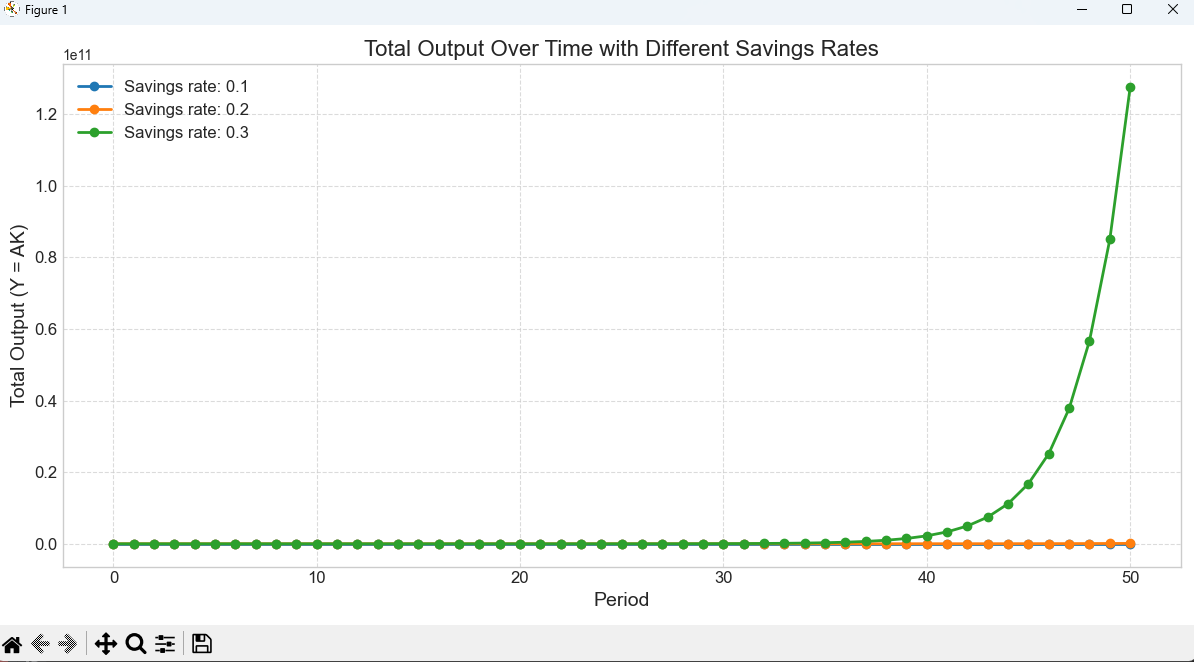
经济增长模型模拟:构建一个简单的内生增长模型,假设生产函数为 Y = AK(Y 为总产出,A 为技术水平,K 为资本存量),资本积累方程为 ΔK = sY - δK(s 为储蓄率,δ 为资本折旧率)。设定初始资本 K0 = 100,技术水平 A = 2,储蓄率 s = 0.2,折旧率 δ = 0.1。模拟 50 个时期的经济增长情况,分析不同储蓄率(如 s = 0.1, 0.3)对经济增长的影响,绘制总产出随时间的变化曲线。
import numpy as np
import matplotlib.pyplot as plt
import matplotlib.font_manager as fm


def economic_growth_simulation(A, delta, K0, s, periods):
    """
    Simulate the endogenous growth model

    Parameters:
    A: Technology level
    delta: Capital depreciation rate
    K0: Initial capital stock
    s: Savings rate
    periods: Number of simulation periods

    Returns:
    Capital stock and total output for each period
    """
    K = np.zeros(periods + 1)
    Y = np.zeros(periods + 1)

    K[0] = K0

    for t in range(periods):
        Y[t] = A * K[t]
        dK = s * Y[t] - delta * K[t]
        K[t + 1] = K[t] + dK

    Y[-1] = A * K[-1]  # Calculate output for the last period

    return K, Y


def main():
    # Set default font (no need to specify Chinese fonts)
    plt.rcParams["axes.unicode_minus"] = False  # Ensure minus sign is displayed correctly

    # Model parameters
    A = 2  # Technology level
    delta = 0.1  # Capital depreciation rate
    K0 = 100  # Initial capital stock
    periods = 50  # Simulation periods

    # Different savings rates
    savings_rates = [0.1, 0.2, 0.3]
    labels = [f'Savings rate: {s}' for s in savings_rates]

    # Set plot style
    plt.figure(figsize=(12, 6))
    plt.style.use('seaborn-v0_8-whitegrid')

    # Simulate economic growth under different savings rates
    for s, label in zip(savings_rates, labels):
        K, Y = economic_growth_simulation(A, delta, K0, s, periods)
        plt.plot(range(periods + 1), Y, 'o-', linewidth=2, label=label)

    # Add plot title and labels (in English)
    plt.title('Total Output Over Time with Different Savings Rates', fontsize=16)
    plt.xlabel('Period', fontsize=14)
    plt.ylabel('Total Output (Y = AK)', fontsize=14)
    plt.grid(True, linestyle='--', alpha=0.7)
    plt.legend(fontsize=12)
    plt.xticks(fontsize=12)
    plt.yticks(fontsize=12)

    # Save the chart as an image
    plt.savefig('economic_growth.png', dpi=300, bbox_inches='tight')
    print("Chart saved as economic_growth.png")

    # Display the plot
    plt.tight_layout()
    plt.show()


if __name__ == "__main__":
    main()


 被折叠的 条评论
为什么被折叠?
被折叠的 条评论
为什么被折叠?
 到【灌水乐园】发言


