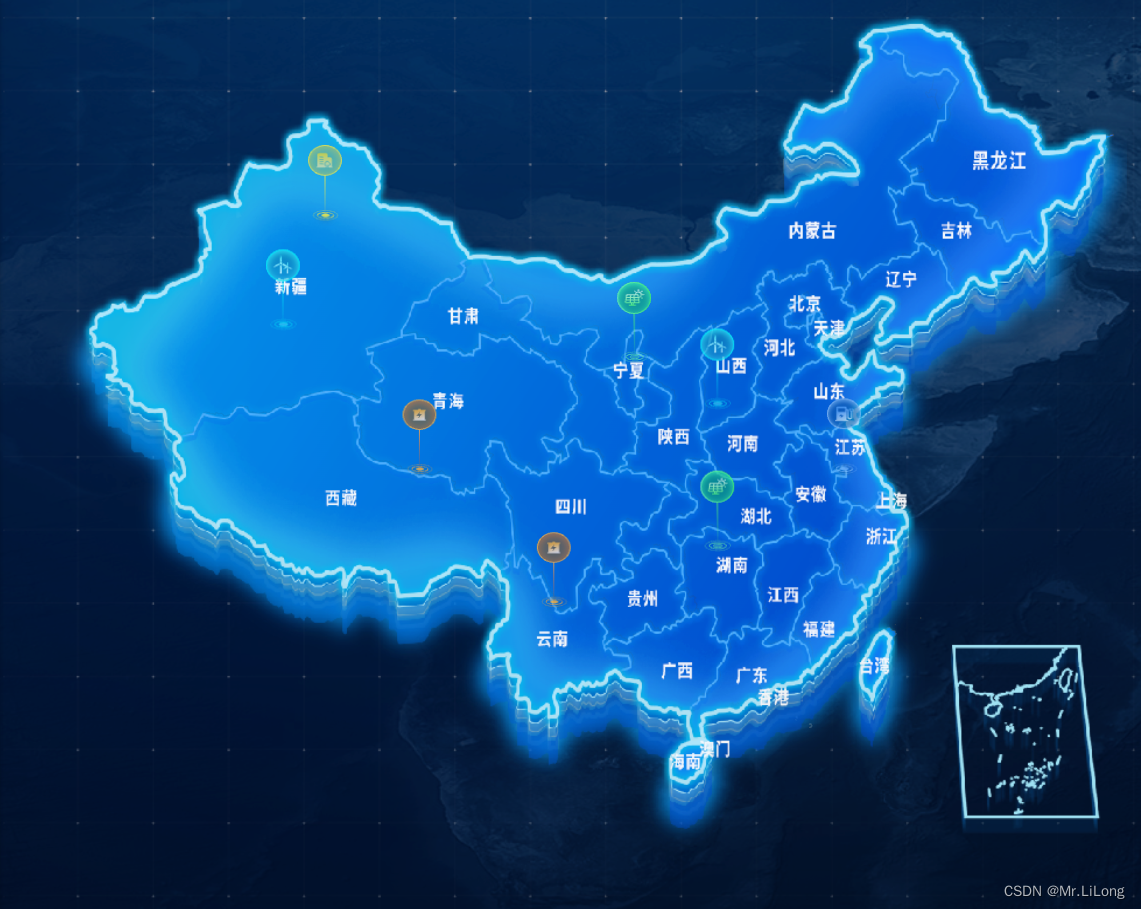
echarts依据svg作为地图并实现打点

效果图
在这里插入图片描述

 import chinamapSvg from "../../assets/images/map/map3.svg"; // 引入本地svg图片

geMap() {
let option= {
          tooltip: {
            show: true,
            backgroundColor: "rgba(6,57,133,0)",
            borderColor: "#13b8c3",
            borderWidth: 0,
            shadowColor: "rgba(6,57,133,0)", //发光?效果
            shadowBlur: 2,
            padding: 6,
            textStyle: {
              color: "#ffffff00",
            },
          },
  
          series: [
            {
              type: "scatter",
              coordinateSystem: "geo",
              data: [],
              symbol: "image://" + require("@/assets/images/map/sunIcon.png"),
              symbolSize: [25, 60],
              symbolOffset: [0, -35],
            },
            {
              type: "scatter",
              coordinateSystem: "geo",
              data: [],
              symbol: "image://" + require("@/assets/images/map/windIcon.png"),
              symbolSize: [25, 60],
              symbolOffset: [0, -35],
            },
            {
              type: "scatter",
              coordinateSystem: "geo",
              data: [],
              symbol: "image://" + require("@/assets/images/map/energyIcon.png"),
              symbolSize: [25, 60],
              symbolOffset: [0, -35],
            },
            {
              type: "scatter",
              coordinateSystem: "geo",
              data: [],
              symbol: "image://" + require("@/assets/images/map/cdIcon.png"),
              symbolSize: [25, 60],
              symbolOffset: [0, -35],
            },
            {
              type: "scatter",
              coordinateSystem: "geo",
              data: [],
              symbol: "image://" + require("@/assets/images/map/yqIcon.png"),
              symbolSize: [25, 60],
              symbolOffset: [0, -35],
            },
          ],
  
        }
	$.get(chinamapSvg, function (svg) {
  
          echarts.registerMap('organ_diagram', { svg: svg });
          option.tooltip.formatter = function (params) {
            if (params.componentSubType == "scatter") {
              let className = "norSty";
              if (params.data.status != "正常") {
                className = "abnorSty";
              }
              let toolTiphtml = "";
              let status = params.data.status == undefined ? "未知" : params.data.status;
              let power = params.data.power == undefined ? 0 : params.data.power;
              let capacity = params.data.capacity == undefined ? 0 : params.data.capacity;
              toolTiphtml =
                "<div class='toopTip' >" +
                "<div class='left'><img class='imgClass' src='" +
                vm.imgSrcTooltip(params.data.type) +
                "'><div class='" +
                className +
                "'>" +
                status +
                "</div></div>" +
                "<div class='right'><div class='staName'>" +
                params.data.name +
                "</div>" +
                "<div class='para'><div class='attr'>光伏辐照强度</div><div class='value'>" +
                power +
                "</div><div class='unit'>MWh</div></div>" +
                "<div class='para'><div class='attr'>当日发电量</div><div class='value'>" +
                power +
                "</div><div class='unit'>MWh</div></div>" +
                "<div class='para'><div class='attr'>额定容量</div><div class='value'>" +
                capacity +
                "</div><div class='unit'>MW</div></div><div>" +
                "</div>";
              return toolTiphtml;
            }
          }
          option.geo = [
           {
                        show: true,
                        layoutCenter: ["51.5%", "49.5%"], //位置
                        layoutSize: '155%', //大小
                        aspectScale: 0.78,
                        zoom: 0.64,
                        map: 'china',
                        roam: false,
                        label: {
                            normal: {
                                show: false,

                                textStyle: {
                                    color: "#fff",
                                    fontSize: 0,
                                },
                            },
                            emphasis: {
                                show: false,
                                textStyle: {
                                    color: "#fff",
                                    fontSize: 0,
                                },
                            },
                        },
                        itemStyle: {
                            normal: {
                                areaColor: {
                                    type: "linear",
                                    x: 1200,
                                    y: 0,
                                    x2: 0,
                                    y2: 0,
                                    colorStops: [
                                        {
                                            offset: 0.2,
                                            color: "#1A6CED", // 0% 处的颜色
                                        },
                                        {
                                            offset: 0.4,
                                            color: '#0551C1'
                                        },
                                        {
                                            offset: 0.7,
                                            color: "#0462C8", // 0% 处的颜色
                                        },
                                        {
                                            offset: 1,
                                            color: "#1892D8", // 50% 处的颜色
                                        },
                                    ],
                                    global: true, // 缺省为 false
                                },
                                // borderColor: "#47A4F2",
                                // borderWidth: 1.5,
                                // shadowColor: "#4DA8F5",
                                // shadowOffsetY: 10,
                                // shadowBlur: 120,
                            },
                            emphasis: {
                                show: false,
                                areaColor: "transparent",
                                borderWidth: 0
                            },
                        },
                        regions: [
                            {
                                name: "南海诸岛",
                                itemStyle: {
                                    // 隐藏地图
                                    normal: {
                                        opacity: 0, // 为 0 时不绘制该图形
                                    }
                                },
                                label: {
                                    show: false // 隐藏文字
                                }
                            }
                        ],
                    },
                    {
                        layoutCenter: ["50.5%", "52%"], //位置
                        layoutSize: '160%', //大小
                        aspectScale: 0.95,
                        zoom: 0.65,
                        roam: false,
                        map: 'organ_diagram',
                        itemStyle: {
                            borderWidth: 0,
                        },
                        emphasis: {
                            focus: 'none',
                            itemStyle: {
                                areaColor: '#ffffff',
                            },
                            label: {
                                show: false,
                            },
                        },
                        regions: [
                            {
                                name: 'map11',
                                itemStyle: {
                                    areaColor: 'red',
                                    color: 'red',
                                },
                            },
                        ],
                    },]
  
          mapChart.setOption(option);
          window.addEventListener("resize", () => {
            mapChart.resize();
          });
        })
}

这么做就不需要转换坐标了,但是有个弊端就是svg底图和正常引入的js底图的大小需要手动去调整,有略微的差别,有好的解决办法欢迎在评论区留言

  • 2
    点赞
  • 2
    收藏
    觉得还不错? 一键收藏
  • 2
    评论
使用 echarts 生成 svg 地图,需要先准备好地图数据,然后使用 echarts 的 geo 组件进行绘制。具体步骤如下: 1. 准备地图数据,可以从 echarts 官网下载或者使用第三方提供的地图数据。 2. 引入 echarts 库和地图数据。 3. 创建一个 div 容器,用于显示地图。 4. 初始化 echarts 实例,并设置容器和主题。 5. 配置 geo 组件,设置地图类型、地图数据、缩放级别等。 6. 配置 series 组件,设置数据和样式。 7. 调用 echarts 实例的 setOption 方法,将配置项传入。 下面是一个简单的示例代码: ```html <!DOCTYPE html> <html> <head> <meta charset="utf-8"> <title>echarts生成svg地图</title> <script src="https://cdn.jsdelivr.net/npm/echarts/dist/echarts.min.js"></script> </head> <body> <div id="map" style="width: 800px; height: 600px;"></div> <script type="text/javascript"> // 引入地图数据 echarts.registerMap('china', { "type": "FeatureCollection", "features": [ // 省份数据... ] }); // 初始化echarts实例 var myChart = echarts.init(document.getElementById('map'), 'light'); // 配置geo组件 myChart.setOption({ geo: { map: 'china', roam: true, zoom: 1.2, label: { show: true, fontSize: 12, color: '#000' }, itemStyle: { areaColor: '#f5f5f5', borderColor: '#999' } }, series: [{ type: 'map', map: 'china', data: [ // 数据... ], label: { show: true, fontSize: 12, color: '#000' }, itemStyle: { areaColor: '#ff0000' } }] }); </script> </body> </html> ```

“相关推荐”对你有帮助么?

  • 非常没帮助
  • 没帮助
  • 一般
  • 有帮助
  • 非常有帮助
提交
评论 2
添加红包

请填写红包祝福语或标题

红包个数最小为10个

红包金额最低5元

当前余额3.43前往充值 >
需支付:10.00
成就一亿技术人!
领取后你会自动成为博主和红包主的粉丝 规则
hope_wisdom
发出的红包
实付
使用余额支付
点击重新获取
扫码支付
钱包余额 0

抵扣说明:

1.余额是钱包充值的虚拟货币,按照1:1的比例进行支付金额的抵扣。
2.余额无法直接购买下载,可以购买VIP、付费专栏及课程。

余额充值