


chart的定义不要用ref,改成shallowRef
原因: 因vue3中使用了Proxy对象代理,但echarts中使用了大量的===造成对比失败
<template>
<div id="linechart" ref="myRef" clss="echarts"></div>
</template>
<script setup>
import * as echarts from "echarts";
const props = defineProps({
width: {
type: String,
default: "860",
},
height: {
type: String,
default: "400",
}
});
const myChart = echarts
const chart = shallowRef(null)
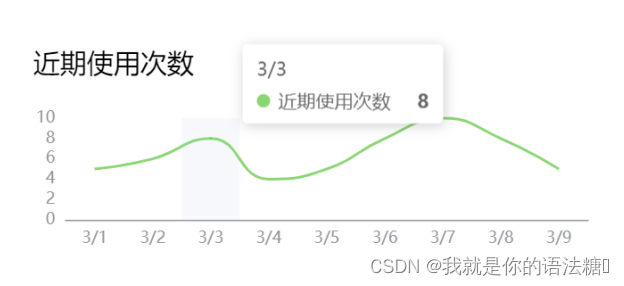
const xData = ['3/1','3/2','3/3','3/4','3/5','3/6','3/7','3/8','3/9']
const seriesData = [ 5,6,8,4,5,8,10,8,5 ]
const option = {
"title": {
"text": "使用次数",
x: "4%",
textStyle: {
color: 'black',
fontSize: '20',
fontFamily: "PingFang SC",
fontWeight: 400,
}
},
"tooltip": {
trigger: "axis",
show: true,
appendToBody : true,
// formatter: '{b} ({c})',
axisPointer: {
"type": "shadow",
textStyle: {
color: "#fff"
}
},
},
"grid": {
"borderWidth": 0,
"top": 130,
"bottom": 95,
textStyle: {
color: "#fff"
}
},
"xAxis": [{
"type": "category",
"axisLine": {
lineStyle: {
color: '#90979c'
}
},
"splitLine": {
"show": false
},
"axisTick": {
"show": false
},
"splitArea": {
"show": false
},
"axisLabel": {
"interval": 0,
},
"data": xData
}],
"yAxis": [{
"type": "value",
"splitLine": {
"show": false
},
"axisLine": {
lineStyle: {
color: '#90979c'
}
},
"axisTick": {
"show": false
},
"axisLabel": {
"interval": 0,
},
"splitArea": {
"show": false
},
}],
"series": [ {
"name": "使用次数",
"smooth":true,
"type": "line",
"stack": "总量",
"symbolSize":0,
"symbol":'circle',
"itemStyle": {
"normal": {
"color": "rgba(0,200,0,0.7)",
"barBorderRadius": 0,
"label": {
"show": false,
"position": "top",
formatter: function(p) {
return p.value > 0 ? (p.value) : '';
}
}
}
},
"data": seriesData
},
]
}
onMounted(()=>{
if(!chart.value){
chart.value = myChart.init(document.getElementById("linechart"), "purple-passion");
}
chart.value.setOption(option)
})
</script>
<style lang="scss" scoped>
.echarts{
width: 100%;
height: 100%;
}
</style>


 820
820


 被折叠的 条评论
为什么被折叠?
被折叠的 条评论
为什么被折叠?
 到【灌水乐园】发言


