using System;using System.Windows.Media;using LiveCharts;using LiveCharts.Geared;namespace Geared.Wpf.MultipleSeriesTest
{publicclassMultipleSeriesVm{publicMultipleSeriesVm(){
Series =newSeriesCollection();var r =newRandom();for(var i =0; i <30; i++)// 30 series{var trend =0d;var values =newdouble[10000];for(var j =0; j <10000; j++)// 10k points each{
trend +=(r.NextDouble()<.8?1:-1)*r.Next(0,10);
values[j]= trend;}var series =newGLineSeries{
Values = values.AsGearedValues().WithQuality(Quality.Low),
Fill = Brushes.Transparent,
StrokeThickness =.5,
PointGeometry =null//use a null geometry when you have many series};
Series.Add(series);}}publicSeriesCollection Series {get;set;}}}
前台:
<UserControlx:Class="Geared.Wpf.MultipleSeriesTest.MultipleSeriesView"xmlns="http://schemas.microsoft.com/winfx/2006/xaml/presentation"xmlns:x="http://schemas.microsoft.com/winfx/2006/xaml"xmlns:mc="http://schemas.openxmlformats.org/markup-compatibility/2006"xmlns:d="http://schemas.microsoft.com/expression/blend/2008"xmlns:lvc="clr-namespace:LiveCharts.Wpf;assembly=LiveCharts.Wpf"xmlns:multipleSeriesTest="clr-namespace:Geared.Wpf.MultipleSeriesTest"mc:Ignorable="d"d:DesignHeight="300"d:DesignWidth="300"><UserControl.DataContext><multipleSeriesTest:MultipleSeriesVm></multipleSeriesTest:MultipleSeriesVm></UserControl.DataContext><Grid><Grid.Resources><StyleTargetType="lvc:Separator">
<Setter Property="Stroke" Value="#69000000"></Setter>
<Setter Property="StrokeThickness" Value=".8"></Setter>
<Setter Property="StrokeDashArray" Value="2"></Setter>
</Style></Grid.Resources><Grid.RowDefinitions><RowDefinitionHeight="Auto"></RowDefinition><RowDefinitionHeight="*"></RowDefinition></Grid.RowDefinitions><TextBlockTextWrapping="Wrap">
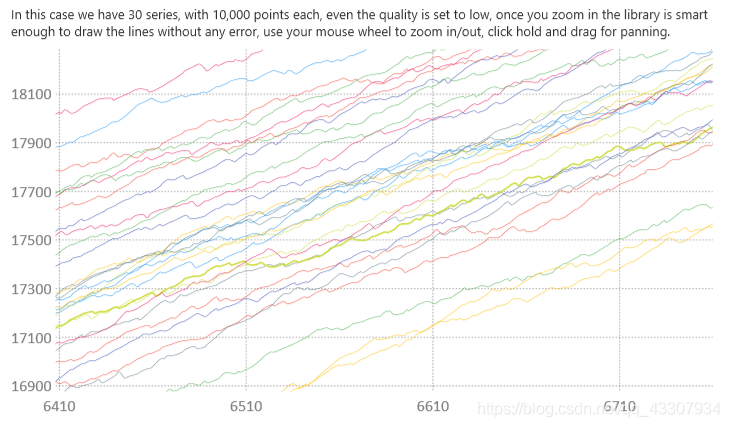
In this case we have 30 series, with 10,000 points each,
even the quality is set to low, once you zoom in the library is smart
enough to draw the lines without any error, use your mouse wheel to zoom in/out,
click hold and drag for panning.
</TextBlock><lvc:CartesianChartGrid.Row="1"DisableAnimations="True"Series="{Binding Series}"DataTooltip="{x:Null}"Zoom="Xy"/></Grid></UserControl>


 被折叠的 条评论
为什么被折叠?
被折叠的 条评论
为什么被折叠?
 到【灌水乐园】发言


