


matlab代码
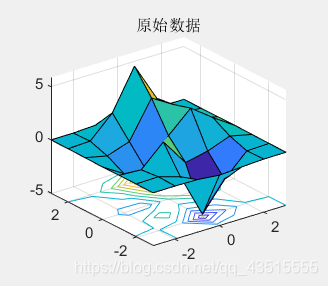
[x,y]=meshgrid(-3:1:3);
z=peaks(x,y)
[xi,yi]=meshgrid(-3:0.25:3);
figure(1)
surfc(x,y,z)
title('原始数据')
zi1=interp2(x,y,z,xi,yi,'spline')
zi2=interp2(x,y,z,xi,yi,'linear')
zi3=interp2(x,y,z,xi,yi,'nearest')
zi4=interp2(x,y,z,xi,yi,'cubic')
figure(2)
 subplot(2,2,1);
 surf(xi,yi,zi1);
 subplot(2,2,2);
 surf(xi,yi,zi2);
 subplot(2,2,3);
 surf(xi,yi,zi3);
 subplot(2,2,4);
 surf(xi,yi,zi4);
有棱有角
 最低0.47元/天 解锁文章


 1224
1224


 被折叠的 条评论
为什么被折叠?
被折叠的 条评论
为什么被折叠?
 到【灌水乐园】发言


