


直方图:
均衡化原理:

自适应均衡化:自适应直方图均衡化
傅里叶变换:
傅里叶变换

import cv2 as cv
import matplotlib.pyplot as plt
import numpy as np
# 直方图
'''
# mask = np.zeros(img.shape[:2], np.unit8)
# mask[100:300, 100:400] = 255
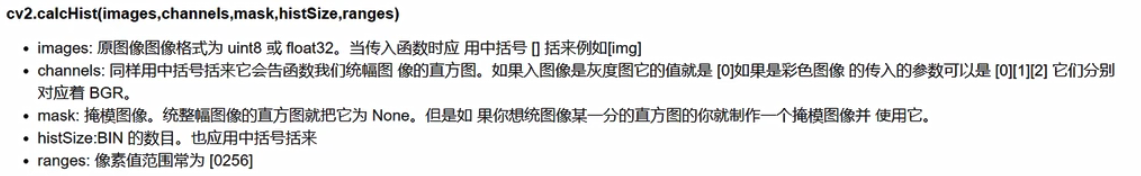
hist = cv.calcHist([img], [0], None, [256], [0, 256]) # None为掩码参数,也可用创建的mask
plt.hist(img.ravel(), 256) # 直方图绘制函数
plt.plot(hist, color = cool) # 也可利用hist绘制
plt.show()
'''
# 均衡化
'''
equ = cv.equalizeHist(img)
plt.hist(equ.ravel(), 256)
plt.show()
'''
# 自适应直方图均衡化
'''
clahe = cv.createCLAHE(clipLimit=2.0, tileGridSize=(8, 8))
res_clahe = clahe.apply(img)
'''
# 傅里叶变换(用cv展示图像就出现问题,用plt就可以????)
'''
img = cv.imread('C:/Users/27706/Desktop/1.jpg', cv.IMREAD_GRAYSCALE)
img = cv.resize(img, (512, 1024))
img_float32 = np.float32(img) # 输入图像需要先转换为np.float32格式
dft = cv.dft(img_float32, flags=cv.DFT_COMPLEX_OUTPUT) # 第一个通道是结果的实部,第二个通道是结果的虚部
dft_shift = np.fft.fftshift(dft) # 将零频点移到频谱的中间
# magnitude_spectrum = 20 * np.log(cv.magnitude(dft_shift[:, :, 0], dft_shift[:, :, 1])) # 将值变换值0-255,可打印成图像观察
rows, cols = img.shape
crow, ccol = int(rows/2), int(cols/2) # 图像中心位置
# 低通滤波
mask = np.zeros((rows, cols, 2), np.uint8)
mask[crow-511:crow+511, ccol-255:ccol+255] = 1 # 中间部分为低频,置1保留,中间置1区域越大,越接近原图
# 高通滤波
# mask = np.ones((rows, cols, 2), np.uint8)
# mask[crow-200:crow+200, ccol-200:ccol+200] = 0 # 中间部分为低频,置0舍去,中间置0区域越大,留下的信息越少
# IDFT
fshift = dft_shift * mask
f_ishift = np.fft.ifftshift(fshift)
img_back = cv.idft(f_ishift)
img_back = cv.magnitude(img_back[:, :, 0], img_back[:, :, 1]) - 255
plt.imshow(img_back, cmap='gray')
plt.show()
'''


 7072
7072


 被折叠的 条评论
为什么被折叠?
被折叠的 条评论
为什么被折叠?
 到【灌水乐园】发言


