


1.在管理Nuget程序包中下载DynamicDataDisplay
2.XAML代码:
添加命名空间:xmlns:d3="http://research.microsoft.com/DynamicDataDisplay/1.0"
<Window x:Class="WpfCPUDemo.MainWindow"
        xmlns="http://schemas.microsoft.com/winfx/2006/xaml/presentation"
        xmlns:x="http://schemas.microsoft.com/winfx/2006/xaml"
        xmlns:d="http://schemas.microsoft.com/expression/blend/2008"
        xmlns:mc="http://schemas.openxmlformats.org/markup-compatibility/2006"
        xmlns:local="clr-namespace:WpfCPUDemo"
        xmlns:d3="http://research.microsoft.com/DynamicDataDisplay/1.0"
        mc:Ignorable="d"
        Title="CPU Demo" Height="350" Width="525" Loaded="Window_Loaded">
    <Grid>
        <Grid.RowDefinitions>
            <RowDefinition Height="auto"/>
            <RowDefinition Height="*"/>
        </Grid.RowDefinitions>
        <StackPanel Orientation="Horizontal">
            <TextBlock  Text="CPU Usage" Margin="20,10,0,0" FontSize="15" FontWeight="Bold"/>
            <TextBlock x:Name="cpuUsageText" Margin="10,10,0,0" FontSize="15"/>
        </StackPanel>
        <d3:ChartPlotter x:Name="plotter" Margin="10,10,20,10" Grid.Row="1">
            <d3:ChartPlotter.VerticalAxis>
                <d3:VerticalIntegerAxis/>
            </d3:ChartPlotter.VerticalAxis>
            <d3:ChartPlotter.HorizontalAxis>
                <d3:HorizontalIntegerAxis/>
            </d3:ChartPlotter.HorizontalAxis>
            <d3:Header Content="CPU Performance History"/>
            <d3:VerticalAxisTitle Content="Percentage"/>
        </d3:ChartPlotter>
    </Grid>
</Window>
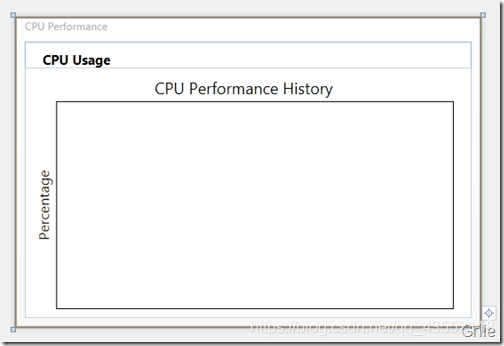
效果图:
3.MainWindow.xaml.cs代码
using Microsoft.Research.DynamicDataDisplay;
using Microsoft.Research.DynamicDataDisplay.DataSources;
using System;
using System.Collections.Generic;
using System.Diagnostics;
using System.Linq;
using System.Text;
using System.Threading.Tasks;
using System.Windows;
using System.Windows.Controls;
using System.Windows.Data;
using System.Windows.Documents;
using System.Windows.Input;
using System.Windows.Media;
using System.Windows.Media.Imaging;
using System.Windows.Navigation;
using System.Windows.Shapes;
using System.Windows.Threading;

namespace WpfCPUDemo
{
    /// <summary>
    /// MainWindow.xaml 的交互逻辑
    /// </summary>
    public partial class MainWindow : Window
    {
        //通过ObservableDataSource<Point> 动态存储图表坐标点,PerformanceCounter 获取CPU使用率数值,DispatcherTimer 计时器在规定间隔进行取数操作,整型i 作为CPU使用率坐标点的X轴数值。
        private ObservableDataSource<Point> datasource = new ObservableDataSource<Point>();
        private PerformanceCounter cpuPerformace = new PerformanceCounter();
        private DispatcherTimer timer = new DispatcherTimer();
        private int i = 0;
        public MainWindow()
        {
            InitializeComponent();
        }

        private void Window_Loaded(object sender, RoutedEventArgs e)
        {
            //AddLineGraph 方法将dataSource 中的坐标点绘制到图表中,曲线颜色定义为绿色,粗细设置为2,曲线名称为"Percentage"。设置计时器间隔为1秒,连续执行AnimatedPlot 事件实时绘制新坐标点
            plotter.AddLineGraph(datasource, Colors.Green, 2, "Percentage");
            timer.Interval = TimeSpan.FromSeconds(1);
            timer.Tick += new EventHandler(AnimatedPlot);
            timer.IsEnabled = true;
            plotter.Viewport.FitToView();
        }
        //AnimatedPlot 事件用于构造坐标点,通过设置cpuPerformance 相关参数,并使用NextValue() 方法获取当前CPU使用率数据作为Y值,整型i 作为X值。将X、Y值构造为坐标点(Point),并通过异步方式存储在dataSource 中
        private void AnimatedPlot(object sender, EventArgs e)
        {
            cpuPerformace.CategoryName = "Processor";
            cpuPerformace.CounterName = "% Processor Time";
            cpuPerformace.InstanceName = "_Total";
            double x = i;
            double y = cpuPerformace.NextValue();
            Point point = new Point(x,y);
            datasource.AppendAsync(base.Dispatcher, point);
            cpuUsageText.Text = String.Format("{0:0}%",y);
            i++;
        }
    }
}
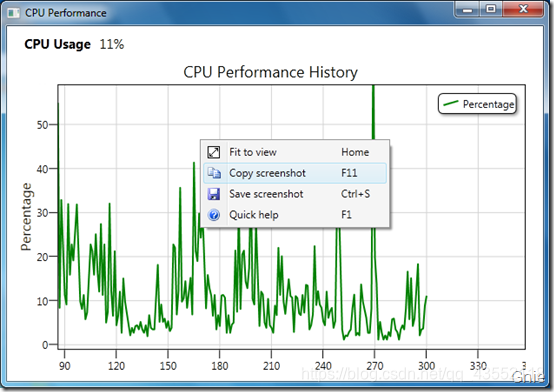
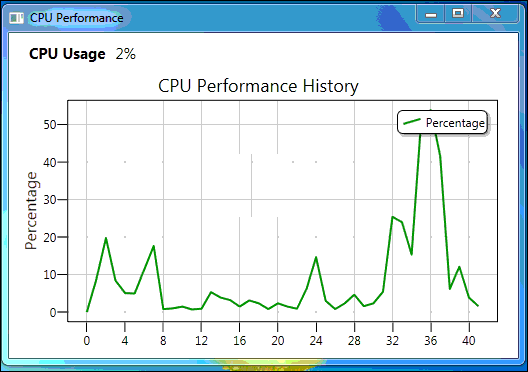
最终效果图:鼠标右键可将图表拷贝到其他文档,鼠标左键拖动图表浏览任意位置曲线数据,鼠标中键可以缩放显示曲线图。


 2046
2046

 被折叠的 条评论
为什么被折叠?
被折叠的 条评论
为什么被折叠?
 到【灌水乐园】发言


