


Echarts官方网址:https://echarts.apache.org/zh/index.html
简介:
使用echarts绘制3d地图以及在3d地图上绘制江苏省区域边界飞线图以及3d柱状图和3d散点.

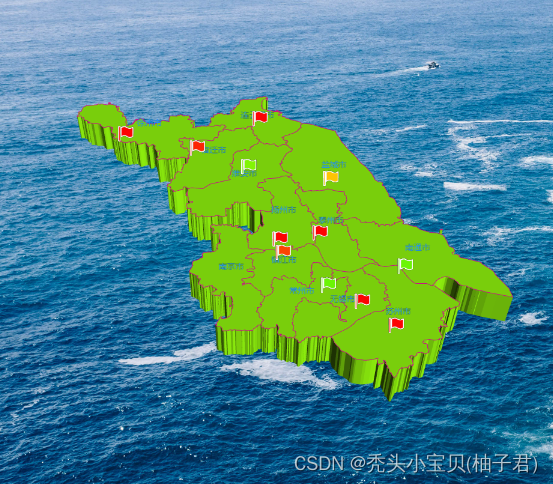

3D地图
const option = {
//setBanner中循环this.dataChart,然后触发dispatchAction{type:'showTips'},轮播间隔:bannerTime
//PS: dataChart:界面配置的静态、动态API、sql数据的结果数据
//PS: dataChart是src/echart/common.js::updateData里经过api/sql查询的结果并经过dataFormatter(配置的响应数据的处理脚本配置)处理过的数据
//htmlTip: [ series.tooltip > geo.tooltip >tooltip ]
//series.tooltip根据this.dataChart进行轮播展示, geo.tooltip则根据区域名找this.dataChart里对应的记录展示(没有就显示区域名)
//dataChart的格式:{name:'区域名',title:'标题',lng:'经度',lat:'纬度',value:[{title:'字段名',type:'类型',data:'数据'}]}
tooltip: (() => {
return Object.assign(
(() => {
// console.log("DENGG-DEBUG 提示事件formatter:=",this.formatter)
//如果没有配置提示事件,则会显示this.dataChart中的数据
//如果配置提示事件,其作用就是对dataChart进行进一步处理
if (this.formatter) {
return {
//tooltip-支持字符串模板和回调函数两种形式,可以返回{string | HTMLElement | HTMLElement[]}
formatter1: '{a}\n来源:{b}\n数量:{c}\n比例:{d}%', //字符串模板:有效果,但不可以换行
formatter: (name, item) => { //回调函数格式:=> [tooltip.formatter] string | HTMLElement | HTMLElement[]
// console.log("DENGG-DEBUG 提示事件param:=",item); //这里的item=item_series_0_{x},意义不大
// console.log("DENGG-DEBUG [tooltip] name:=",name); //name中已经包含data,还有marker样式信息
// console.log("DENGG-DEBUG 提示事件dataChart:=",this.dataChart);
//这里传递的参数和界面配置提示事件的输入参数对应,界面配置提示事件的作用就是对dataChart进行进一步处理
// 其中name.dataIndex是当前轮询到的数据索引值,name.maker定义显示样式==>从何而来?==>echarts.min.js
//改变name.marker好像无效果
// name.marker = "<span style=\"display:inline-block;margin-right:5px;border-radius:20px;width:10px;height:10px;background-color:rgb(244,244,244);\"></span>"
return this.htmlTips(name);
// return "tooltip";
return this.formatter(name, this.dataChart);
}
};
}
return {};
})(),
{
backgroundColor: this.option.tipBackgroundColor || "rgba(0,0,0,1)",
// extraCssText: 'box-shadow: 0 0 3px rgba(0, 0, 0, 0.3);',
textStyle: {
fontSize: this.option.tipFontSize || 20,
color: this.option.tipColor || "red"
},
triggerOn: 'mousemove|click', //mousemove,click,none,默认mousemove
trigger: 'item' // 默认item 图形触发, axis 坐标轴触发, none 不触发
}
);
})(),
geo3D: Object.assign(
(() => { //target
if (!this.validatenull(this.centerData)) {
return {
center: this.centerData //当前视角的中心点,用经纬度表示
};
}
return {};
})(),
{
map: "HK", //这个地方的名字与上面registerMap时的名字对应
zoom: this.zoomData,
layoutCenter: ["50%", "50%"], //控制显示中心点位置
layoutSize: 1800, //控制显示大小
roam: this.roam, //是否开启鼠标缩放和平移漫游。默认不开启。如果只想要开启缩放或者平移,可以设置成 'scale' 或者 'move'。设置成 true 为都开启
// aspectScale:0.75, //这个参数用于 scale 地图的长宽比。
left: this.option.gridX, //好像没效果
top: this.option.gridY,
right: this.option.gridX2,
bottom: this.option.gridY2,
// silent:false, //图形是否不响应和触发鼠标事件,默认为 false,即响应和触发鼠标事件。
//不定义tooltip则默认弹窗显示区域lable名
tooltip: {
show: this.option.popShow,
formatter: params => {
console.log(params)
// console.log("DENGG-DEBUG 提示事件params.name:=",params.name)
//params:= {"componentType":"geo","name":"山西省","$vars":["name"],"geoIndex":0}
// console.log("DENGG-DEBUG [geo.tooltip] params:=",JSON.stringify(params))
//TODO:这里可以定义显示样式
return "geo.tooltip:=" + JSON.stringify(params.name); //区域名称
// return "<span style=\"display:inline-block;margin-right:5px;border-radius:20px;width:10px;height:10px;background-color:rgb(244,244,244);\">"+params.name+"</span>"
},
//鼠标放上去的颜色
//默认弹框
backgroundColor: this.option.popUpEmpColor,
textStyle: {
fontSize: this.option.popUpFontSize || 14,
color: this.option.popUpColor,
width: this.option.popUpWidth,
height: this.option.popUpHeight,
},
},
//区域图形上的文本标签,可用于说明图形的一些数据信息,比如值,名称等
label: {
show: true,
fontSize: this.fontSize,
color: this.color,
textStyle: {
color: "#000",//文字颜色
fontSize: 16,//文字大小
fontFamily: '微软雅黑',
backgroundColor: "rgba(0,0,0,0)",//透明度0清空文字背景
}
},
itemStyle: {
color: this.option.areaColor,
opacity: 1,
borderWidth: this.option.borderWidth,
borderColor: this.option.borderColor,
},
light: {
//主光源
main: {
color: "#fff",
intensity: 1,
shadow: true,
alpha: 40,
}
},
shading: 'lambert',
// environment: new echarts.graphic.LinearGradient(0, 0, 0, 1, [{
// offset: 0, color: '#09C7F7' // 天空颜色
// }, {
// offset: 0.7, color: '#09C7F7' // 地面颜色
// }, {
// offset: 0, color: '#fcf7f7' // 地面颜色
// }], false),
viewControl: {
projection: 'perspective',
autoRotate: false,
// damping: 0,
rotateSensitivity: 1, // 旋转操作的灵敏度
rotateMouseButton: 'left', // 旋转操作使用的鼠标按键
zoomSensitivity: 1, // 缩放操作的灵敏度
panSensitivity: 1, // 平移操作的灵敏度
// panMouseButton: 'right', // 平移操作使用的鼠标按键
distance: 150, // 默认视角距离主体的距离
center: [0, 0, 0],
animation: true,
animationDurationUpdate: 1000,
animationEasingUpdate: 'cubicInOut'
},
boxWidth: this.option.boxWidth || 89,
boxHeight:6,
boxDepth: this.option.boxDepth || 140,//地图倾斜度
regionHeight: this.option.regionHeight || 4,//地图高度
selectedMode: "single",// 地图高亮单选
emphasis: {
label: {
show: true,//是否显示标签
fontSize: this.fontSize + 3,
textStyle: {
color: '#fff',//高亮文字颜色
fontFamily: '微软雅黑'
},
formatter: params => {
// console.log("DENGG-DEBUG 提示事件params.name:=",params.name)
// console.log("DENGG-DEBUG 提示事件params:=", params)
this.paramsName=params.name;
// console.log(this.paramsName)
return params.name;
// return params.status;
},
},
itemStyle: {//鼠标悬浮(mouseover)时的区域显示样式
borderWidth: this.borderWidth + 2,
borderColor: this.borderColor,
areaColor: this.empAreaColor
}
},
}
),
visualMap: {
min: 1,
max: this.option.max || 3,
show: this.option.visualMap3dShow || false,
// splitNumber: 5,
calculable: true,
// range: [0, 20],
// realtime = true,
// align = 'auto',
inRange: {
color: ['#fc0303', '#fdf003', '#6bf505'].reverse()
},
textStyle: {
color: '#fff'
}
},
animation: true, //是否开启动画
animationDurationUpdate: 1000, //过渡动画的时长
animationEasingUpdate: 'cubicInOut' ,//过渡动画的缓动效果
series: [
{
type: 'scatter3D',
coordinateSystem: "geo3D",
data: this.scatter3DData || [],
// symbol: 'arrow',//rect,roundRect,triangle,diamond,pin,arrow散点的形状
// let symbolImg = 'image://'+ require('@/assets/bigscreen-img/map-logo.png') //或者import引入在拼接也行
// symbol:'image://data:image/gif;base64,R0lGODlhEAAQAMQAAORHHOVSKudfOulrSOp3WOyDZu6QdvCchPGolfO0o/XBs/fNwfjZ0frl3/zy7wAAAAAAAAAAAAAAAAAAAAAAAAAAAAAAAAAAAAAAAAAAAAAAAAAAAAAAAAAAAAAAACH5BAkAABAALAAAAAAQABAAAAVVICSOZGlCQAosJ6mu7fiyZeKqNKToQGDsM8hBADgUXoGAiqhSvp5QAnQKGIgUhwFUYLCVDFCrKUE1lBavAViFIDlTImbKC5Gm2hB0SlBCBMQiB0UjIQA7',
symbol:'circle',
//三角triangle
// symbol:'diamond', //点形状 'circle', 'rect', 'roundRect', 'triangle', 'diamond', 'pin', 'arrow', 'none'
symbolSize: this.option.symbolSize || 30,
//散点图颜色描边等样式
itemStyle: {
color: '#2e83aa',//散点图图形的颜色。
opacity: 1,
},
//标签样式
label: {
show: this.option.labelShow || false,
position: 'right',
fontSize: this.fontSize,
color: this.color,
textStyle:{
color:'black', //文字颜色
borderWidth:0, //标签上边框宽度
borderColor:'white', //边框颜色
fontFamily:'宋体', //标签字体
fontSize:14, //字体大小
fontWeight:'normal' //是否加粗
},
formatter(params) {
console.log(params.value[2]+params.value[3])
return params.value[2]+params.value[3];
}
},
// 高亮
emphasis: {
itemStyle: {
color: this.option.emphasisColor || '#faf602',
opacity: 0.8,
borderWidth: 2,
borderColor: '#e51717'
},
label: {
show: true,
position: 'right',
textStyle:{
color:'black', //文字颜色
borderWidth:0, //标签上边框宽度
borderColor:'white',//边框颜色
fontFamily:'宋体', //标签字体
fontSize:14, //字体大小
fontWeight:'normal' //是否加粗
}
// formatter 高亮区数据
}
},
//tooltip
tooltip:{
formatter(params) {
console.log(params)
return params.value[2]
}
},
//动画
animation: true, //是否开启动画
animationDurationUpdate: 1000, //过渡动画的时长
animationEasingUpdate: 'cubicInOut' ,//过渡动画的缓动效果
//散点结束
},
// 柱状
{
type: 'bar3D',
coordinateSystem: "geo3D",
// data: [[111.142701, 21.463603, 100], [111.142701, 22.463603, 200], [111.142701, 24.463603, 210], [111.142701, 27.463603, 230]],//柱状
data: this.bar3DData || [],
//柱体的样式
itemStyle: {
color: this.option.emphasisColor || '#faf602',
opacity: 0.8,
borderWidth: 2,
borderColor: '#e51717'
},
//标签
label: {
show: true,
position: 'right',
// formatter 高亮区数据
formatter(params) {
console.log(params)
return params.value[2]
}
},
barSize: this.option.barSize || 1,
minHeight:this.option.minHeight||1,
// 高亮
emphasis: {
itemStyle: {
color: this.option.emphasisColor || '#51e528',
opacity: 0.8,
borderWidth: 2,
borderColor: '#e51717'
},
label: {
show: true,
position: 'right',
// formatter 高亮区数据
textStyle: {
color: '#131212',
backgroundColor: '#fff'
},
formatter(params) {
console.log(params)
return params.value[2]
}
}
},
//动画
animation: true,
animationDurationUpdate: 500,
animationEasingUpdate: 'cubicOut',
},
// 飞线分布
{
name: "typeOne",
type: 'lines3D',//飞线
// type: 'lines3D',//飞线
coordinateSystem: "geo3D",
data: this.option.lines3DShow ? this.jangshuData:[],
// data: this.jangshuData||[],
polyline: true, //飞线图是否多线段
effect: {//飞线的尾迹特效。
show: true,//是否显示尾迹特效,默认不显示。
period: 2,//尾迹特效的周期。
constantSpeed: this.option.constantSpeed || 10,//轨迹特效的移动动画是否是固定速度
trailWidth: this.option.trailWidth || 10,//宽度。
trailLength: this.option.trailLength || 3,//尾迹的长度
trailColor: this.option.trailColor ,
// trailColor: this.option.trailColor || '#faee07',
},
// blendMode: 'lighter',//注意:此处是显示叠加高亮效果的但是在散点图时不能通用
// // //飞线end
},
{
type :'map3D',
name:"map",
map: 'china',
groundPlane:{
show:true,
color : '#e01010',
},
label:{
show:true,
// formatter:
}
}
]
};
//江苏区域轮廓飞线图
 guijiData() {
      let coordinatesArr = [];
      jangshu.features.forEach(tempData => {
        let geometry = [];
        tempData.geometry.coordinates[0].forEach(coordinates => {
          coordinates.forEach(coordinate => {
            geometry.push(coordinate)
          })
        })
        coordinatesArr.push(geometry);
      })
      let result = [];
      for (let i = 0; i < coordinatesArr.length; i++) {
        let tempIArr = [];
        let arrOne = coordinatesArr[i];
        for (let j = 0; j < arrOne.length; j++) {
          let coordinatesArrTemp = [];
          coordinatesArrTemp.push(arrOne[j]);
          coordinatesArrTemp.push(arrOne[j + 1]);
          tempIArr.push(coordinatesArrTemp)
        }
        result.push(tempIArr)
      }
      let arrResult = [];
      for (let i = 0; i < result.length; i++) {
        for (let j = 0; j < result[i].length - 1; j++) {
          arrResult.push(result[i][j]);
        }
      }
      this.jangshuData = arrResult;
      return arrResult;
    },
江苏省.JEOJSON
https://download.csdn.net/download/qq_43557302/86399879


 4382
4382


 被折叠的 条评论
为什么被折叠?
被折叠的 条评论
为什么被折叠?
 到【灌水乐园】发言


