


 本文详细介绍了MATLAB在数值微积分中的应用,包括多项式微分、数值积分、方程求根、线性方程组的解法以及统计分析如平均、中位数、方差等。此外,还探讨了简单线性回归、内插方法如线性内插和样条插值,并对比了不同插值方法的效果。
目录
2.polynomial differentiation(多项式微分)
5.polynomial integration(多项式积分)
6.numerical differentiation(数值微分)
1.symbolic root finding approach
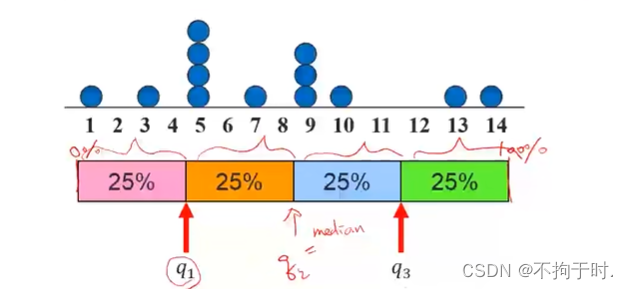
2.mean median mode quartile平均中位众四等分点的值
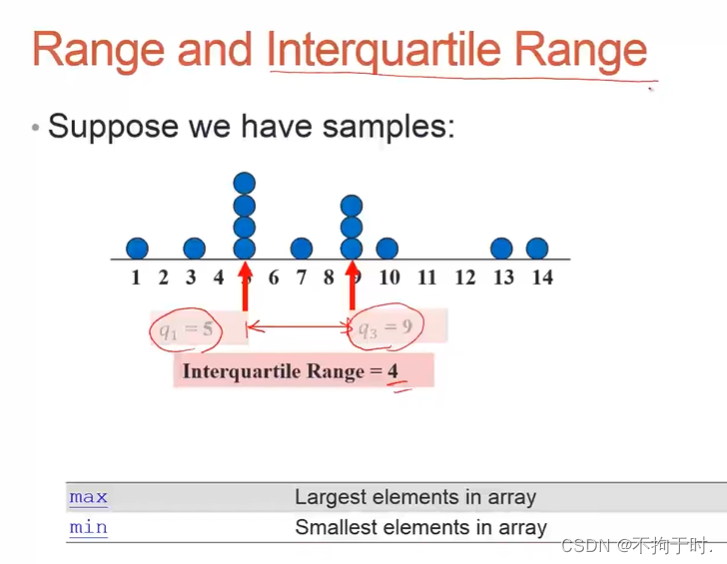
3. range and interquartile range
6.figures are always more powerful(图表描述)
12. statistical hypothesis testing(统计假设检验)
1.simple linear regression简单线性回归
12.cubic spline vs hermite polynomial
一 数值微积分
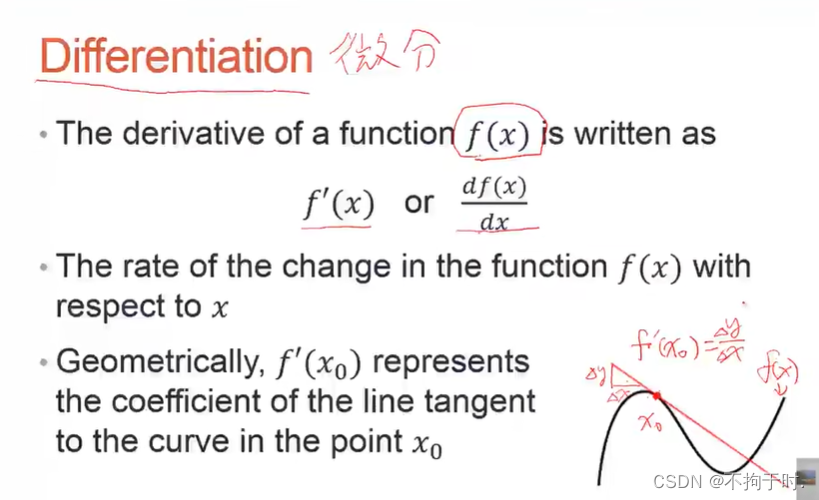
1. differentiation微分
2.polynomial differentiation(多项式微分)
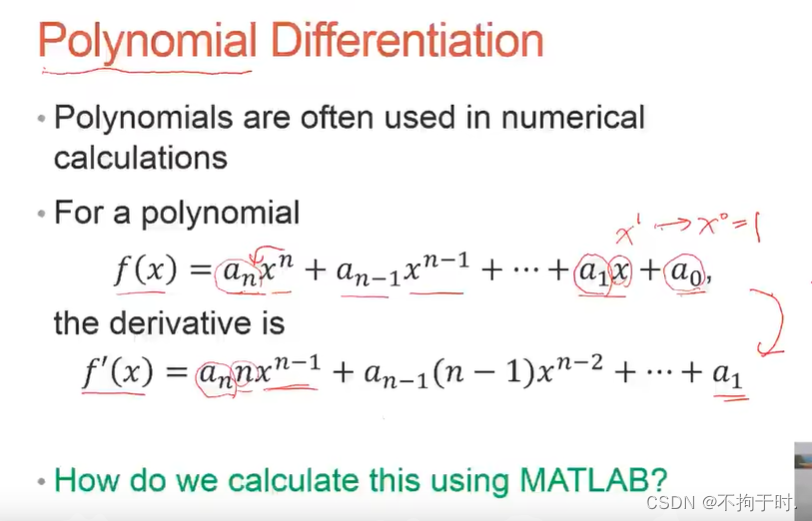
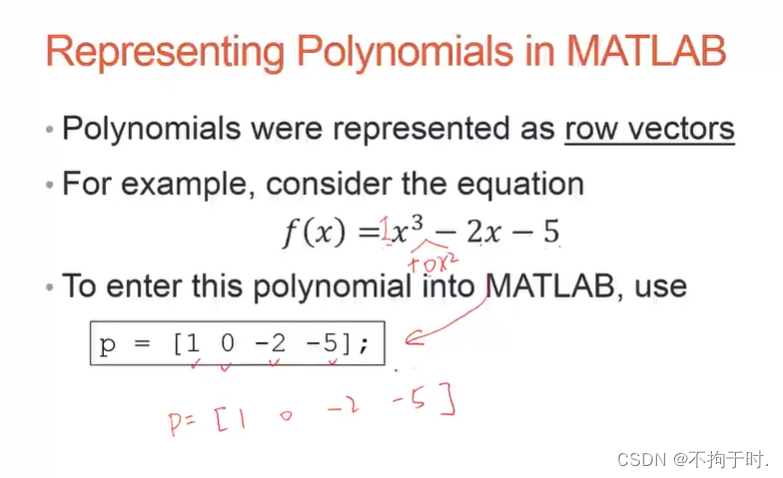
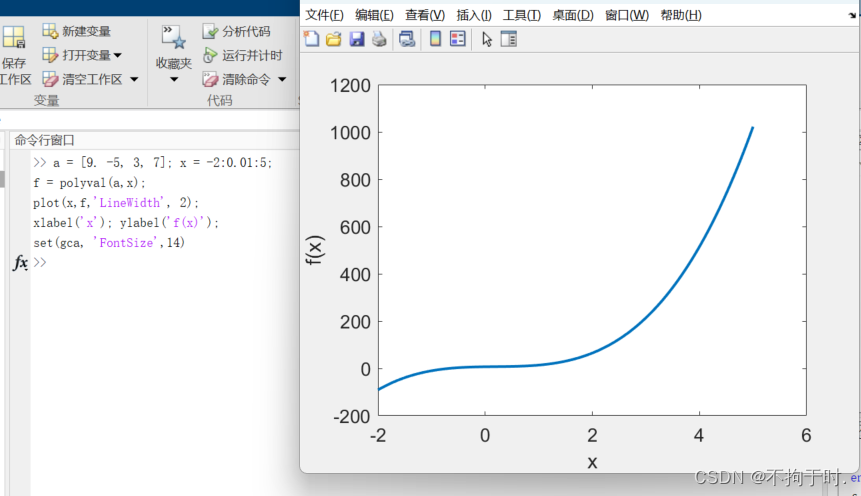
用行向量表示多项式,最后一项对应常数项,其他向量对应次方的系数。
a表示的是多项式,x表示这些x的值。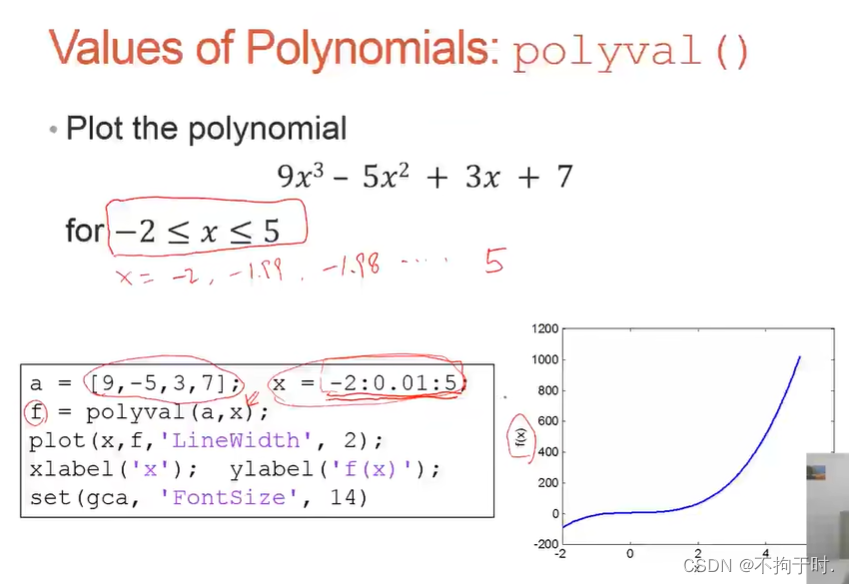
gca用于调图像的各个参数
>> a = [9. -5, 3, 7]; x = -2:0.01:5;
f = polyval(a,x);
plot(x,f,'LineWidth', 2);
xlabel('x'); ylabel('f(x)');
set(gca, 'FontSize',14)
>> 
3.polyder微分
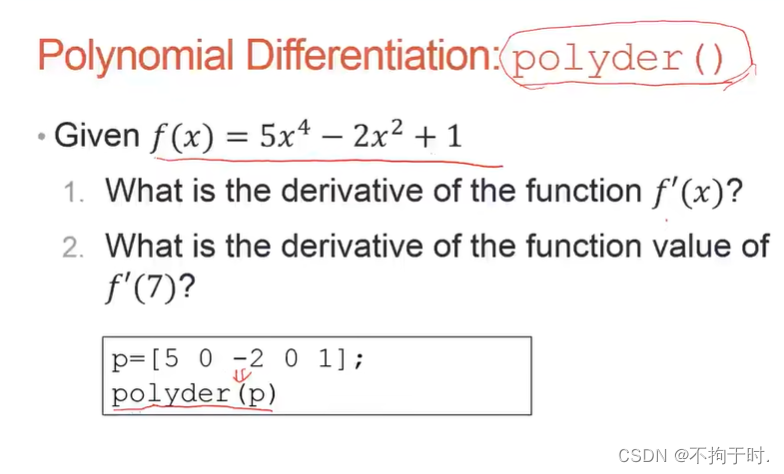

计算求导如下图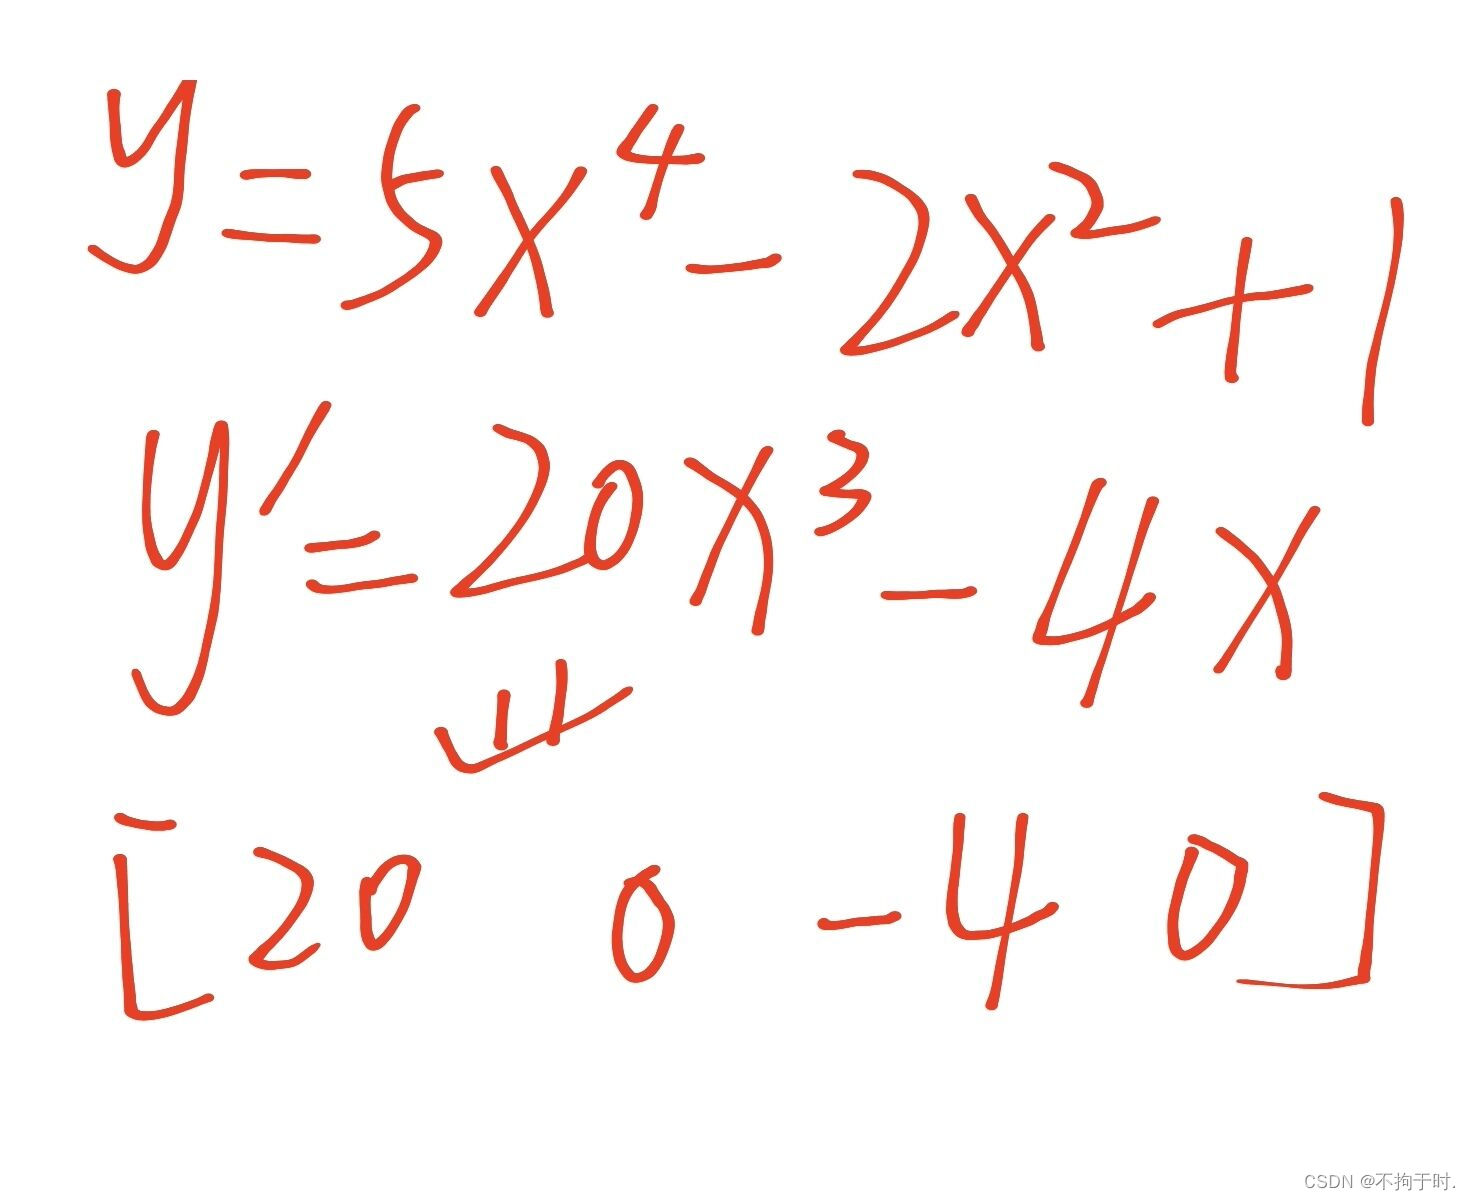
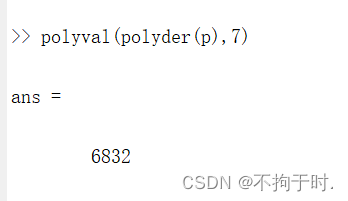
如果想知道给定x数值下的导数,要使用polyval
4.求导练习
提示conv()是把两个多项式相乘。这里老师的图片中的公式的x的三次方的系数是5,我在练习的时候也改成5了。
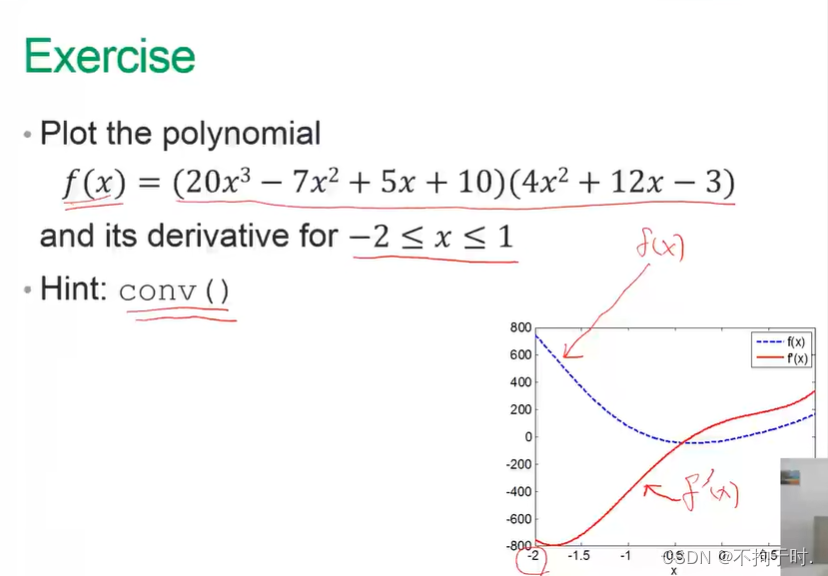
注意:①得到导数后,需要使用polyval结合x值得到对应的数值(之前这里卡了很久),②为了让两条线不重叠添加hold on和hold off语句。③在图示中需要表示导数,用\prime来表示。
 a = [5, -7, 5, 10]; b = [4, 12, -3]; x= [-2:0.01:1];
p = conv(a,b);
f = polyval(p,x);
y = polyval(polyder(p),x);
hold on;
plot(x,f, '--b');
plot(x,y,'-r');
hold off;
xlabel('x');
legend('f(x)','f\prime(x)'); 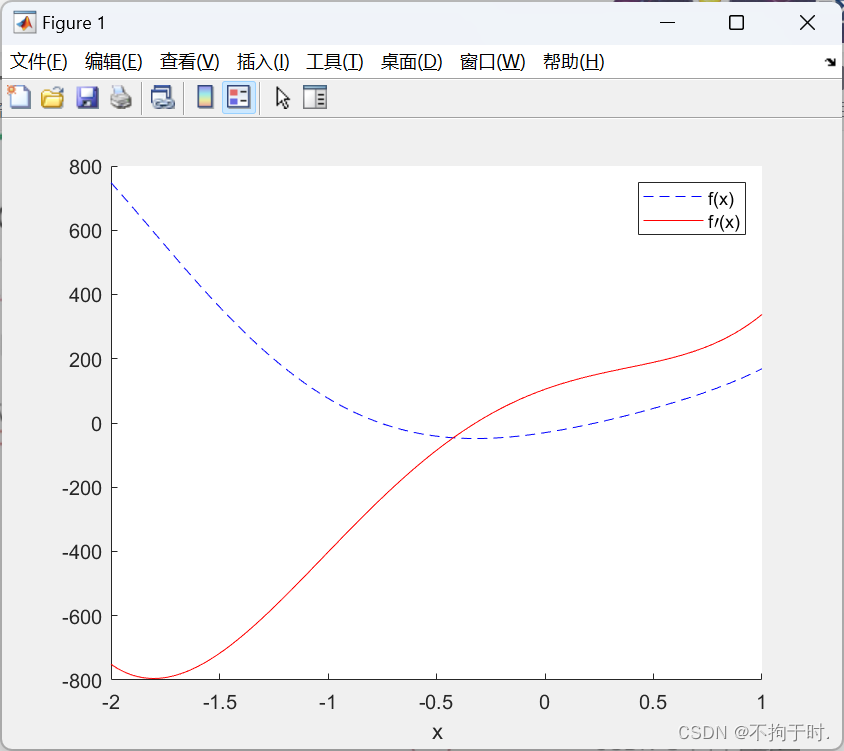
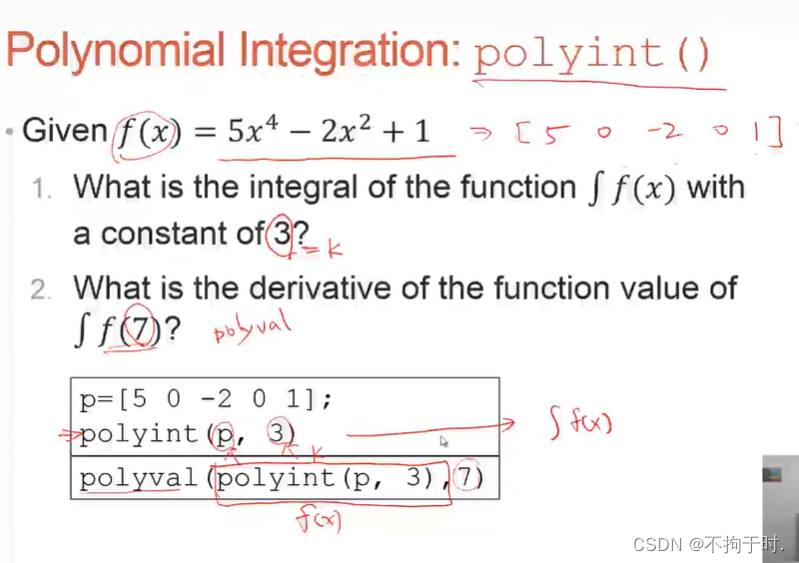
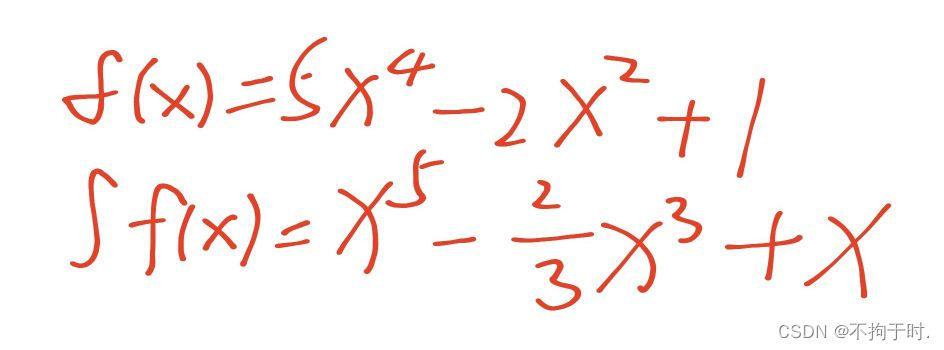
5.polynomial integration(多项式积分)
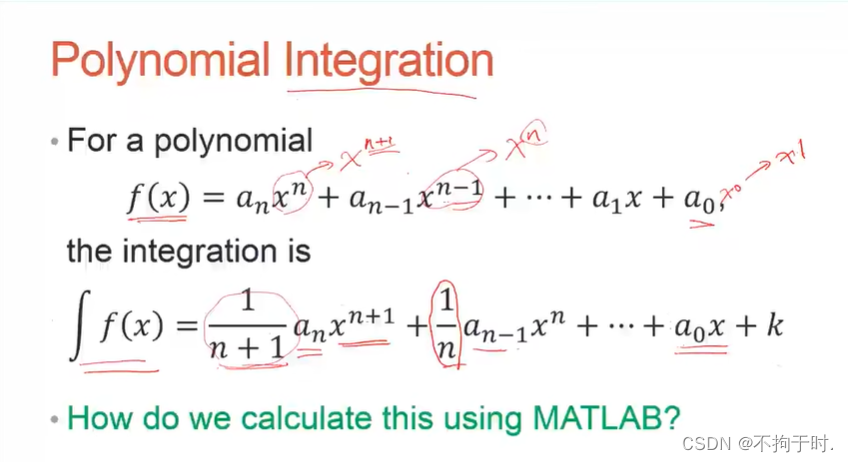
用polyint来表示积分,在积分时要把常数k也写上。
手算的积分为下图:
>> p = [5 0 -2 0 1];
polyint(p,3)
polyval(polyint(p,3),7) 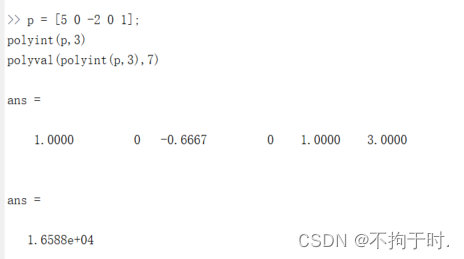
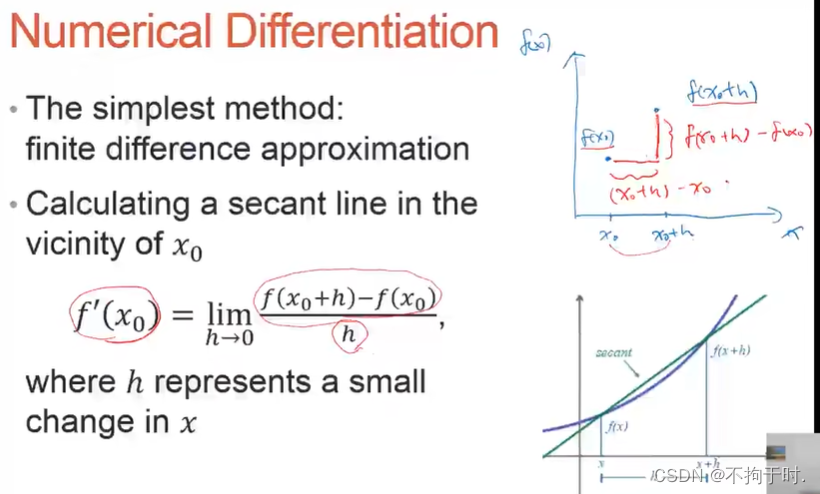
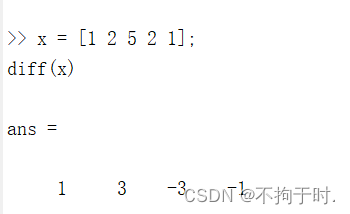
6.numerical differentiation(数值微分)
就是定义。
diff()返回差值,也就是diff(x)会返回,1 3 -3 -1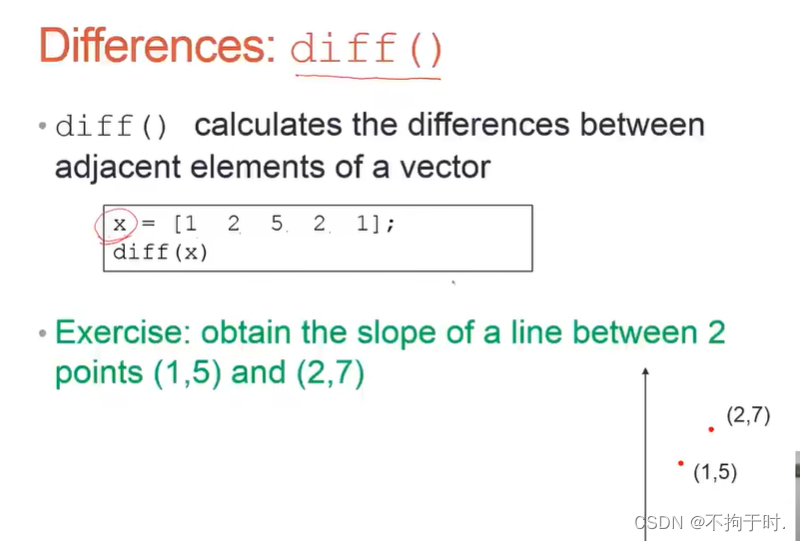
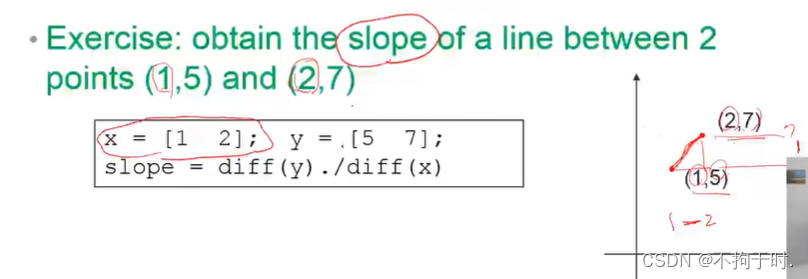
7.计算斜率
8.使用diff计算数值微分
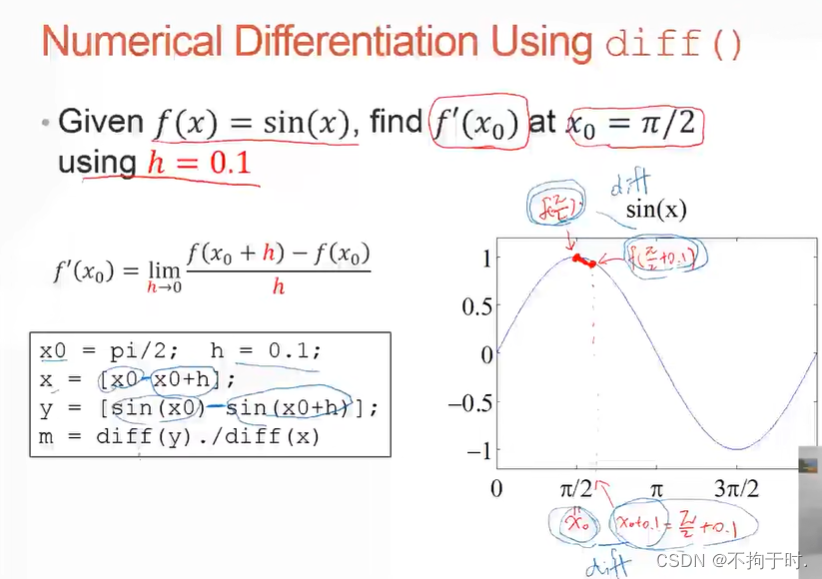
>> x0 = pi/2; h = 0.1;
x = [x0 x0+h];
y = [sin(x0) sin(x0+h)];
m = diff(y)./diff(x)

m =

   -0.0500
9.sin导数误差
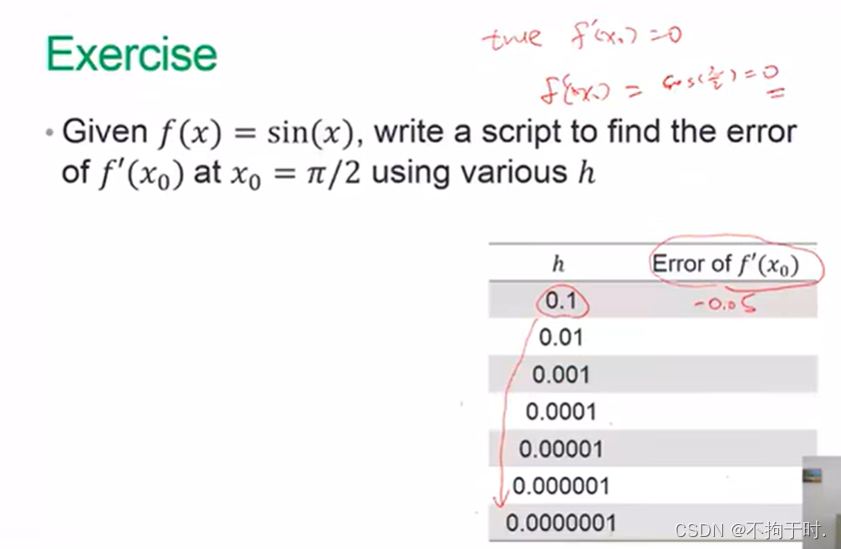
这里算到第四个的时候误差太小,就为0了。
>> x0 = pi/2;
h = 1;
i = 0.1;
for n = 1:10
   h = h*i;
   x = [x0 x0+h];
   y = [sin(x0) sin(x0+h)];
   m(n) = diff(y)./diff(x);
end
m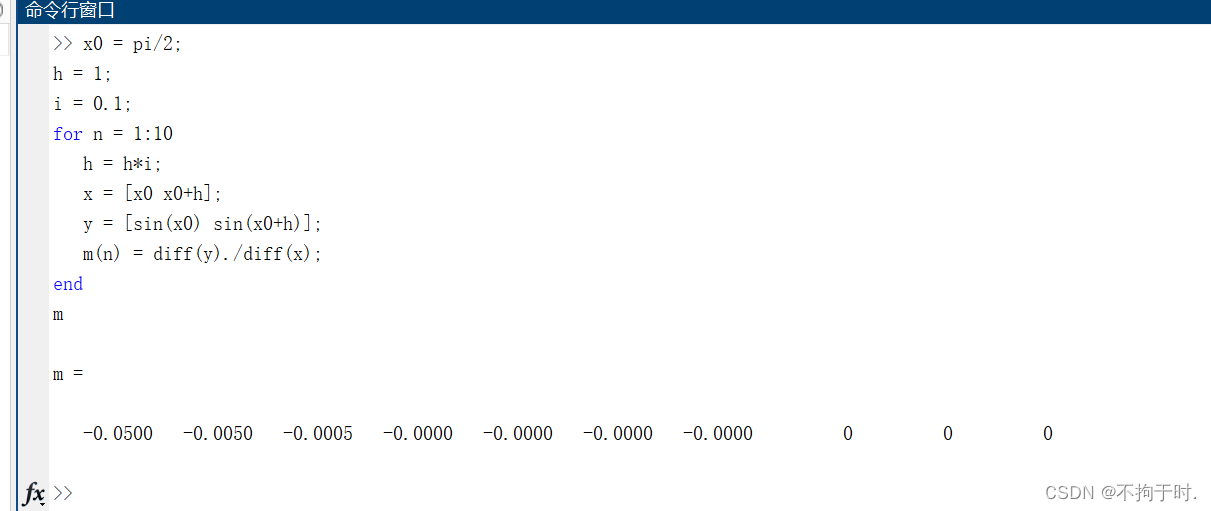
10.计算区间导数

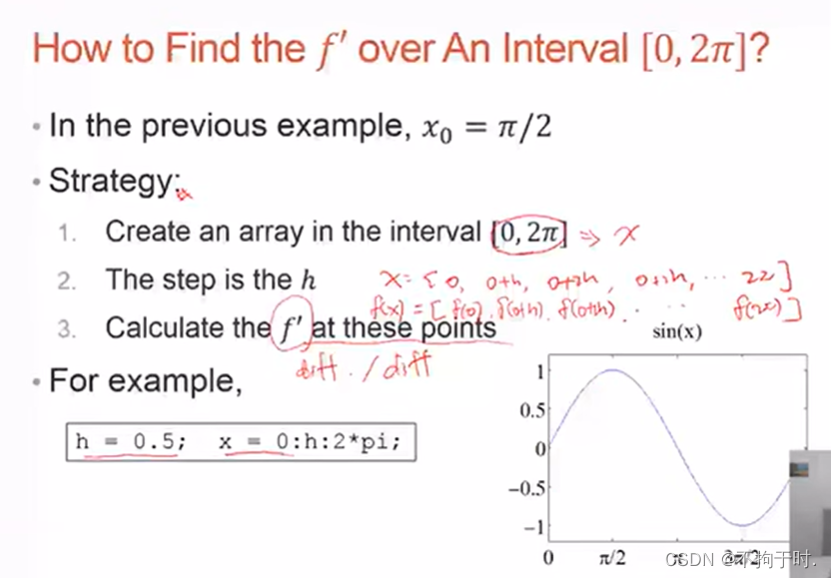
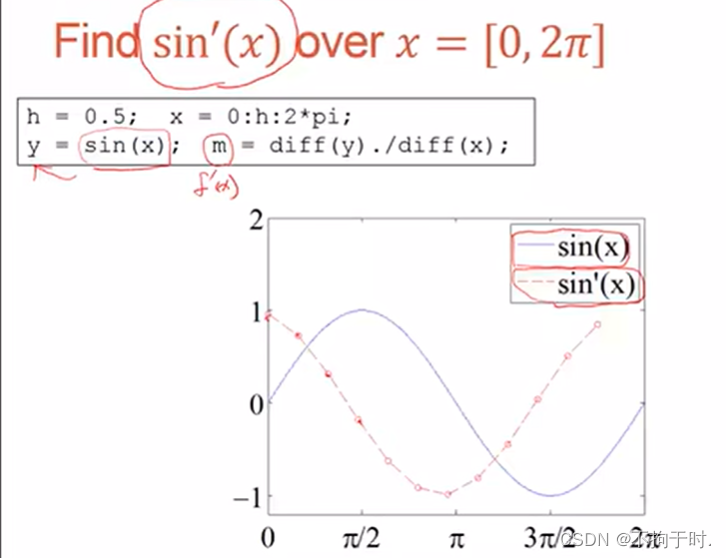
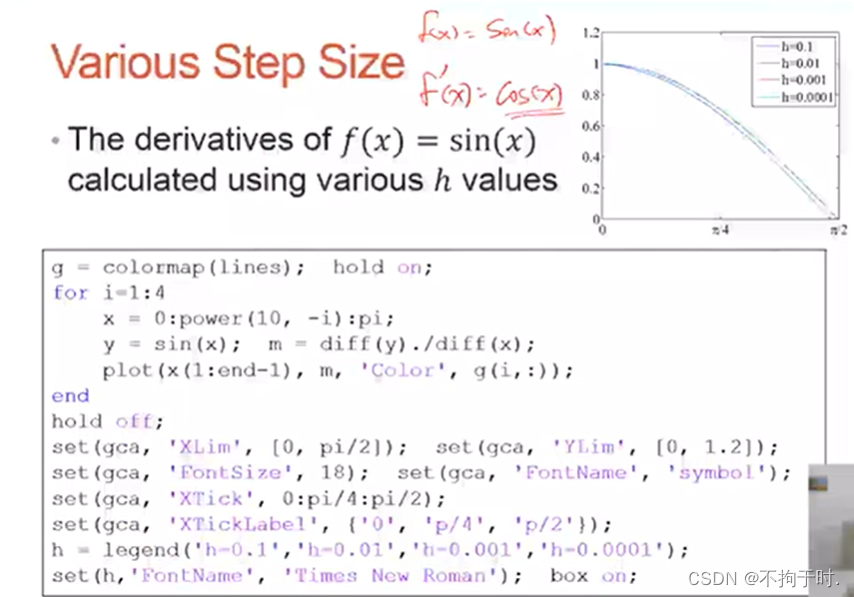
这个代码真的是改了很长时间,有以下需要注意的几个点:①ppt代码没有对h赋值,我对h进行了赋值。②需要把symbol改成Times New Roman,否则坐标轴会显示方块。③把p改成了π。
g = colormap(lines); hold on;
for i = 1:4
h = power(10,-i);
x = 0:h:pi;
y = sin(x); m = diff(y)./diff(x);
plot(x(1:end-1), m, 'Color',g(i,:));
end
hold off;
set(gca, 'XLim', [0, pi/2]); set(gca, 'YLim', [0, 1.2]);
set(gca, 'FontSize', 18); set(gca, 'FontName', 'Times New Roman');
set(gca, 'XTick', 0:pi/4:pi/2);
set(gca, 'XTickLabel', {'0', 'π/4', 'π/2'});
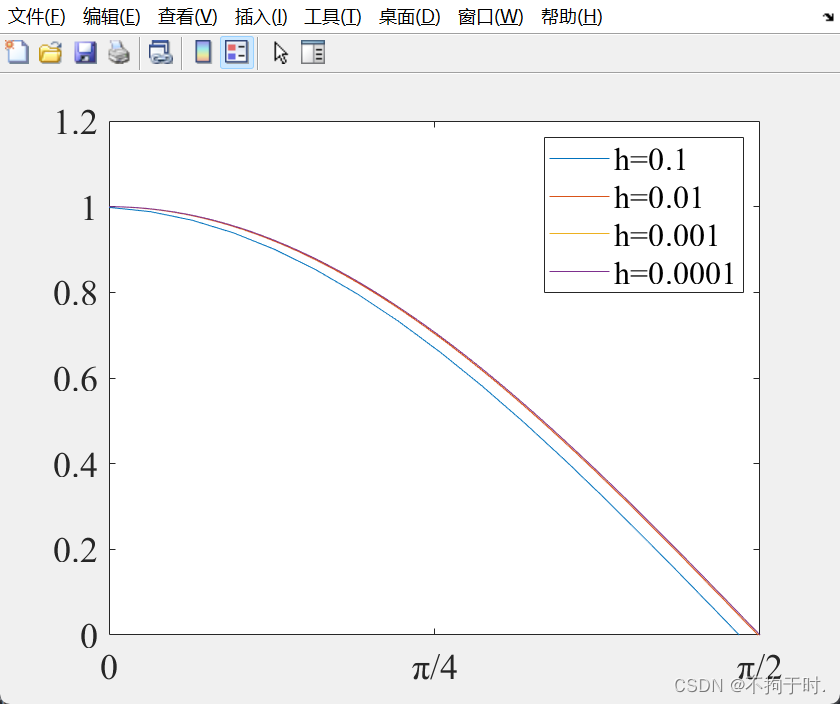
h = legend('h=0.1','h=0.01','h=0.001', 'h=0.0001');
set(h, 'FontName', 'Times New Roman'); box on;这个时候看起来是只有2条线,我们把它放大看看~
其实它是四条线哦。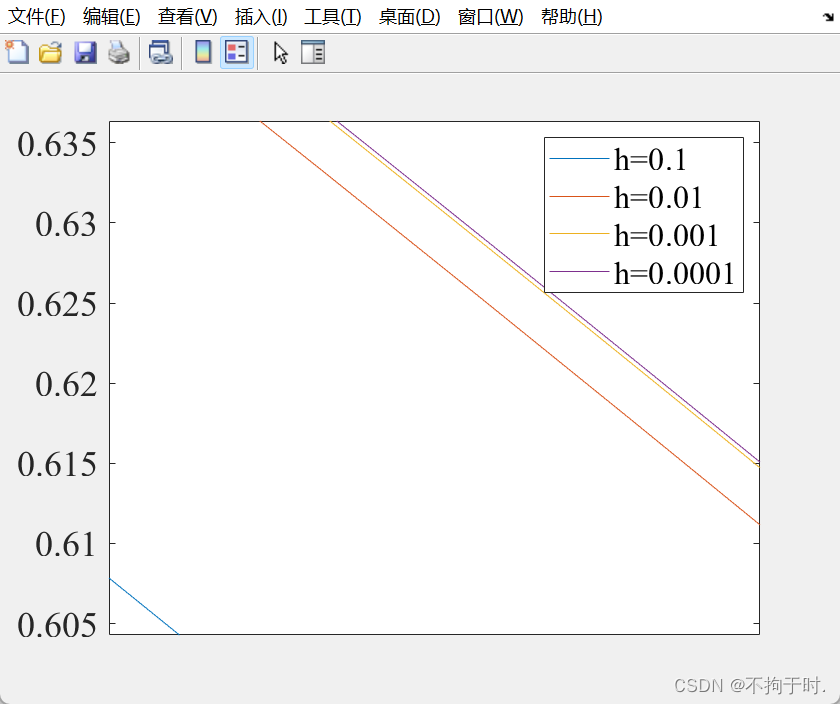
11.不同h求导练习
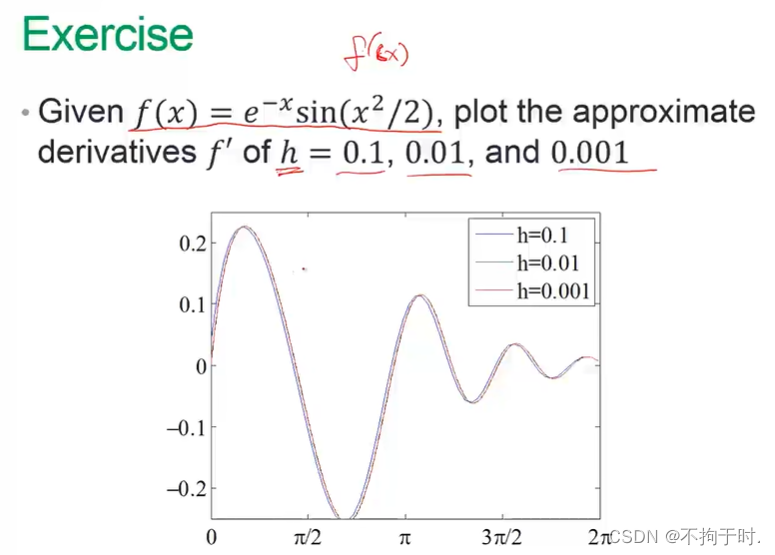
g = colormap(lines);
hold on;
for i =1:3
    h = power(10,-i);
    x = 0:h:2*pi;
    y = exp(-x).*(sin(x.^2./2));
    m = diff(y)./diff(x);
    plot(x(1:end-1), m, 'Color',g(i,:));
end
hold off;
legend('h=0.1','h=0.01','h=0.001');
set(gca, 'XLim', [0, 2*pi]); set(gca, 'YLim', [-0.25, 0.25]);
set(gca, 'FontSize', 18); set(gca, 'FontName', 'Times New Roman');
set(gca, 'YTickLabel', {'-0.2', '-0.1', '0','0.1', '0.2'});
set(gca, 'XTick', 0:pi/2:2*pi);
set(gca, 'XTickLabel', {'0', 'π/2', 'π','3π/2', '2π'});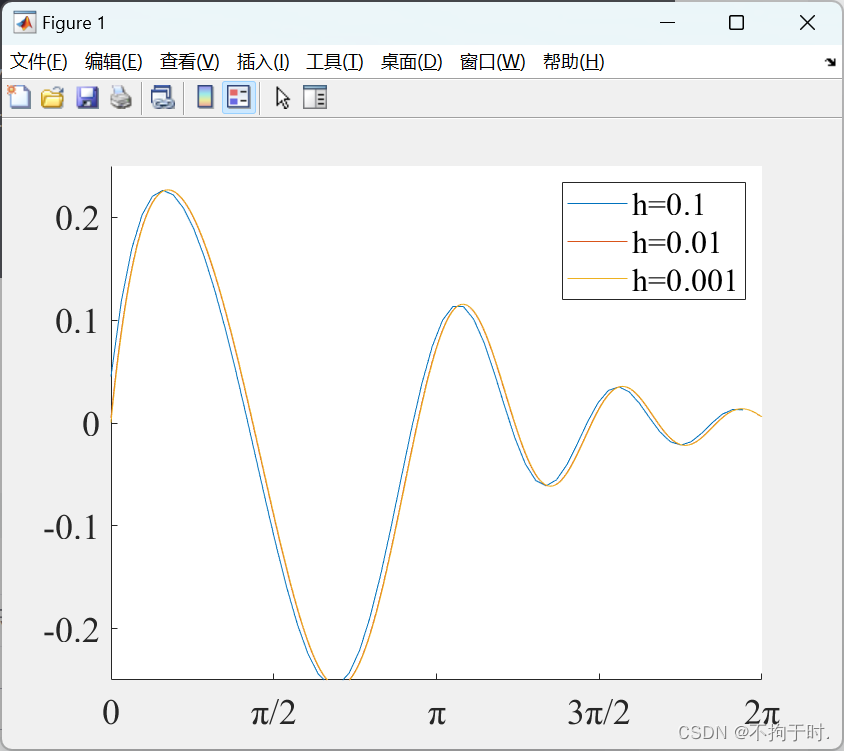
12.二次三次微分
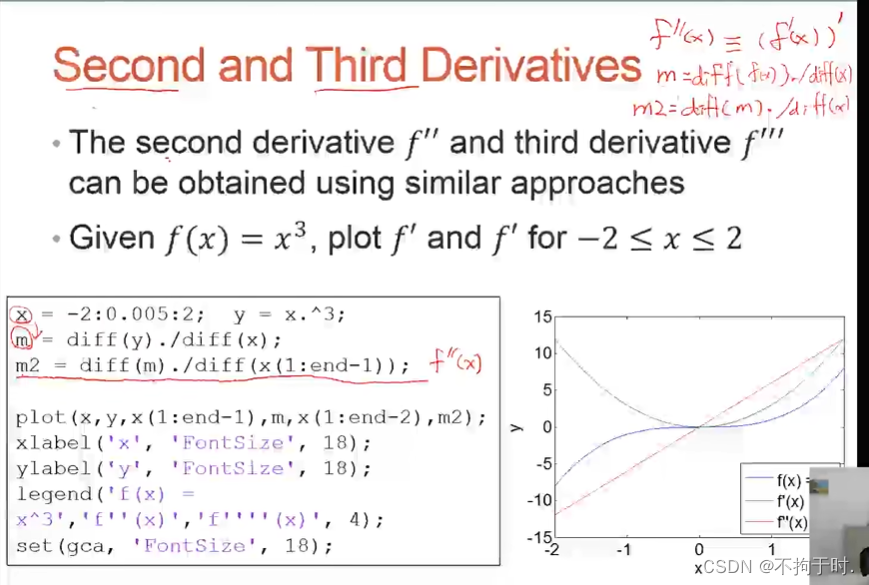
注意:①每多一次求导,x值就减-1,②在图例中显示‘,需要写两个’‘。
 x = -2:0.005:2;
y = x.^3;
m = diff(y)./diff(x);
m2 = diff(m)./diff(x(1:end-1));
plot(x,y,x(1:end-1),m,x(1:end-2),m2);
xlabel('x', 'FontSize', 18);
ylabel('Y', 'FontSize', 18);
legend('f(x)=x^3','f''(x)','f''''(x)');
set(gca,'FontSize',18);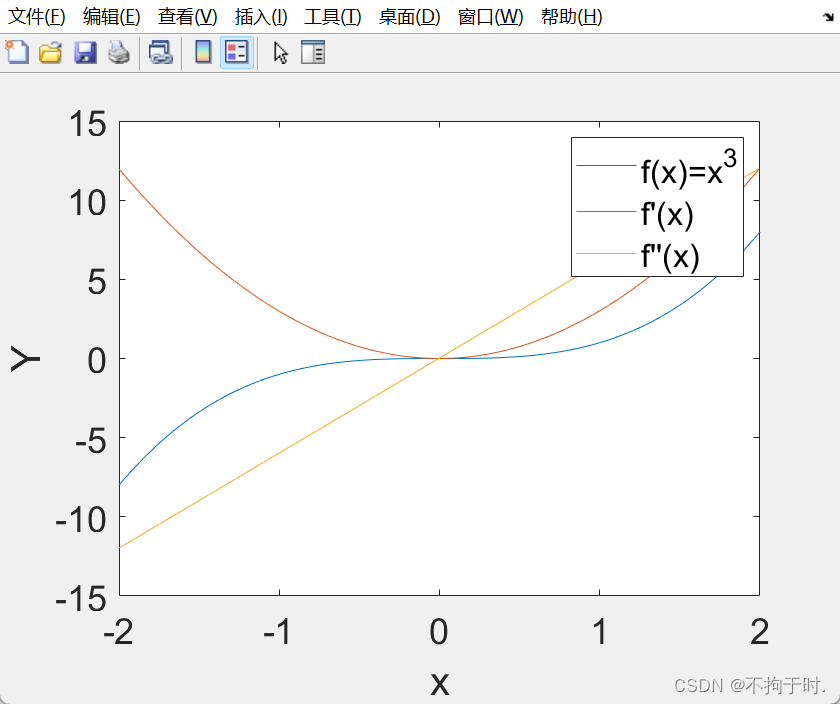
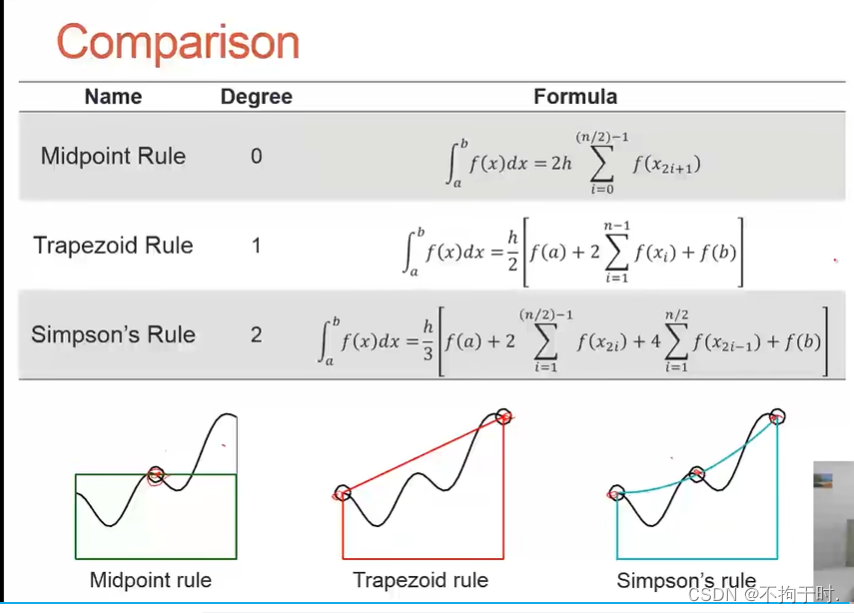
13.数值积分
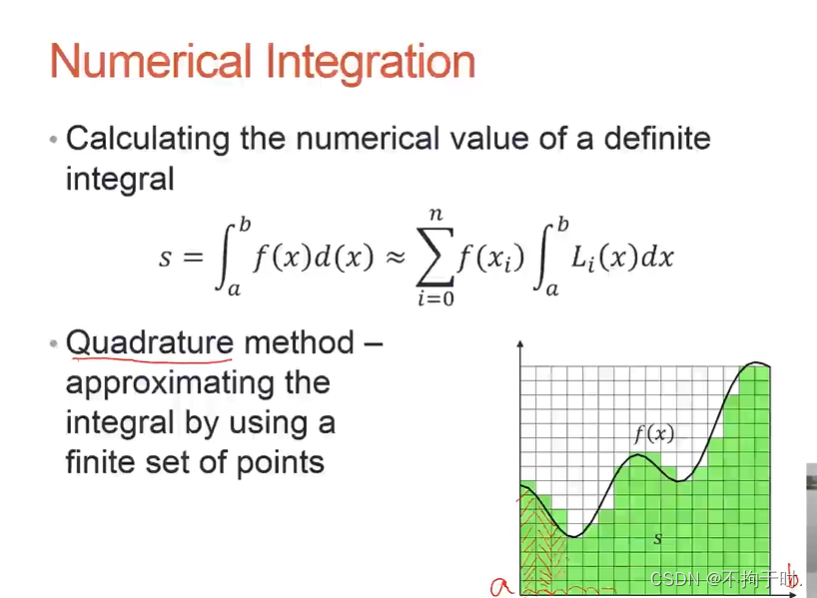
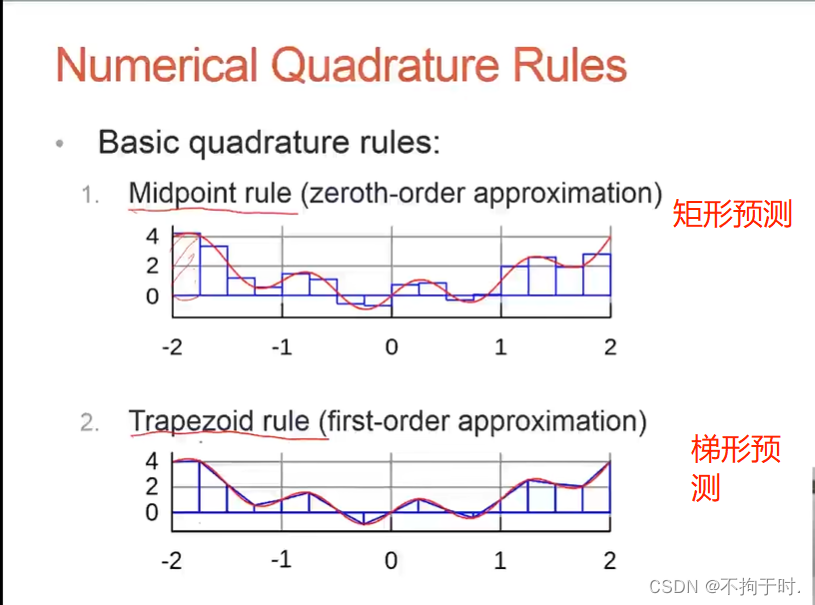
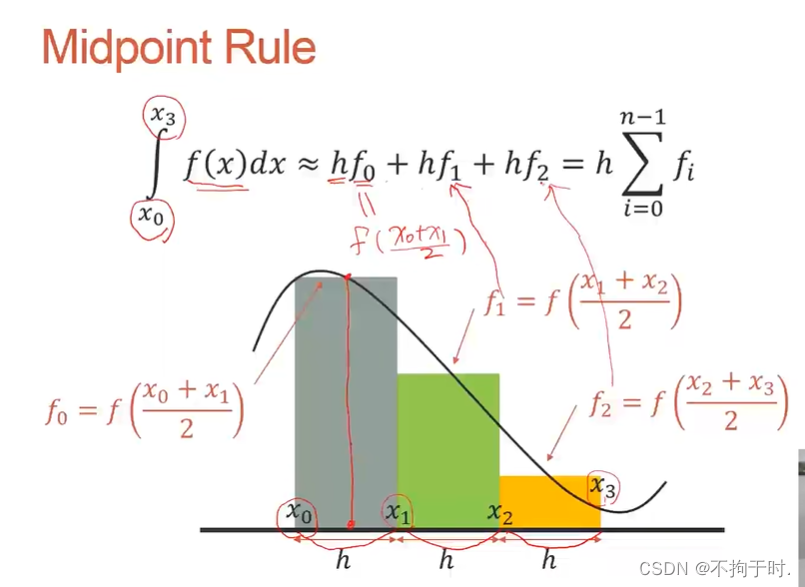
midpoint计算矩形大小,先用f(x0+x1/2)计算高再乘以长。
14.midpoint
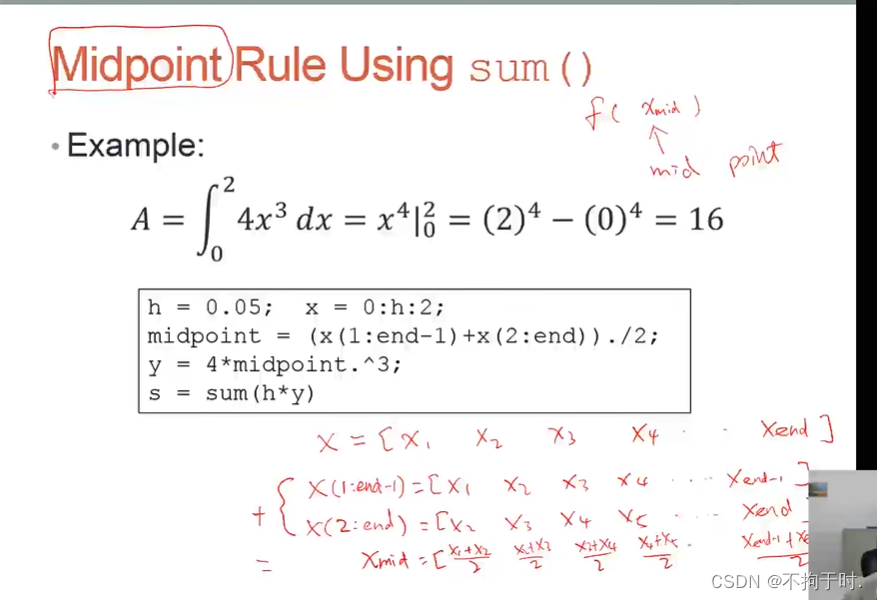
>> h = 0.05; x= 0:h:2;
midpoint = (x(1:end-1)+x(2:end))./2;
y = 4*midpoint.^3;
s = sum(h*y)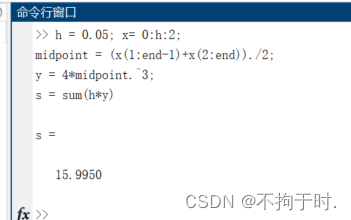
正确答案16,很精确了。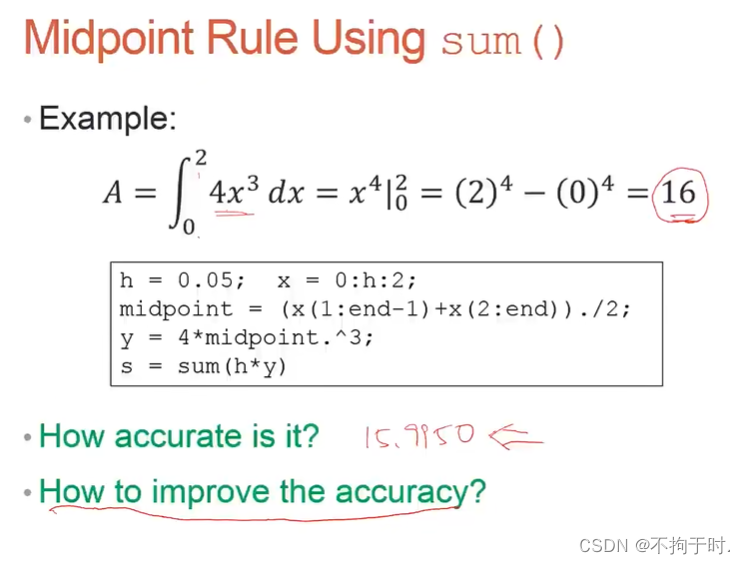
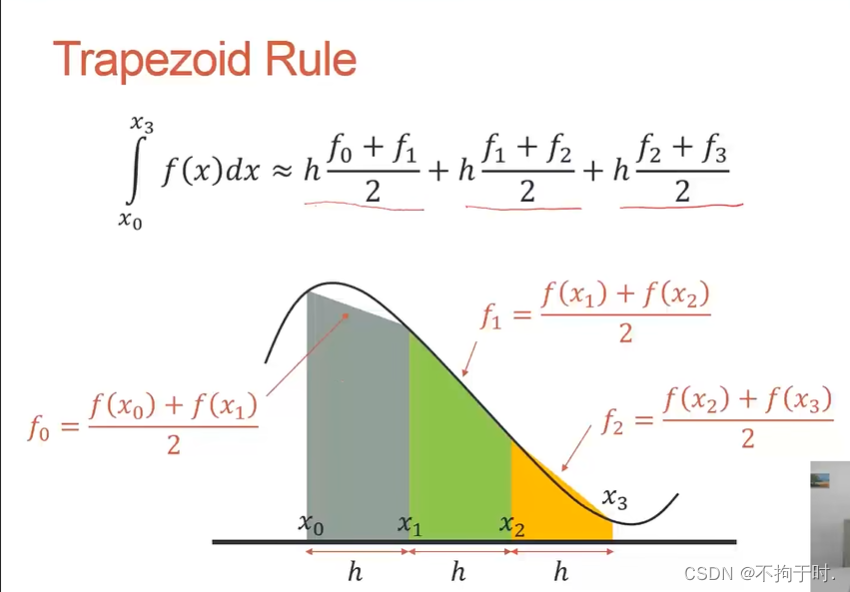
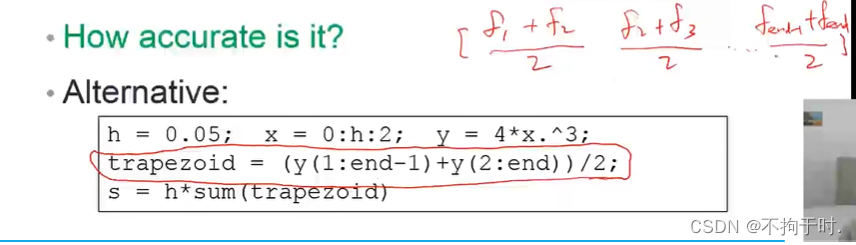
15 trapezoid
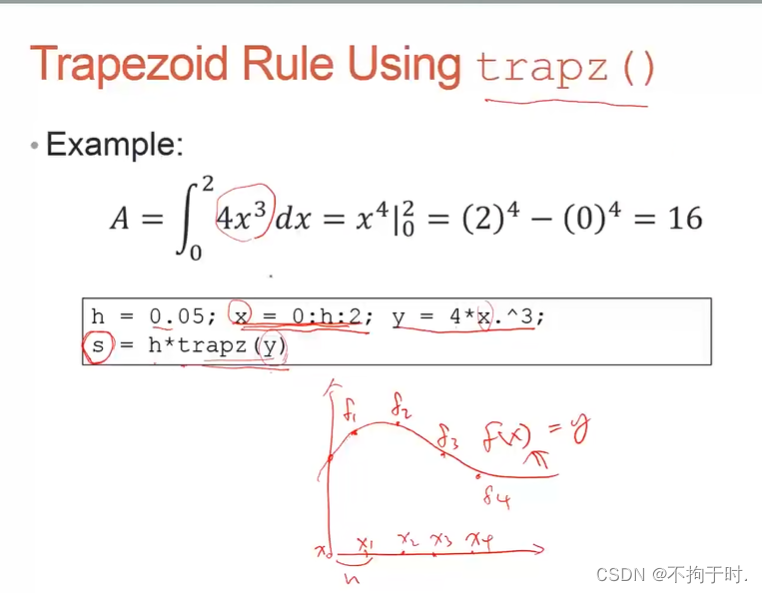
>> h = 0.05; x = 0:h:2; y = 4*x.^3;
s = h*trapz(y)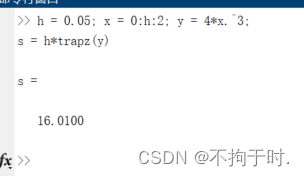
或者这样算
16. 1/3Simpson’s
一次性计算两个方块面积,公式如下图所示
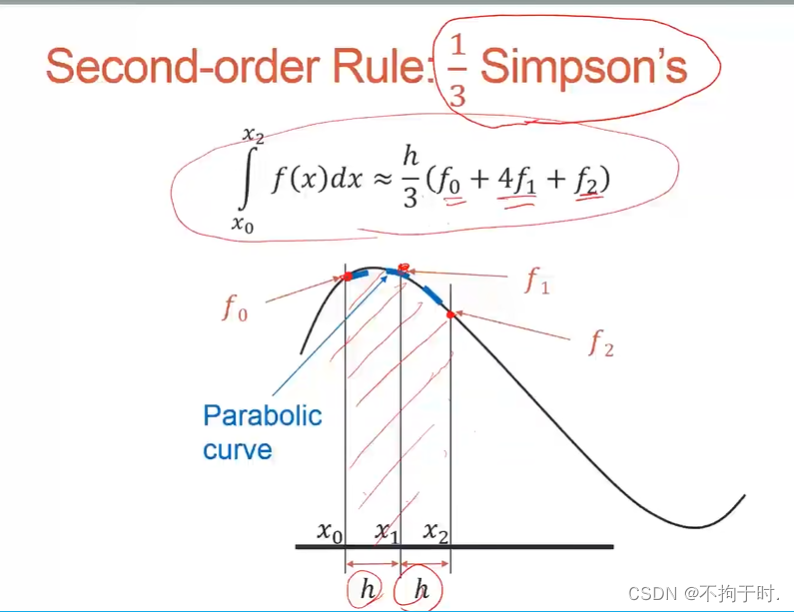
这个方法要自己算,系数是复化辛普森公式,系数是12421(最后一个2被省略)
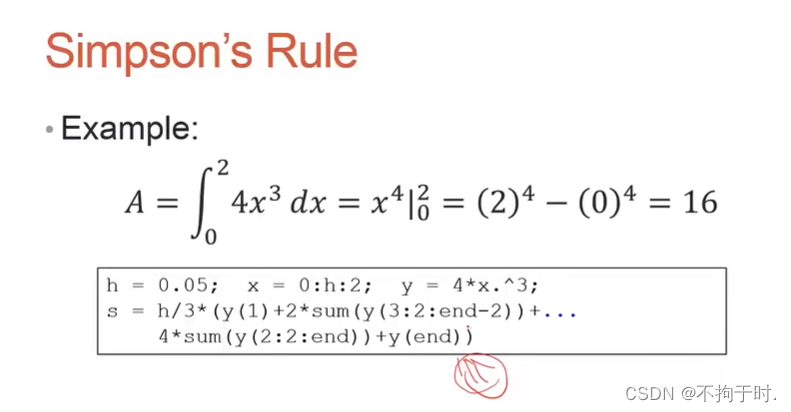
可以看到辛普森公式就很精准了。
h = 0.05; x = 0:h:2; y = 4*x.^3;
s = h/3*(y(1)+2*sum(y(3:2:end-2))+...
4*sum(y(2:2:end))+y(end)) 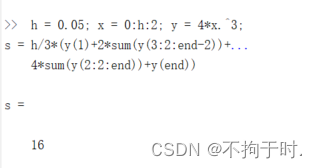
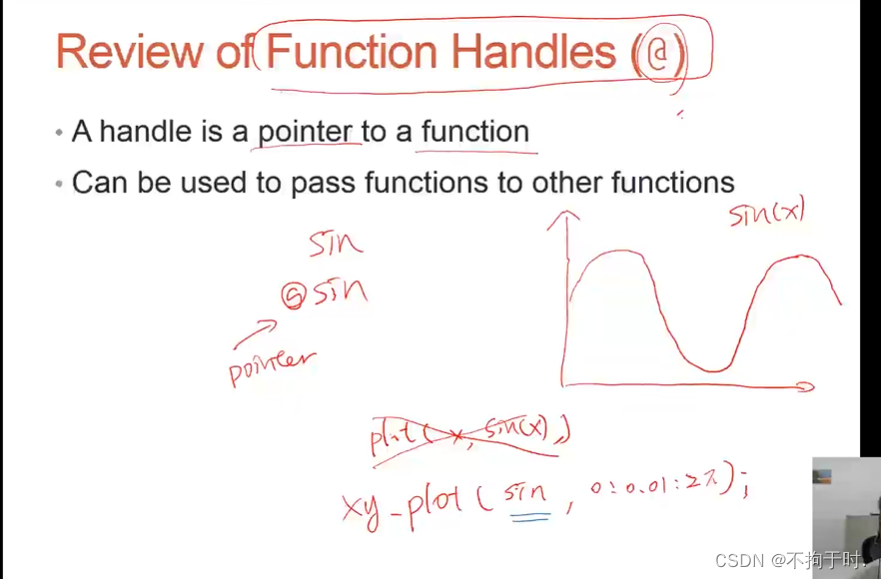
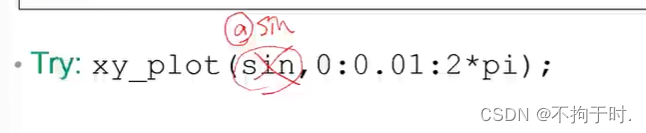
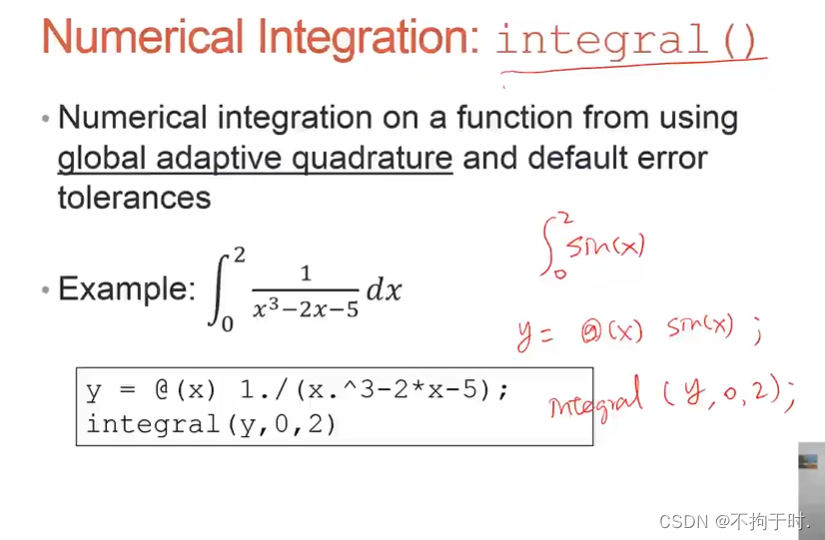
17. 利用matlab内置函数做数值积分
如果给出x范围要用@
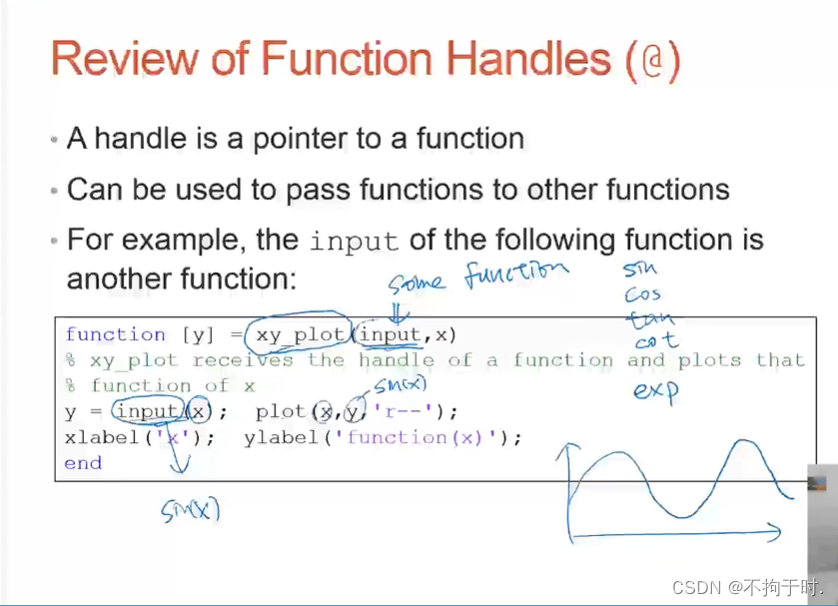
function [y] = xy_plot(input,x)
y = input(x); plot(x,y,'r--');
xlabel('x'); ylabel('function(x)');
end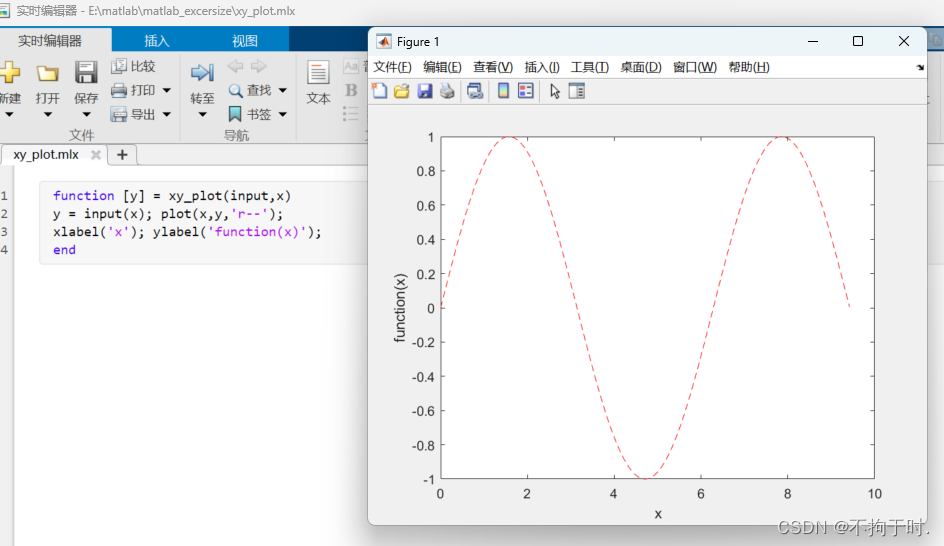
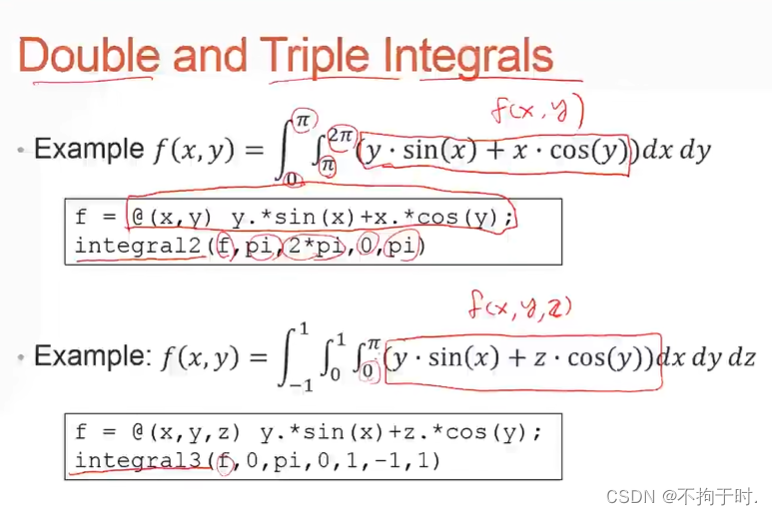
18.numerical integration数值积分
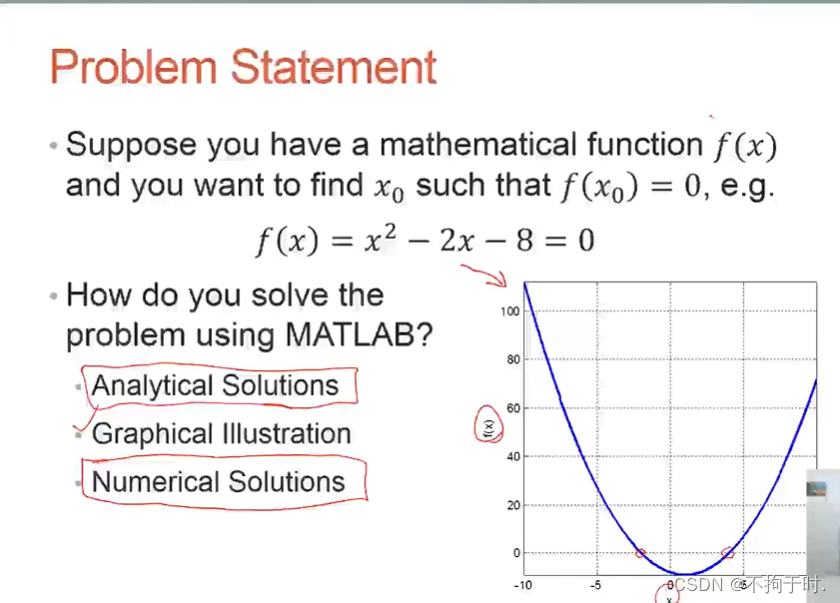
二 方程式求根
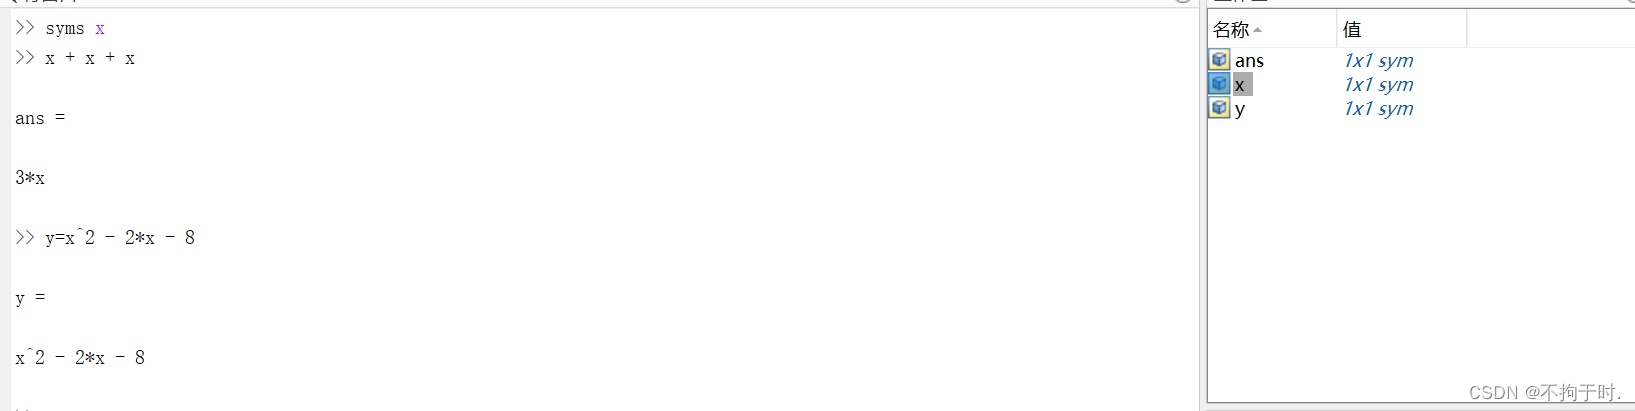
1.symbolic root finding approach
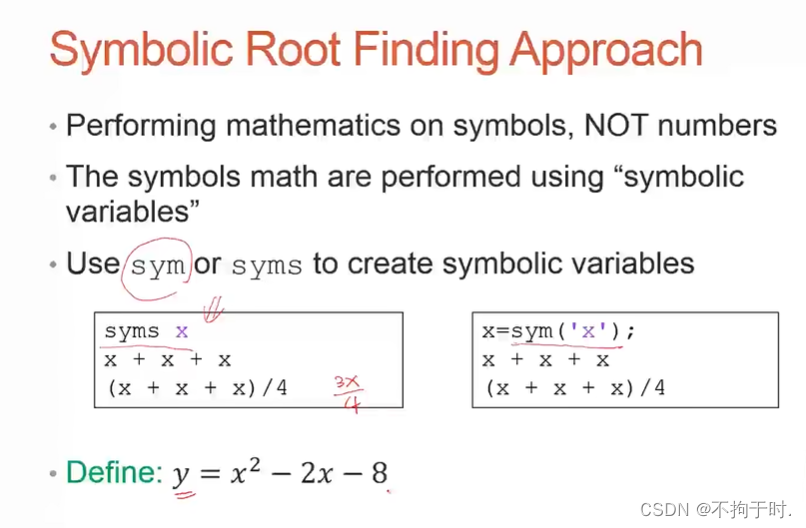
y也会变成符号化
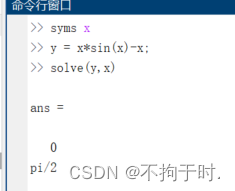
2.solve()
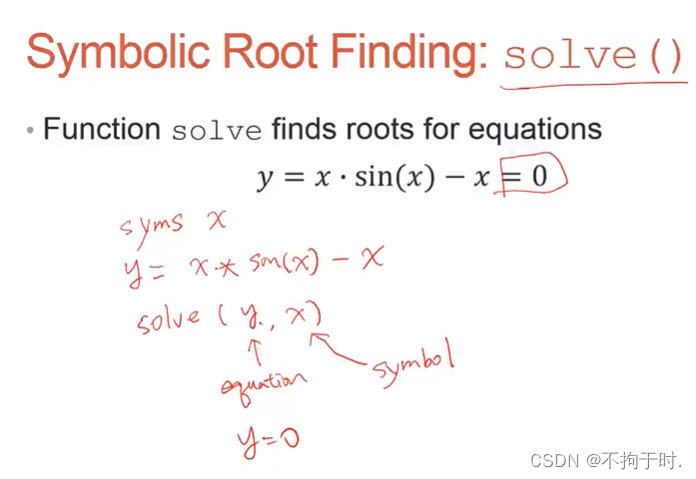
>> syms x
>> y = x*sin(x)-x;
>> solve(y,x)

ans =

   0
pi/2
并且ans也是sym类型
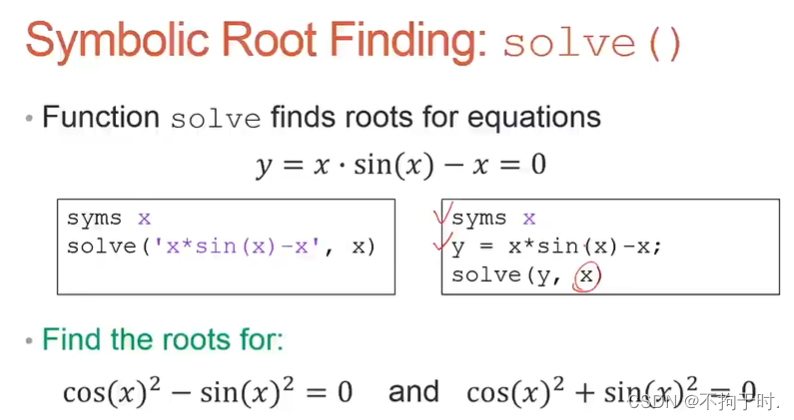
3.求方程跟sin、cos练习
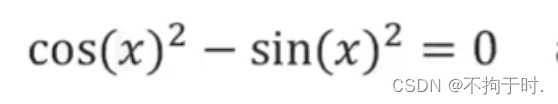
>> syms x;
y = power(cos(x),2)-power(sin(x),2);
solve(y,x)

ans =

pi/4

>> 
>> syms x;
y = power(cos(x),2)+power(sin(x),2);
solve(y,x)

ans =

Empty sym: 0-by-1
4.解决多个方程组
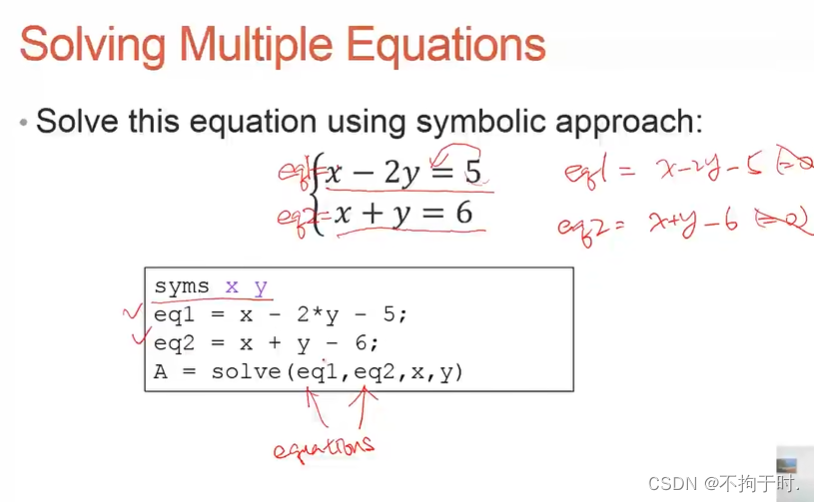
>> syms x y
>> eq1 = x -2*y - 5;
eq2 = x + y -6;
A = solve(eq1,eq2,x,y)
A =
包含以下字段的 struct:
x: 17/3
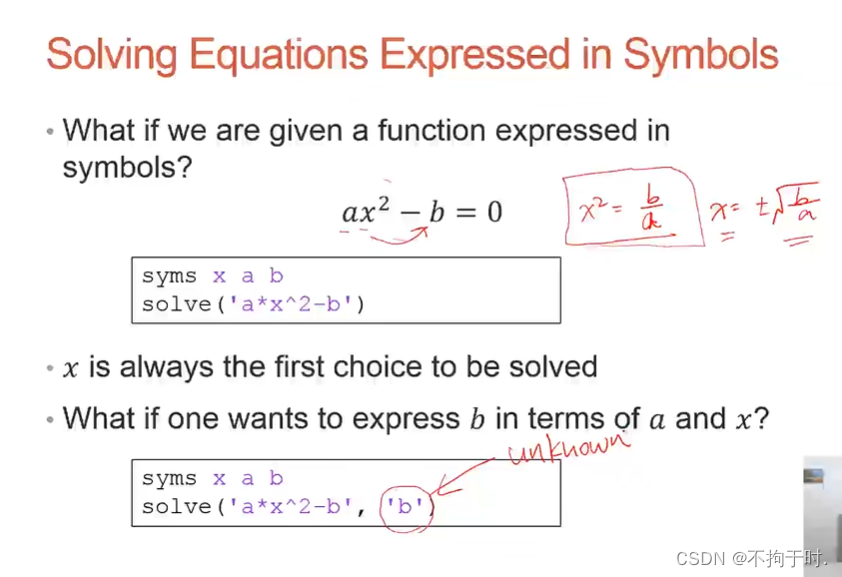
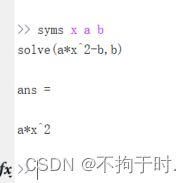
y: 1/35.求解用符号表示的方程

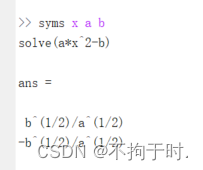
如果把b当成未知数,a和x是已知,需要多写一步。
6.求解方程式矩阵练习
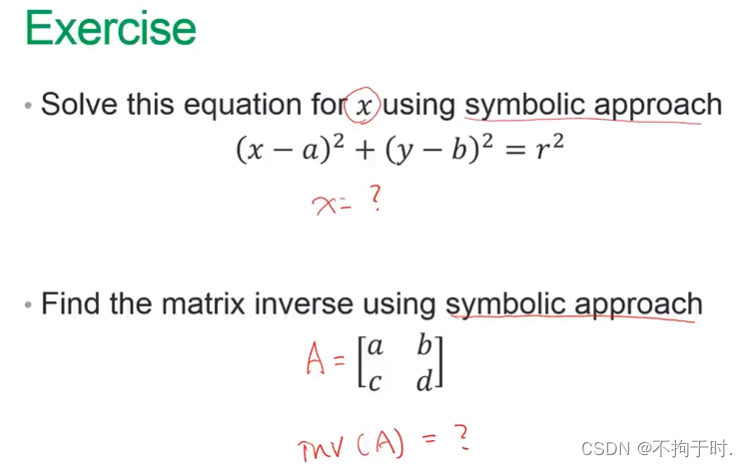
①求解方程式
>> syms x y a b r
>> solve(power(x-a,2)+power(y-b,2)-r^2)

ans =

a + (b + r - y)^(1/2)*(r - b + y)^(1/2)
a - (b + r - y)^(1/2)*(r - b + y)^(1/2)
②求解矩阵
A = [a b; c d]

A =

[a, b]
[c, d]

>> B = inv(A);
disp(B)
[ d/(a*d - b*c), -b/(a*d - b*c)]
[-c/(a*d - b*c),  a/(a*d - b*c)]
7.符号微分
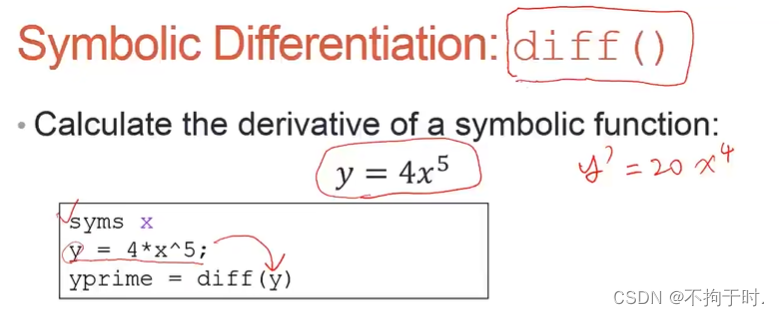
>> syms x
>> y = 4*x^5;
yprime = diff(y)

yprime =

20*x^4
8.符号微分练习
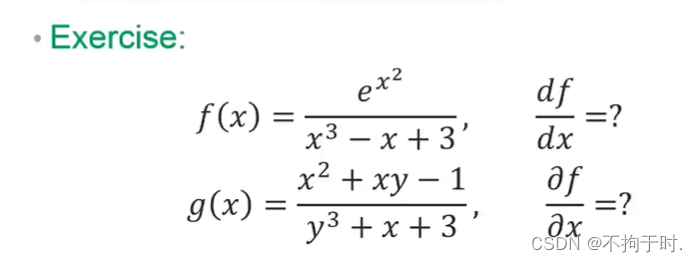
f(x):
>> syms x;
f = exp(x^2)./(x^3-x+3)
fprime = diff(f)

f =

exp(x^2)/(x^3 - x + 3)


fprime =

(2*x*exp(x^2))/(x^3 - x + 3) - (exp(x^2)*(3*x^2 - 1))/(x^3 - x + 3)^2
g(x):
syms x y
g = (x^2+x*y-1)./(y^3+x+3);
diff(g)

ans =

(2*x + y)/(y^3 + x + 3) - (x^2 + y*x - 1)/(y^3 + x + 3)^2
9.符号积分
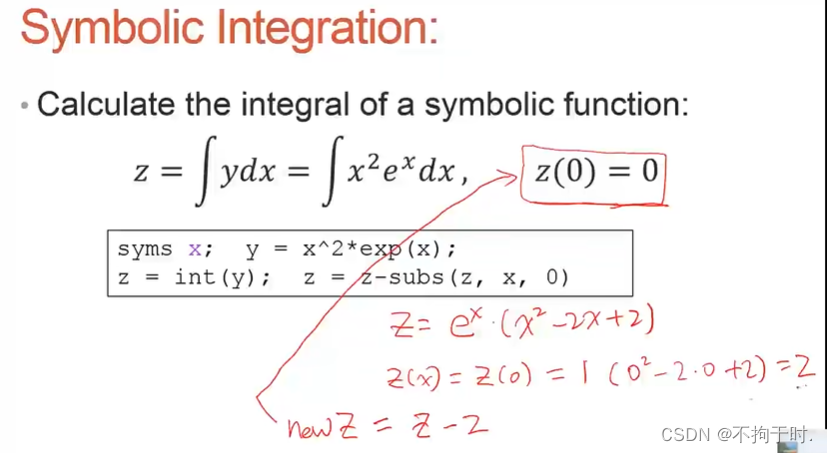
>> syms x;
y = x^2*exp(x);
z = int(y);
z = z-subs(z,x,0)

z =

exp(x)*(x^2 - 2*x + 2) - 2
10.积分练习
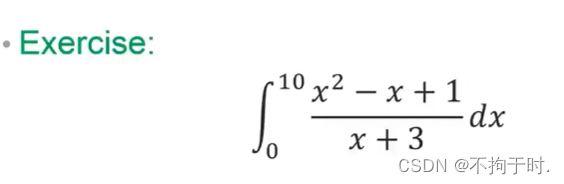
>> y = @(x) (x.^2-x+1)./(x+3); integral(y,0,10)

ans =

   29.0624
11. 符号vs数值
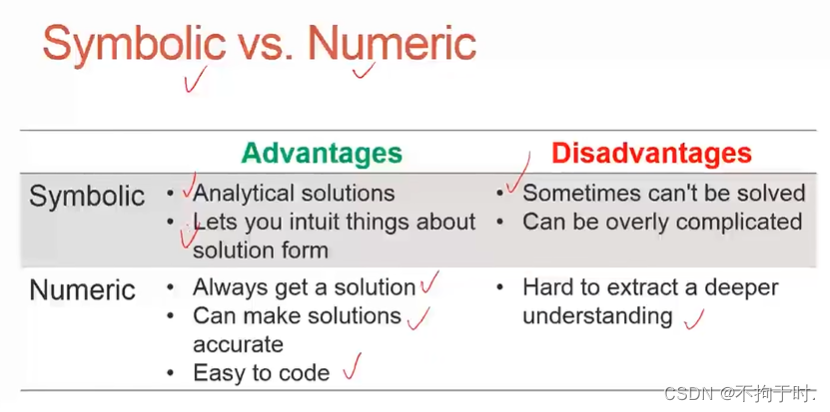
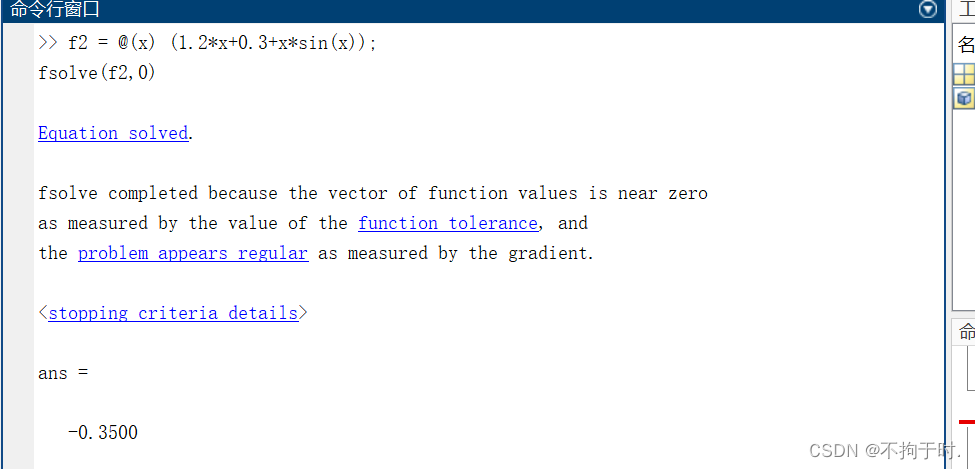
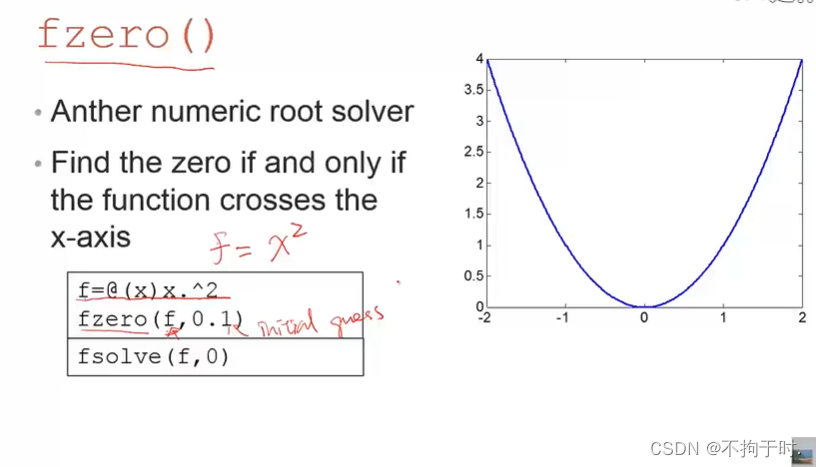
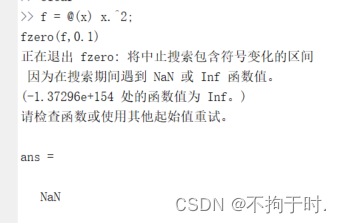
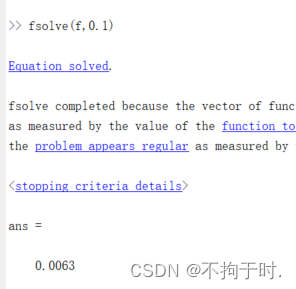
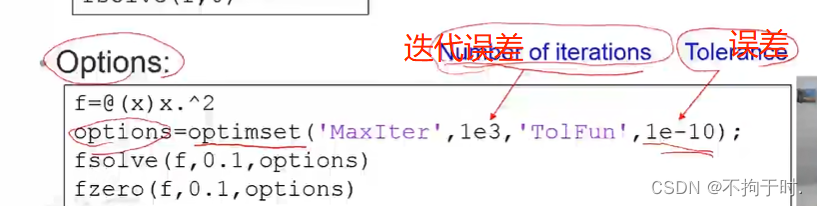
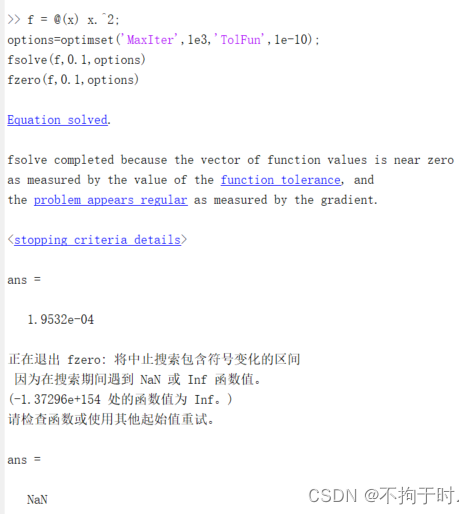
12.fsolve()
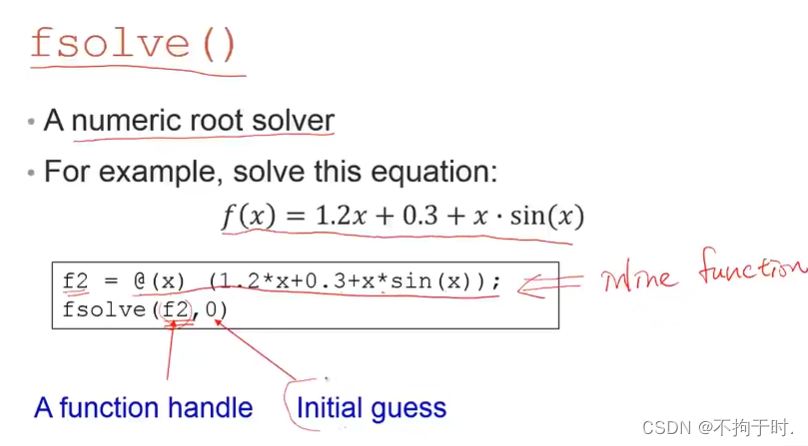
fsolve是将一个公式等于一个数值并求解x的值
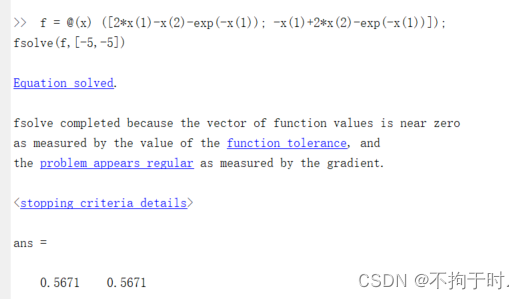
13.求解二元一次方程组练习
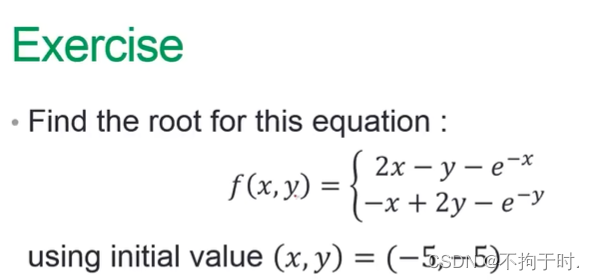
注意:①solve只能有一个变量,可以把xy看作x1x2,②fsolve的初始值用矩阵形式表示。
14.zero
用zero求解时一定要有零点
15.root
root只能求解数值
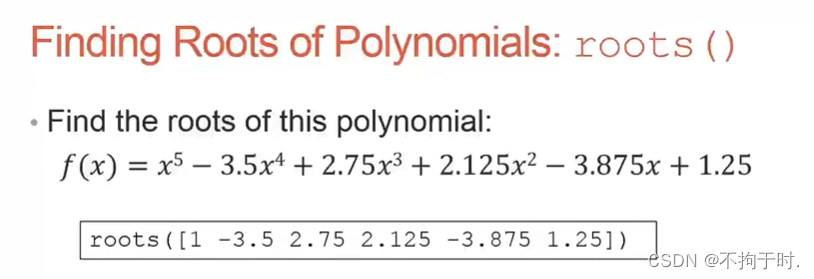
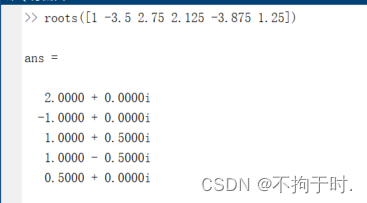
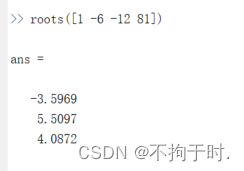
16.root练习

17. solvers find roots
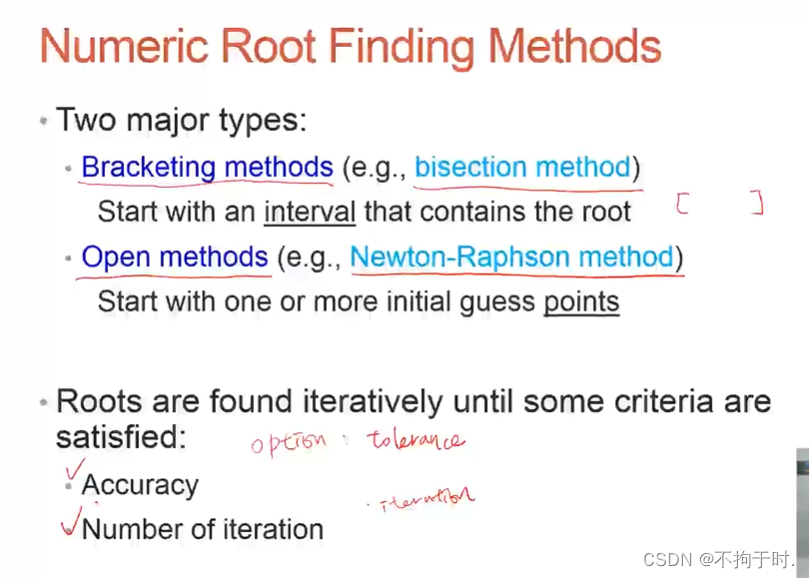
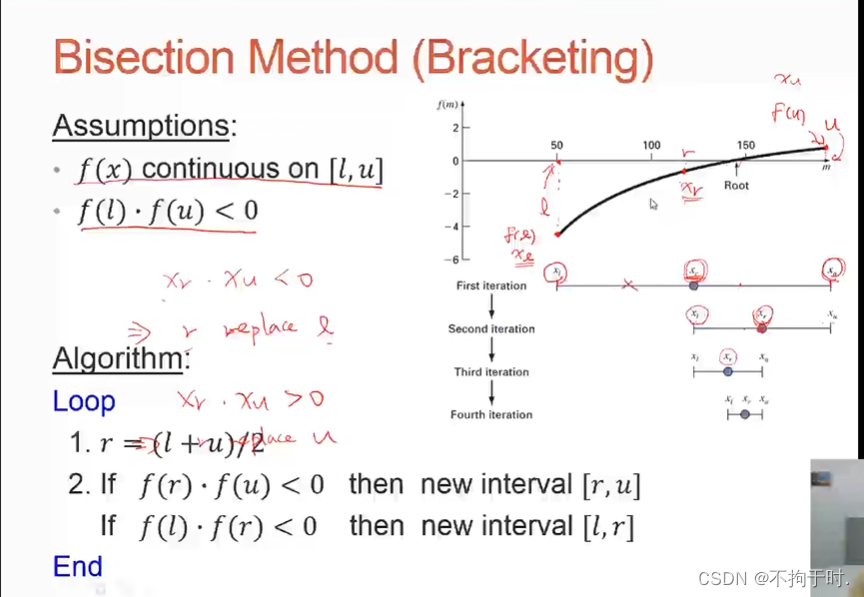
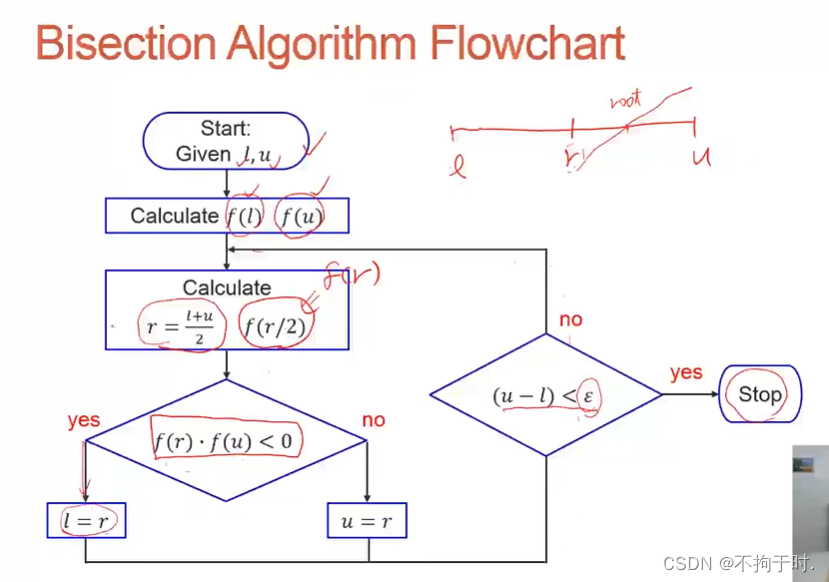
18. Bisection Method 二分法
逐渐缩小区间,两点相乘小于0
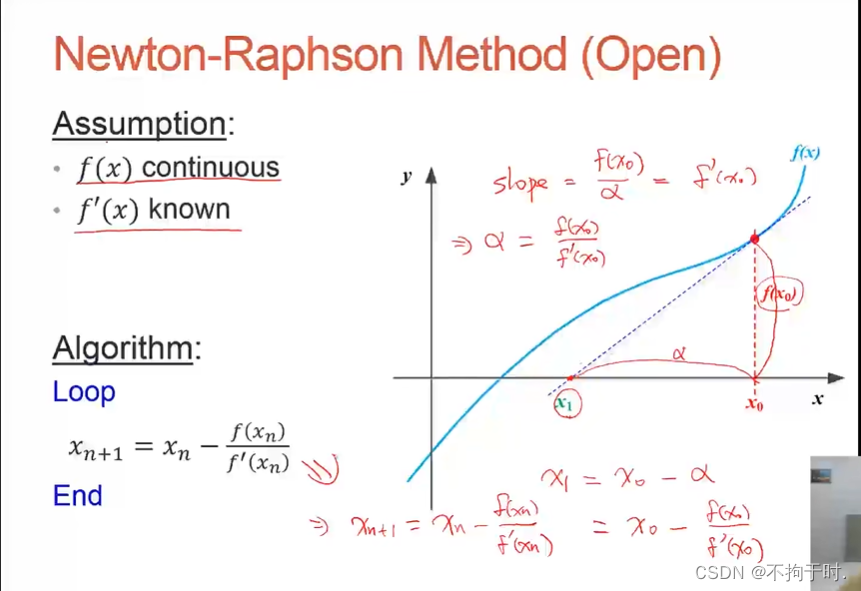
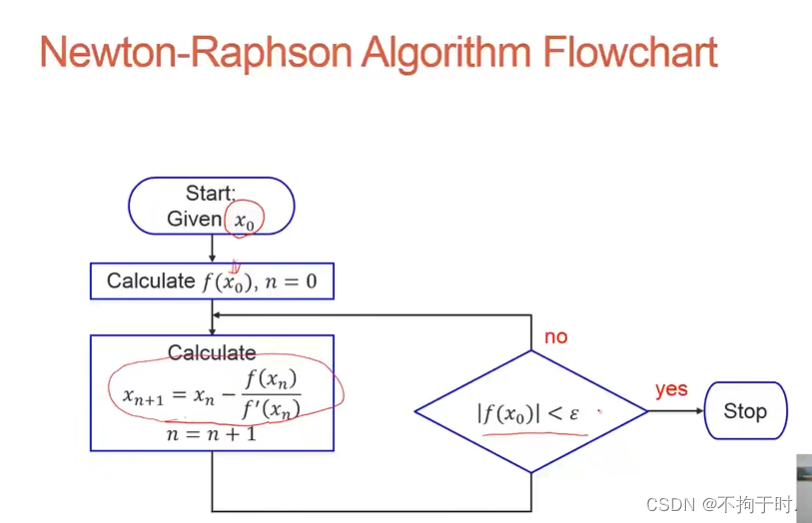
19.Newton-Raphson Method
先找初始点斜率,再找和x轴相交点,反复迭代。函数连续,微分已知。
20. 二分法vs牛顿法
二分法一定要在一个区间里面,牛顿法块但是可能不收敛需要微分。
21. 递归函数
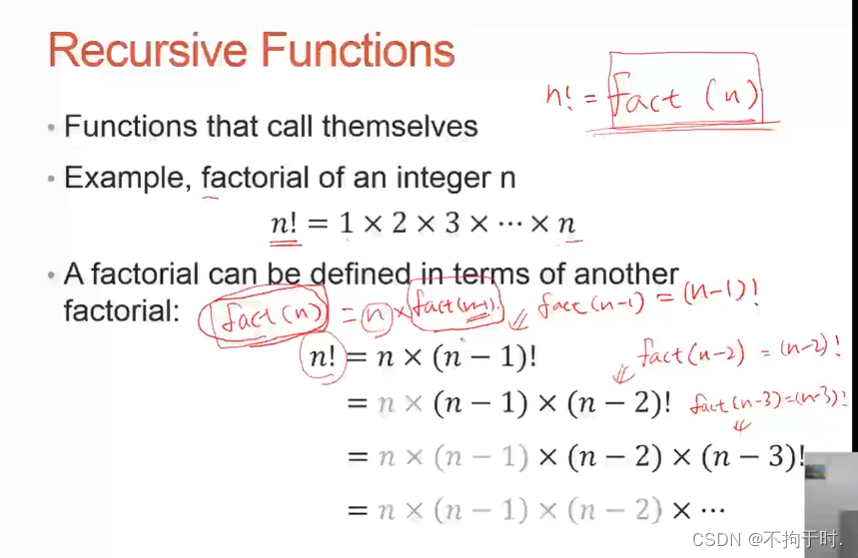
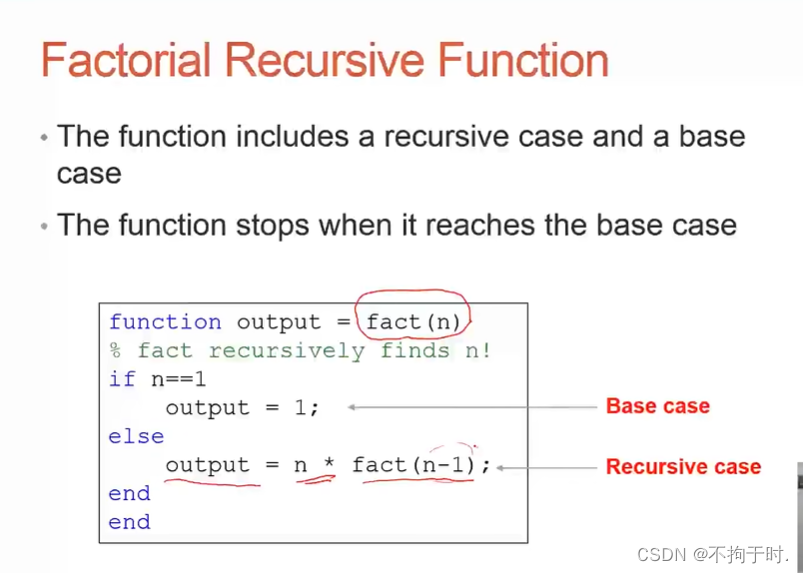
 function output = face(n)
 if n==1
    output = 1;
 else
    output = n* fact(n-1);
end
end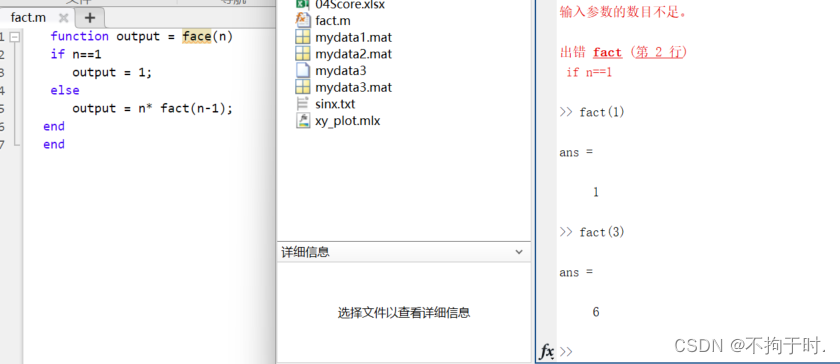
三 线性方程式与线性系统
由于前34分钟的内容主要用来了解,因此从35分钟开始记笔记。
1. 矩阵左除
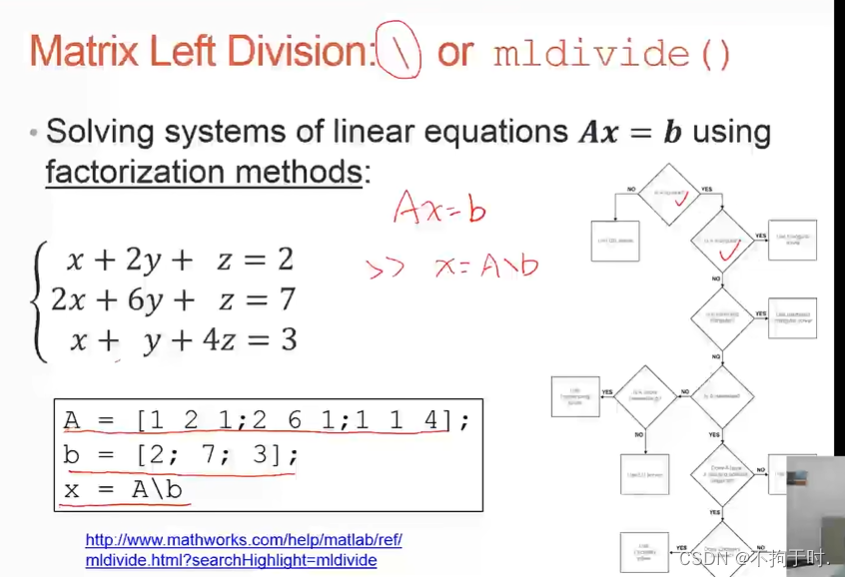
>> A = [1 2 1;2 6 1;1 1 4];
b = [2; 7; 3];
x = A\b
x =
-3.0000
2.0000
1.0000
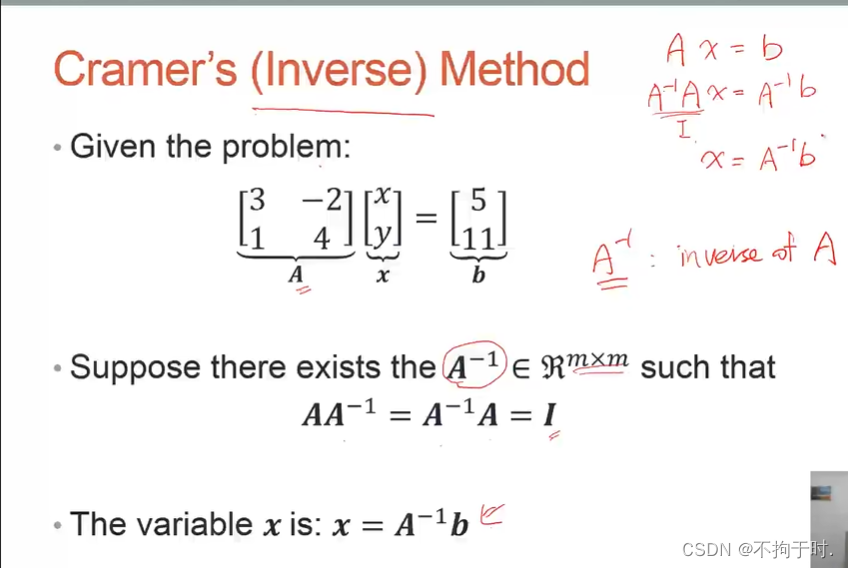
>> 2.cramer's method
3.线性部分就直接跳过了!
四 统计
1.总结方法
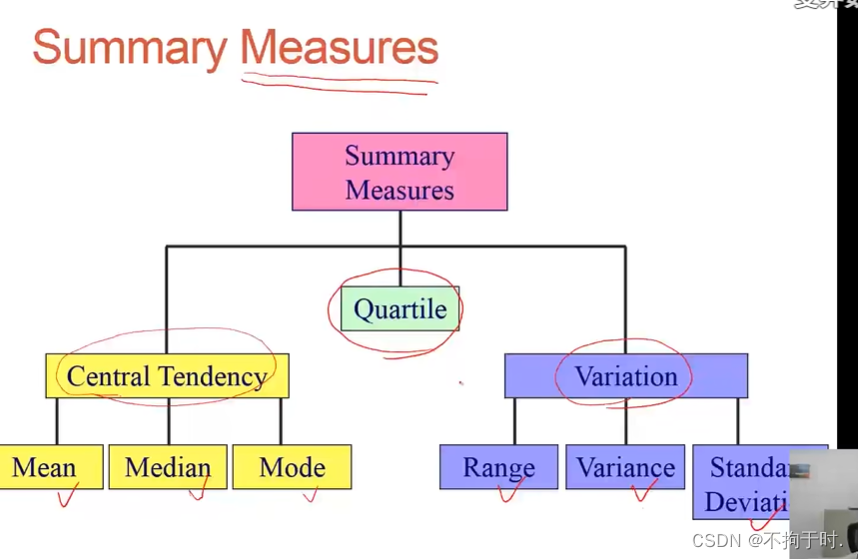
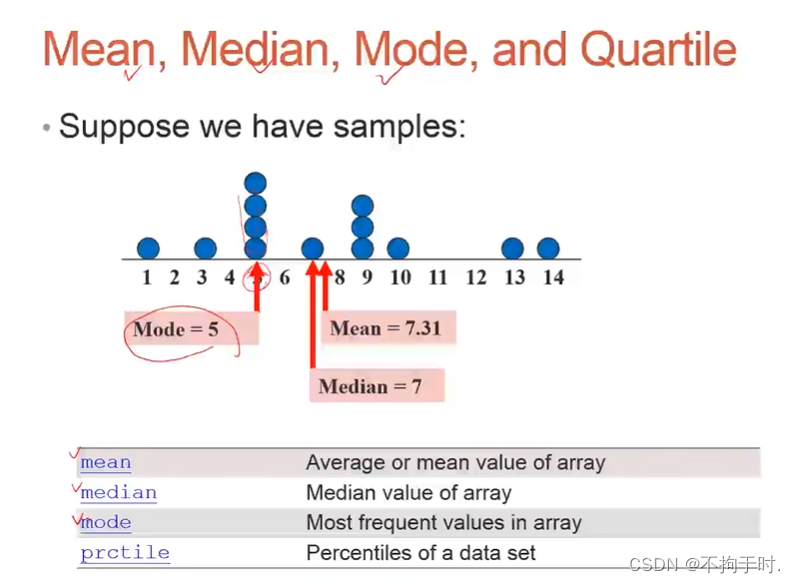
2.mean median mode quartile平均中位众四等分点的值
3. range and interquartile range
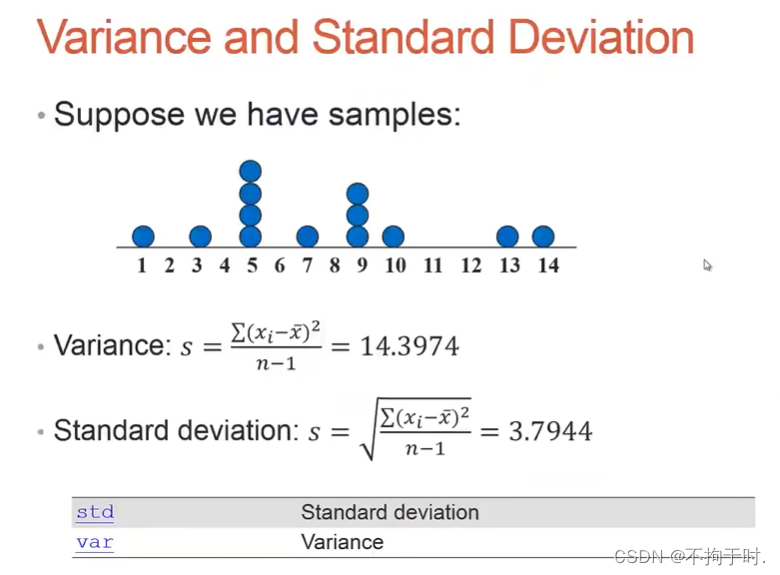
4. 方差标准差
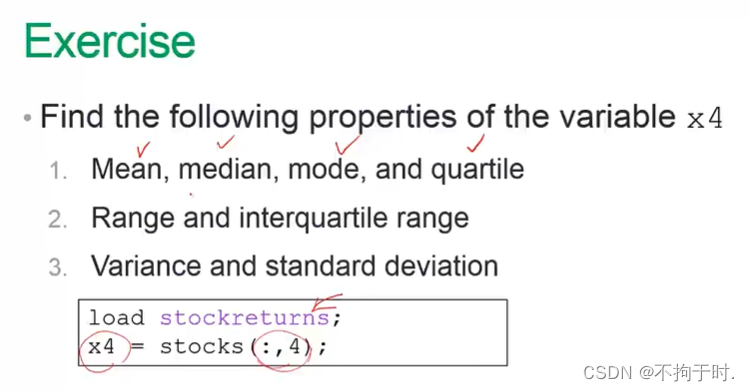
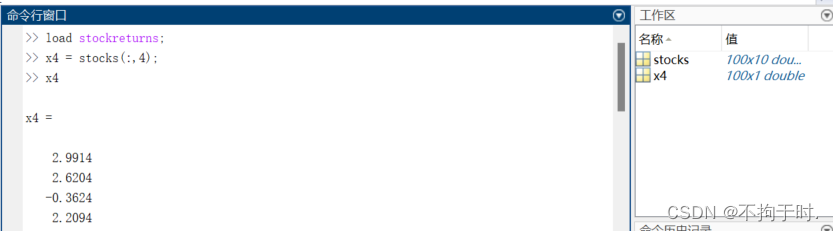
5.股票练习
:4是提取第四列
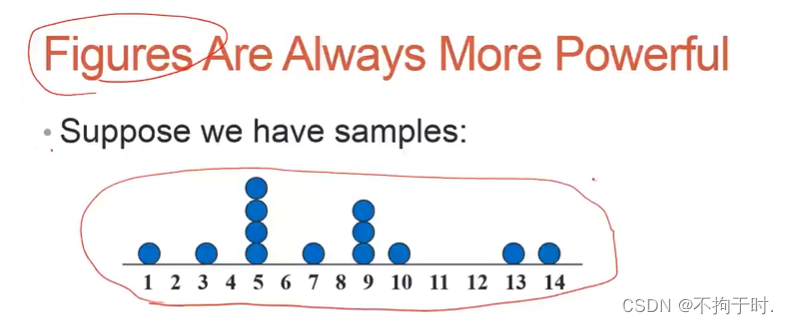
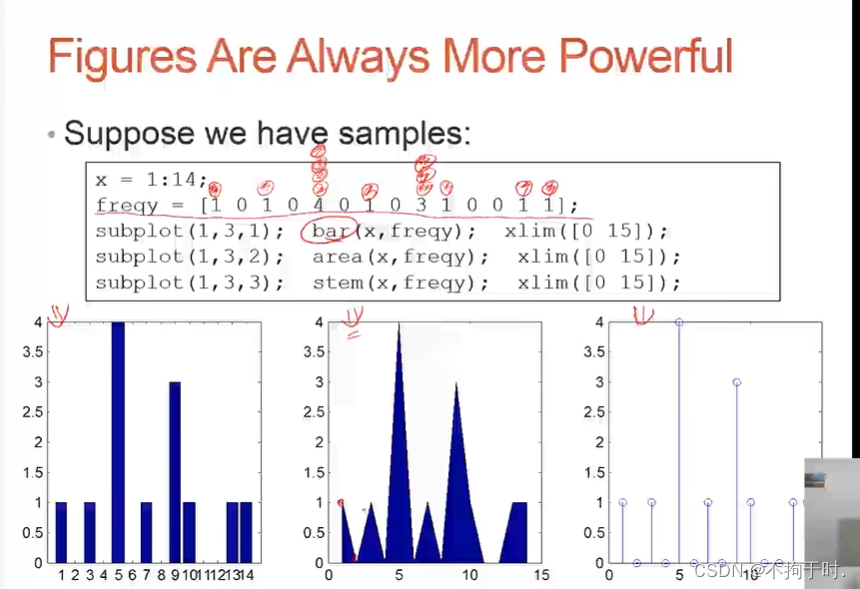
6.figures are always more powerful(图表描述)
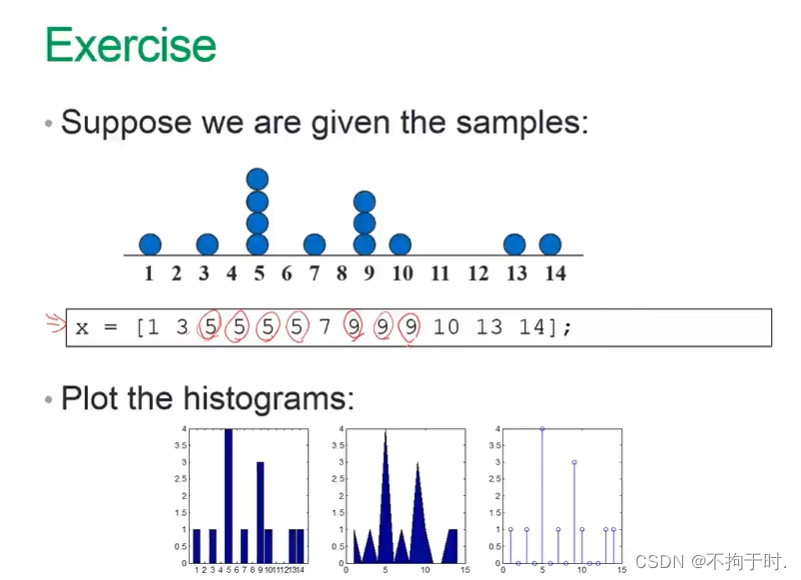
7.画图练习
与上面不同的是练习是给出了哪个点有球,而不是每个点球的数量。
x = 1:14;
freqy = zeros(1,14);
value = [1 3 5 5 5 5 7 9 9 9 10 13 14];
a = length(value);
for j = 1:14;
   for i=1:a;
        if value(i)==j;
             freqy(j)=freqy(j)+1;
        end
end
end
>> subplot(1,3,1); bar(x,freqy); xlim([0 15]);
 subplot(1,3,2); area(x,freqy); xlim([0 15]);
 subplot(1,3,3); stem(x,freqy); xlim([0 15]);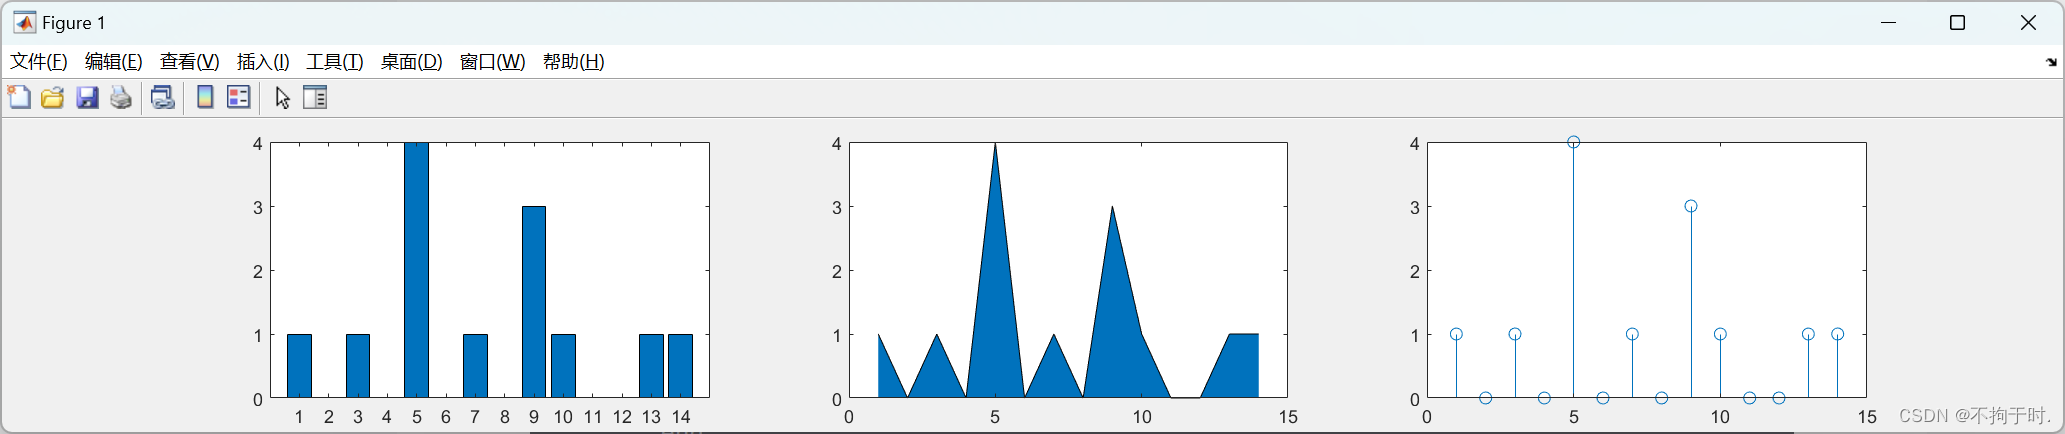
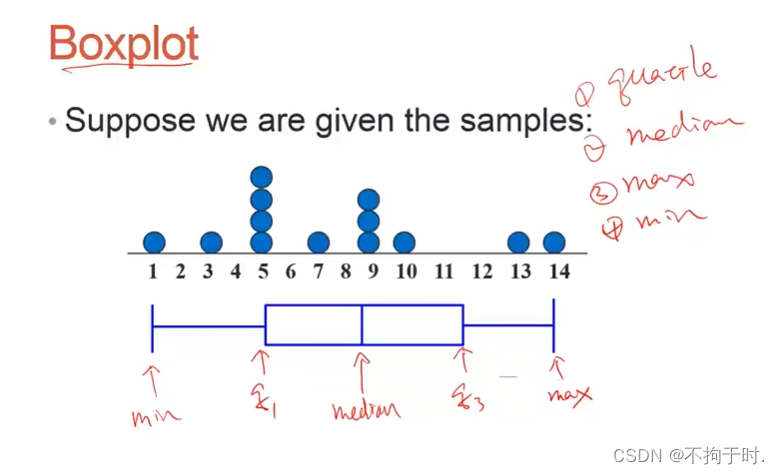
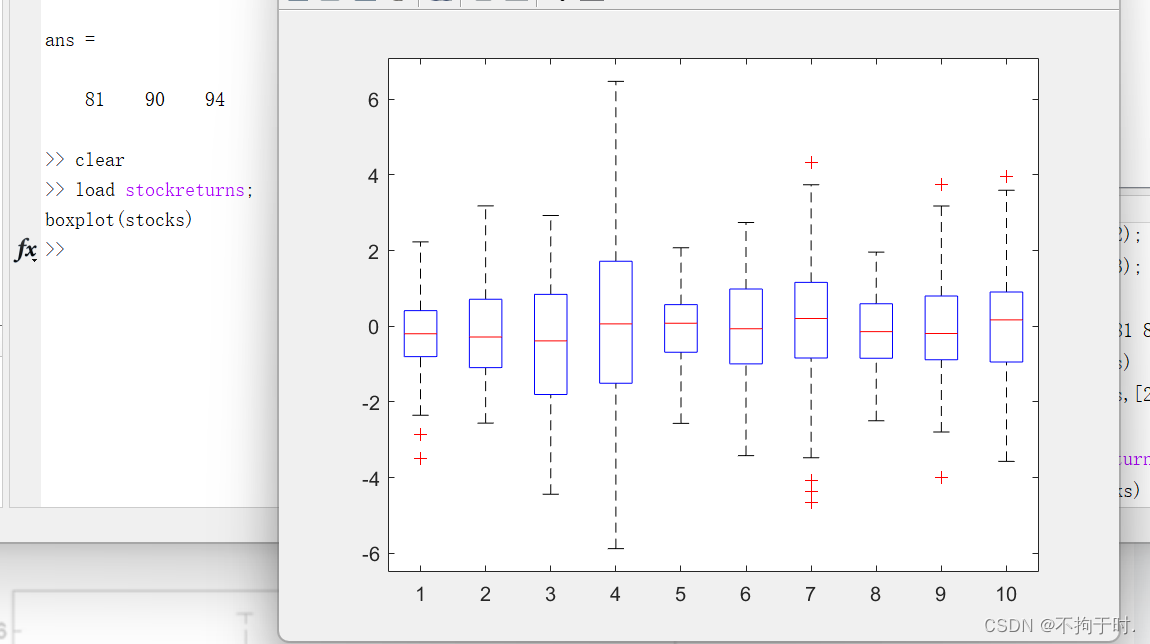
8.Boxplot
主要表示最大值最小值四等分数值、中位数。
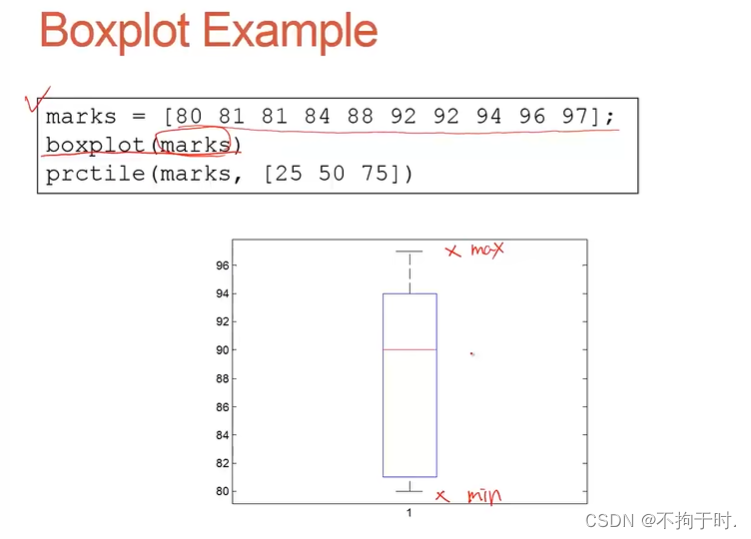
boxplot是返回最大值、最小值,prctile是返回25%、50%、75%的值。
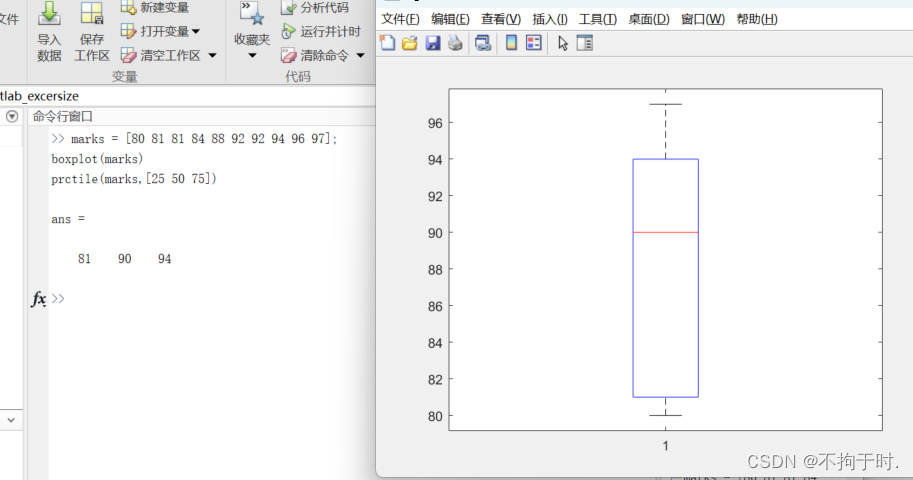
9.股票boxplot练习
直接boxplot即可,因为是按列输出。
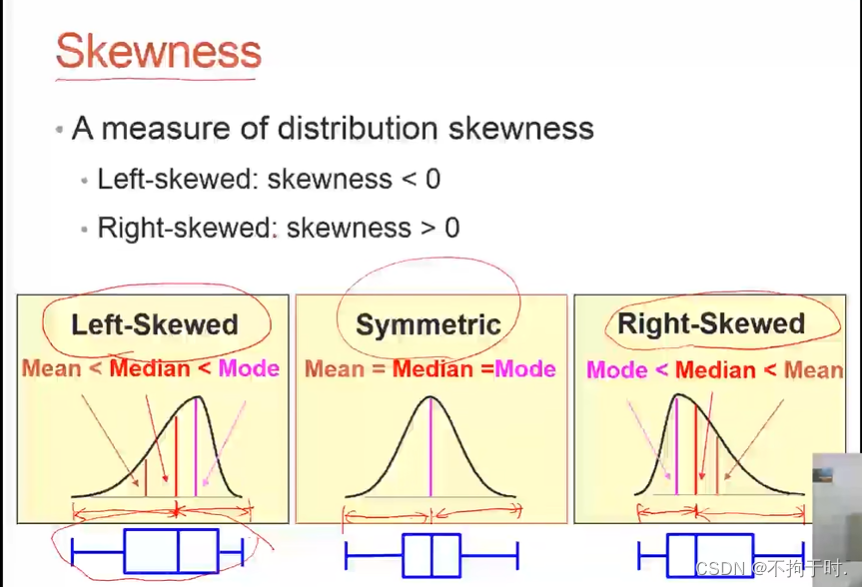
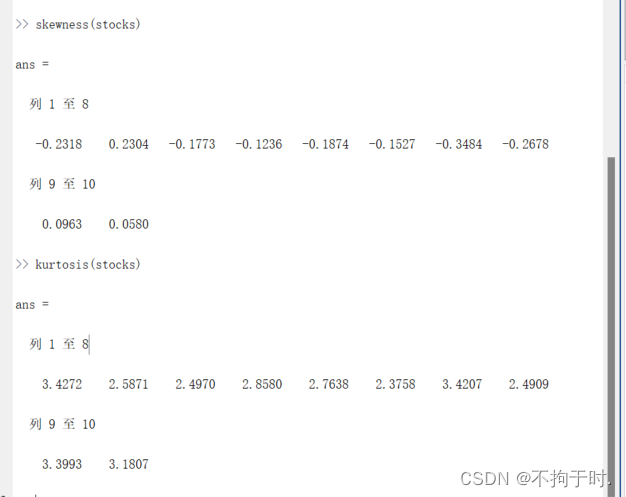
10.skewness歪斜
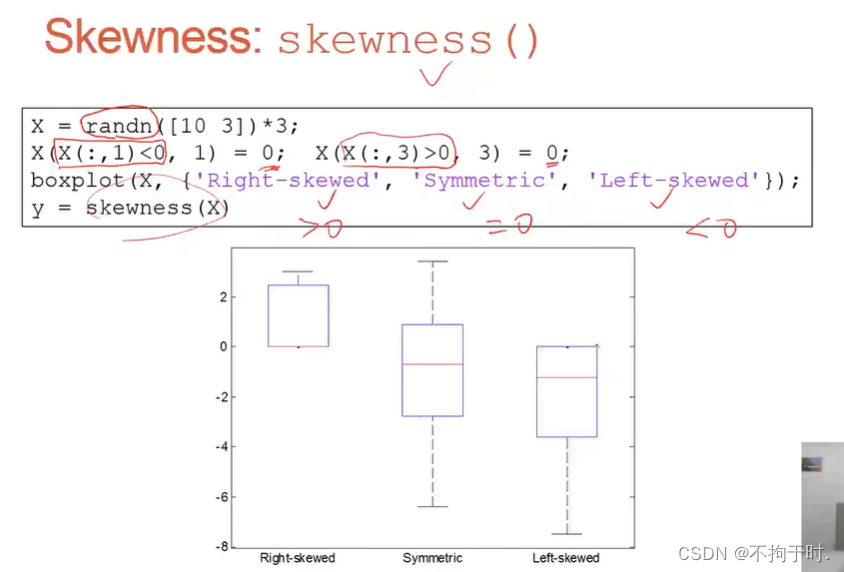
 X = randn([10 3])*3;
X(X(:,1)<0,1)=0; X(X(:,3)>0, 3) = 0;
boxplot(X,{'Right-skewed', 'Symmetric','Left-skewed'});
y = skewness(X)

y =

1.1755 -0.0420 -1.5425 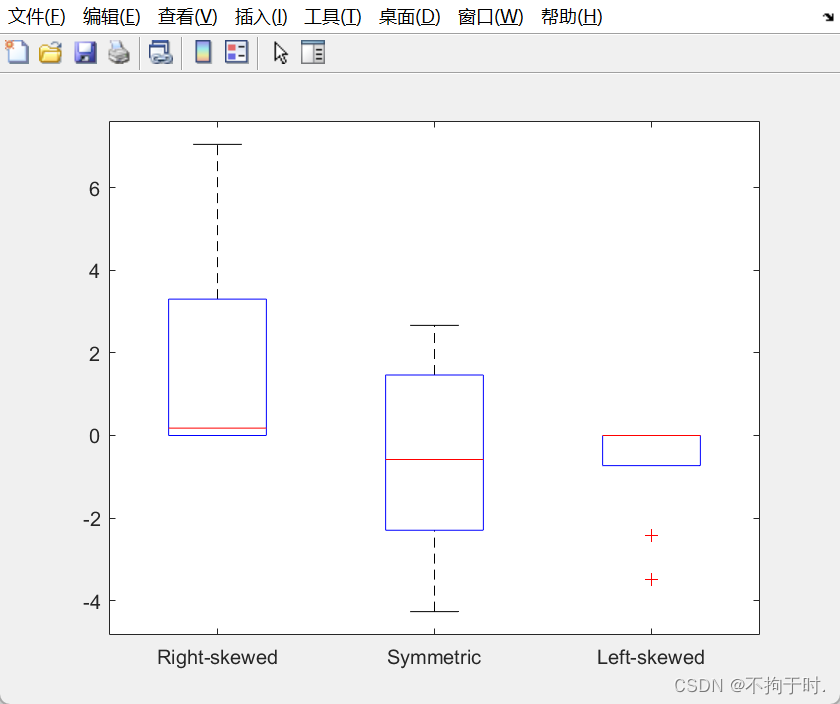
11. KURTOSIS 峰度

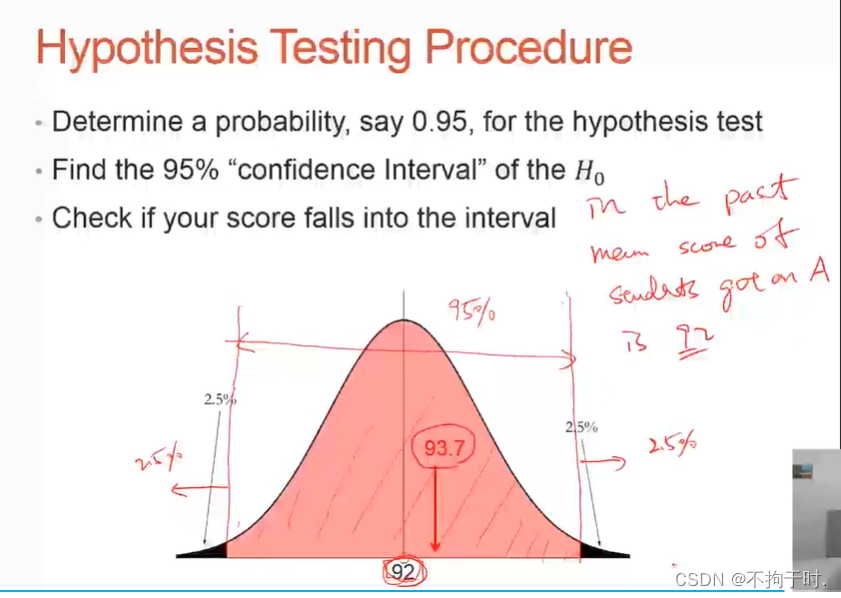
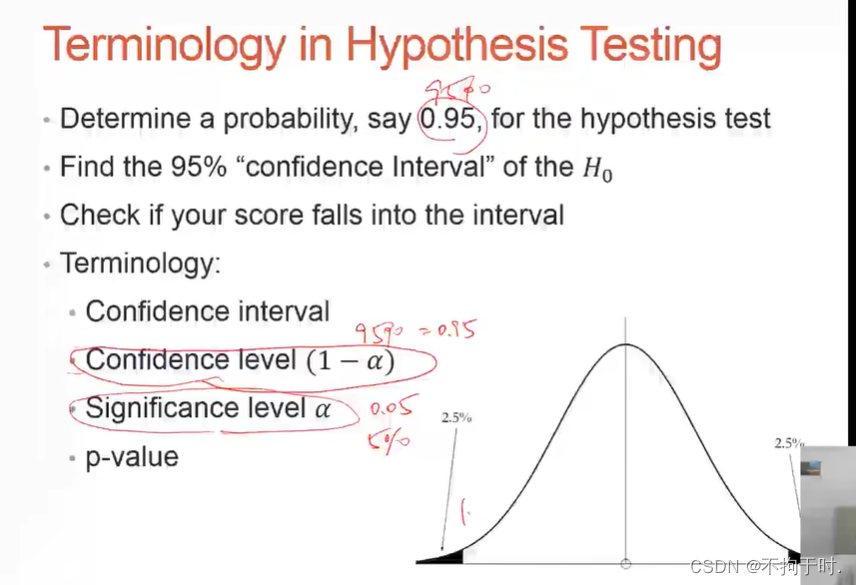
12. statistical hypothesis testing(统计假设检验)
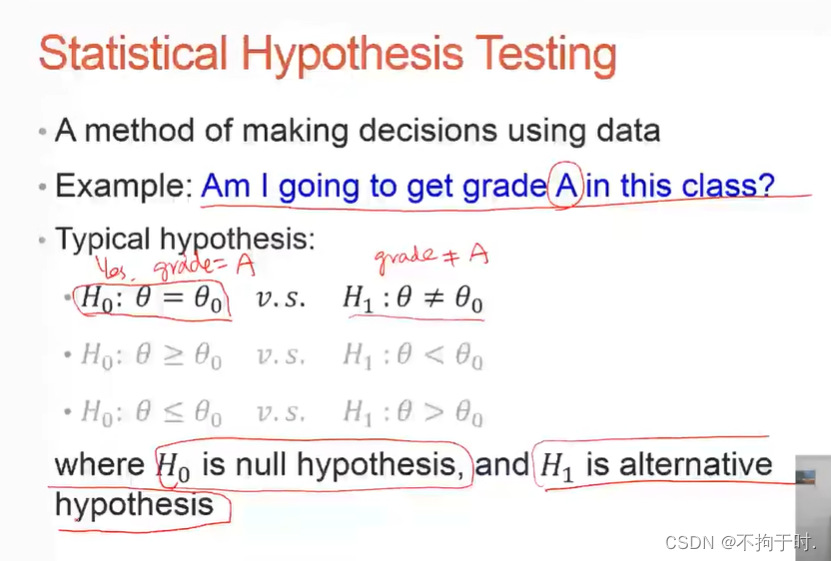
怎么判断会不会拿到A?要对过去的学生成绩进行统计,然后和现在的成绩对比。
13.t-test example
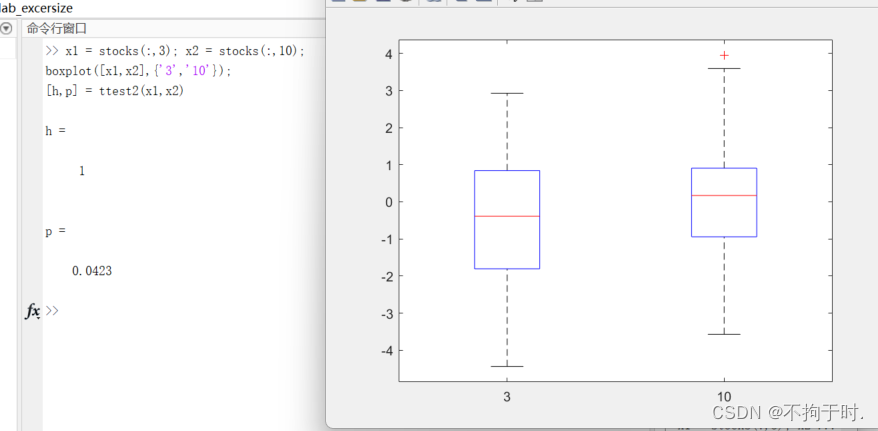
两个股票的平均数是否一样?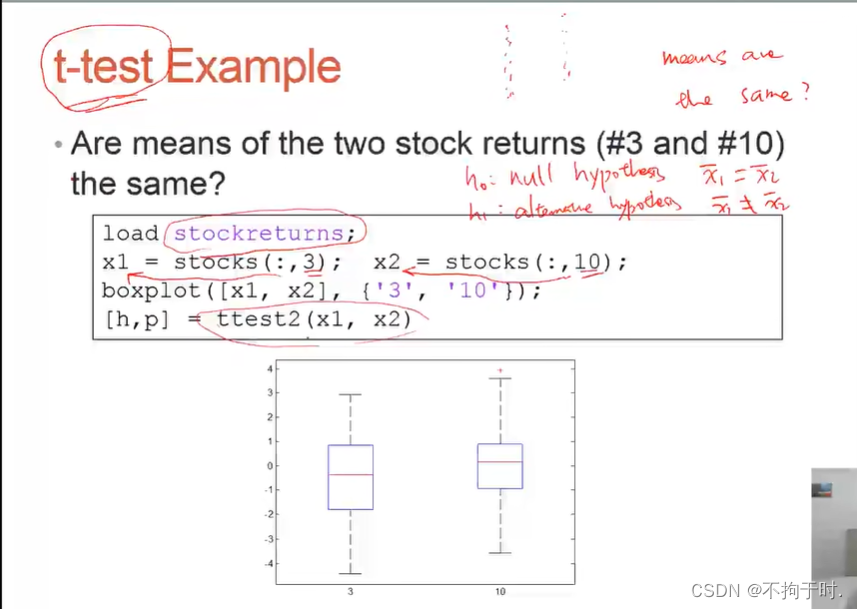
如果h=0就是平均数相等,h=1相反。p是概率,p越小h越不容易成立。很显然不成立
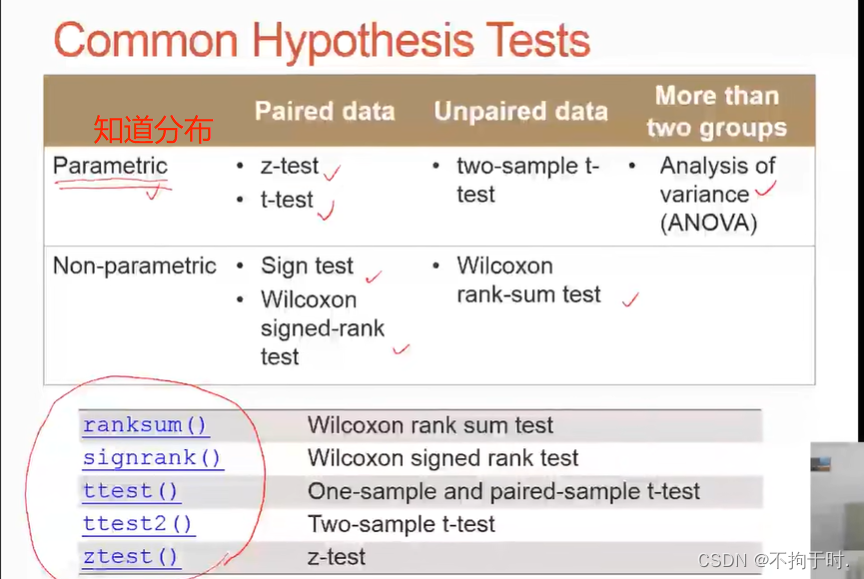
14. 常用假设方法
五 回归与内插
1.simple linear regression简单线性回归
人的身高和体重的关系
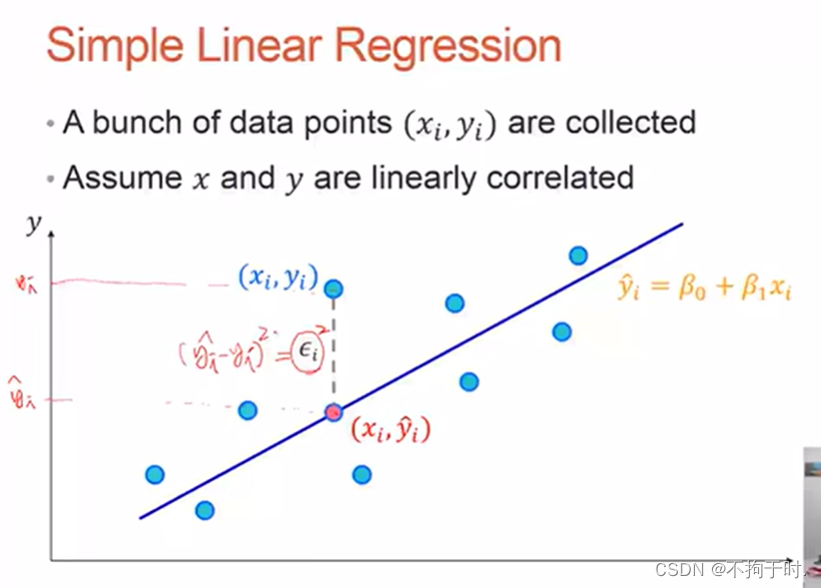
残差平方和
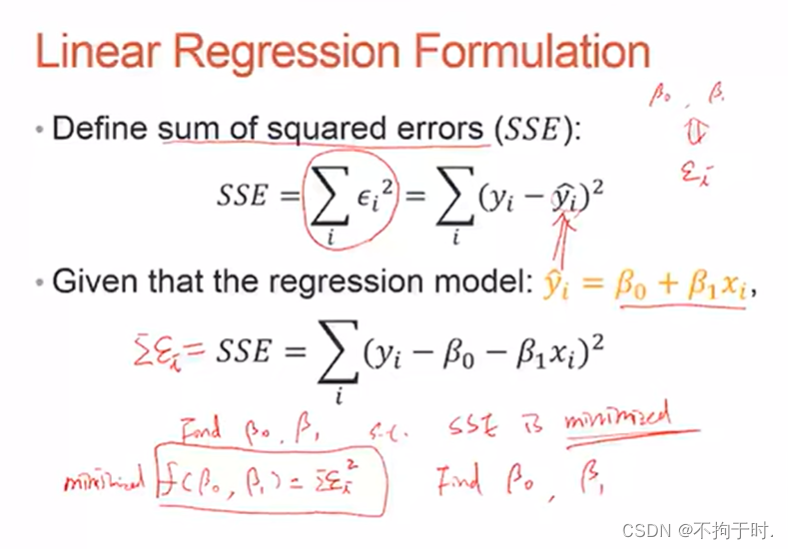
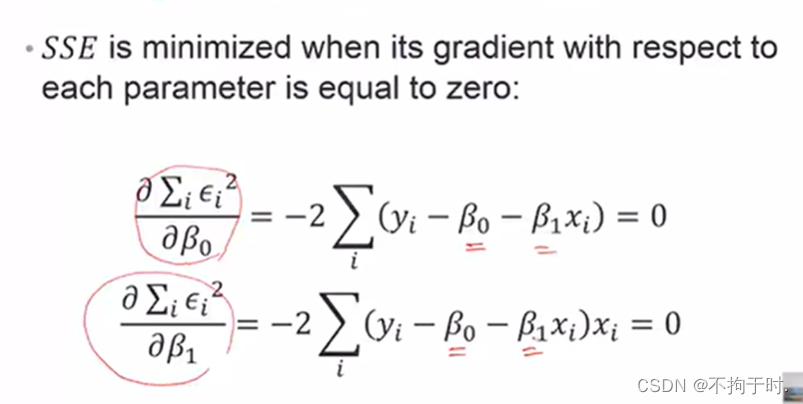
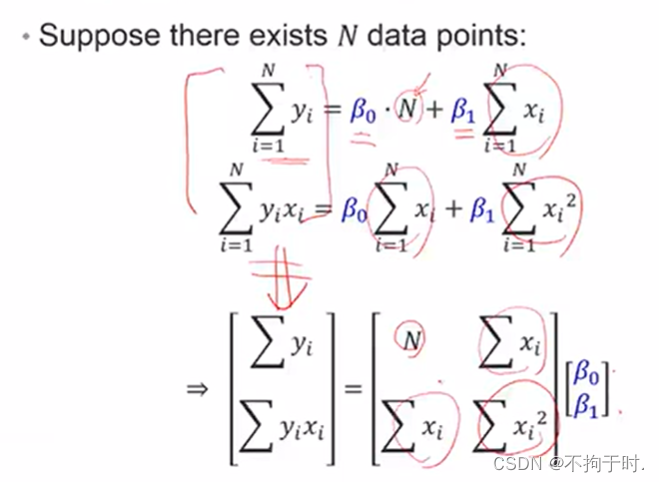
偏导求解
2. polyfit
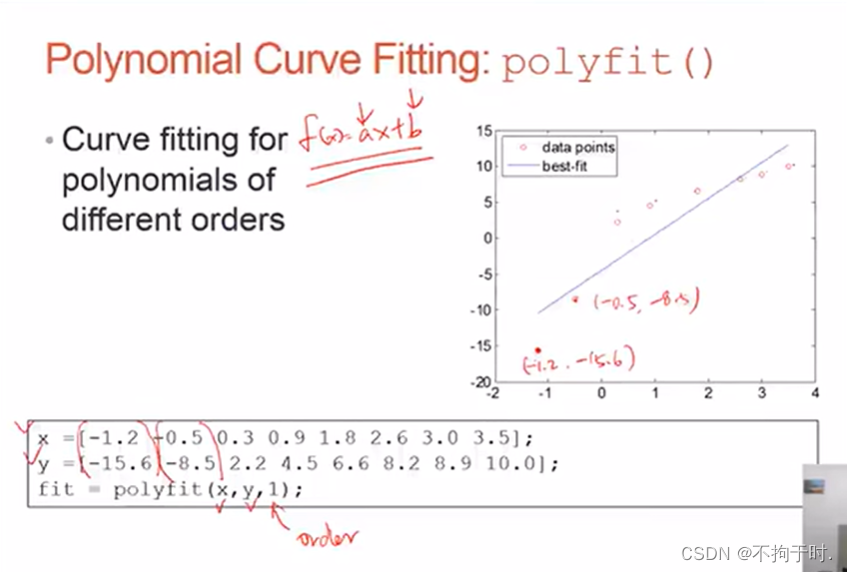
适用polyfit进行拟合,再用定义好的x y进行画线,order为1是要一次方的方程即ax+b
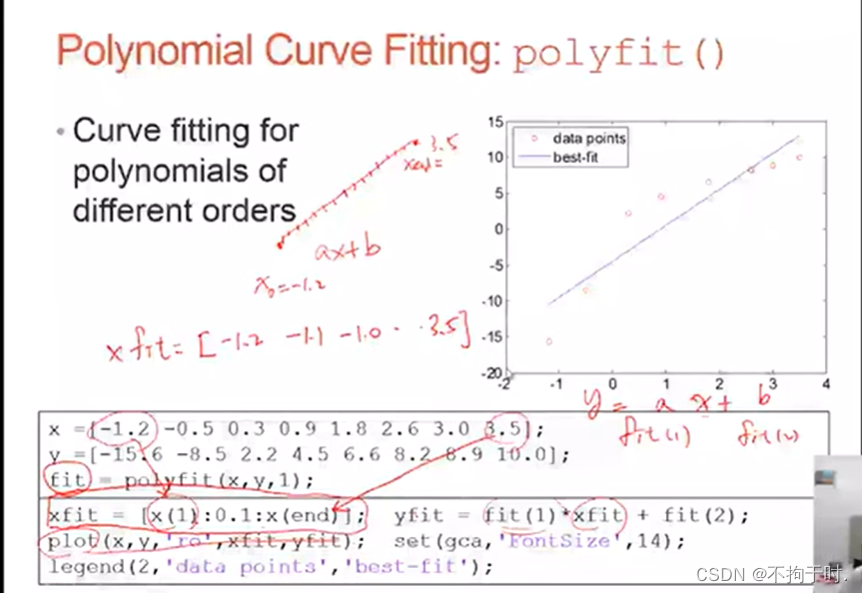
>> x = [-1.2 -0.5 0.3 0.9 1.8 2.6 3.0 3.5];
>> y = [-15.6 -8.5 2.2 4.5 6.6 8.2 8.9 10.0];
>> fit = polyfit(x,y,1);
>> xfit = [x(1):0.1:x(end)]; yfit = fit(1)*xfit + fit(2);
>> plot(x,y,'ro',xfit,yfit); set(gca, 'FontSize',14);
>> legend('data points','beat-fit');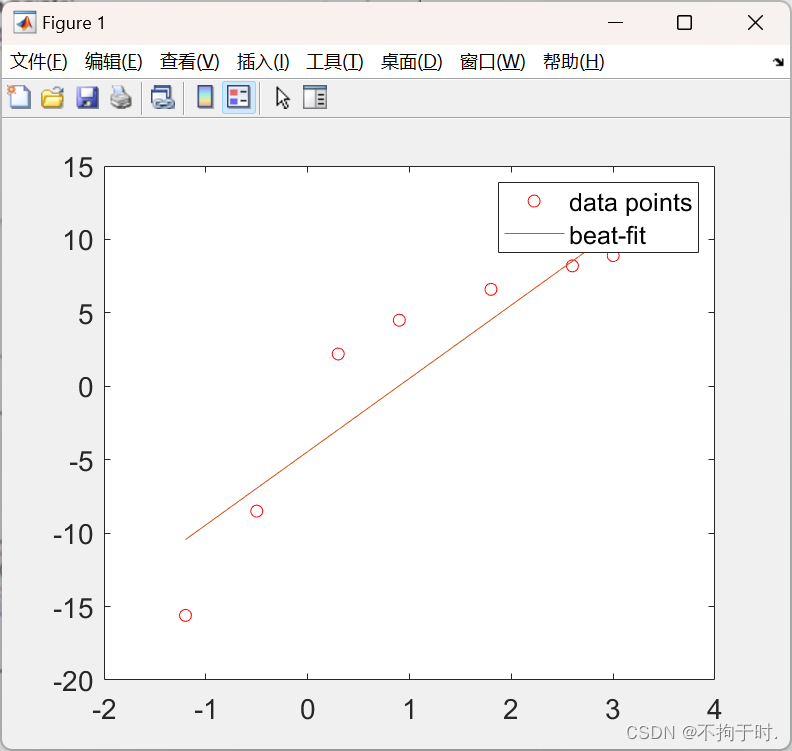
3.polyfit练习 电压与温度关系
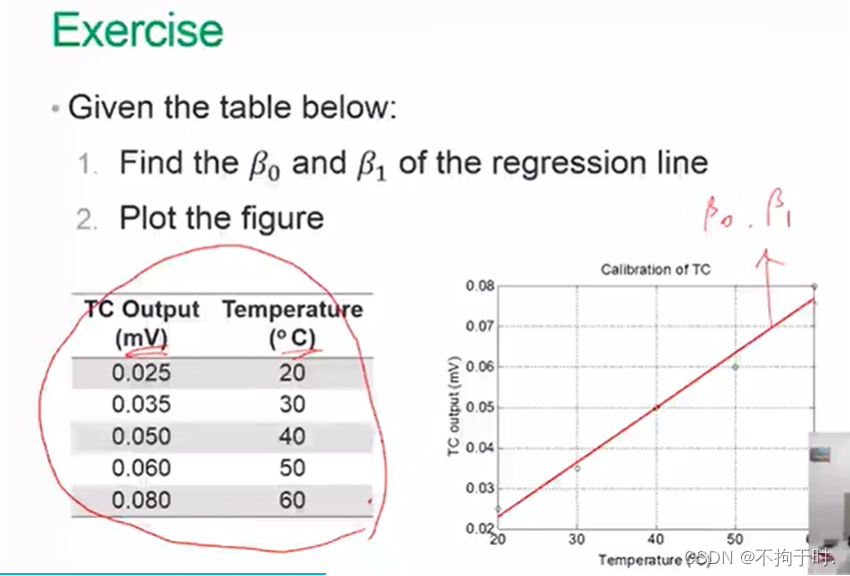
>> x = [20 30 40 50 60];
y = [0.025 0.035 0.050 0.060 0.080];
fit = polyfit(x,y,1);
xfit = [x(1):1:x(end)]; yfit = fit(1)*xfit + fit(2);
plot(x,y,'ro',xfit,yfit); set(gca, 'FontSize',14)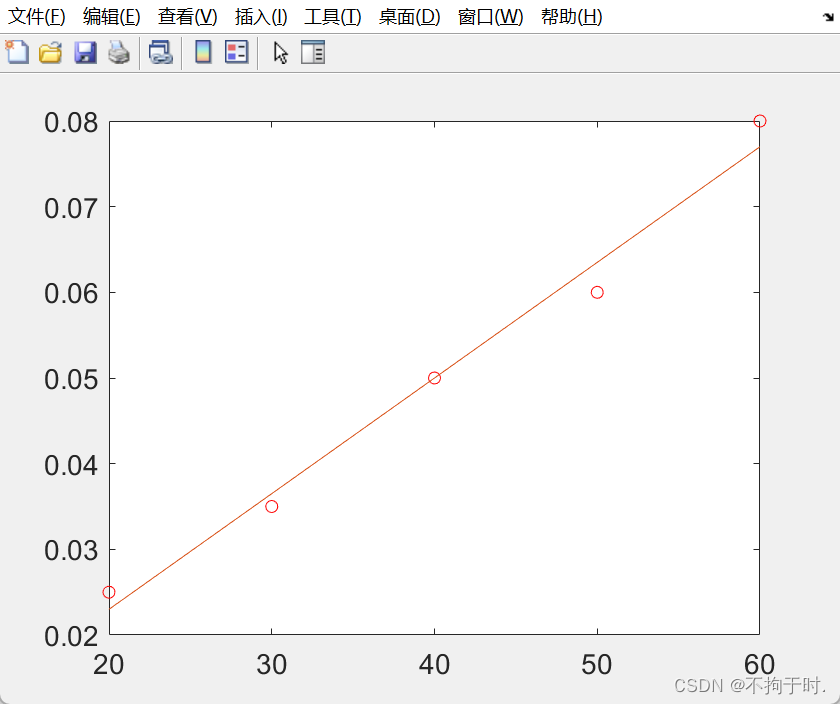
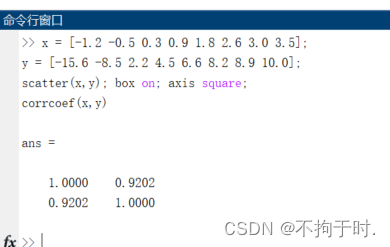
4. x和y有线性关系吗
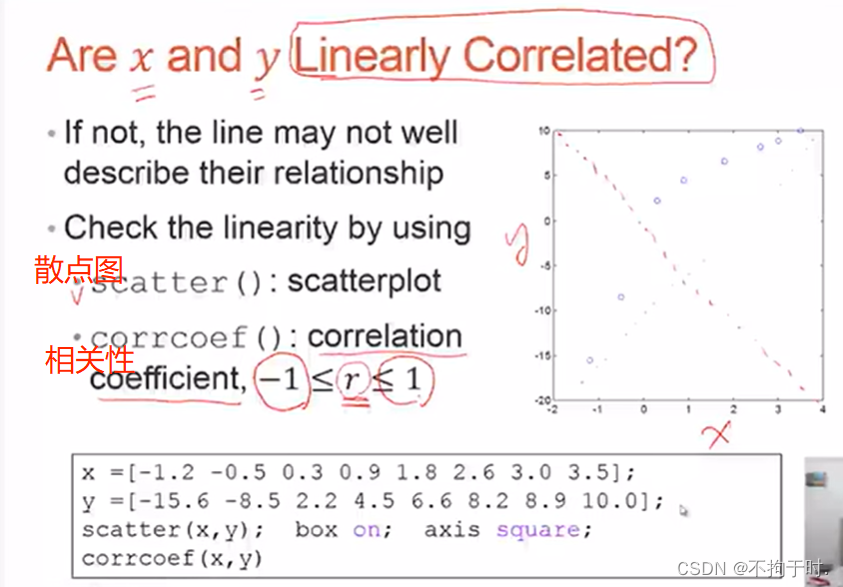
对称矩阵,只看0.9202.
5.高阶profit
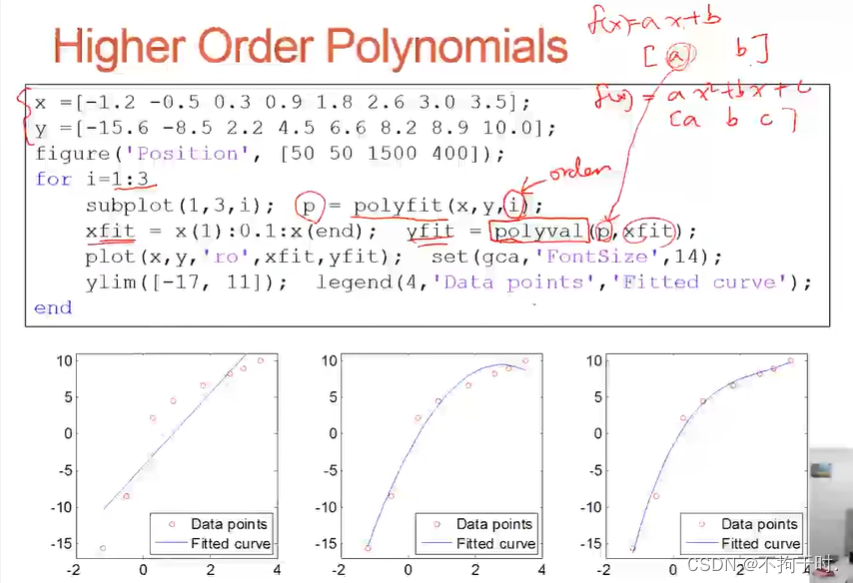
>> x = [-1.2 -0.5 0.3 0.9 1.8 2.6 3.0 3.5];
y = [-15.6 -8.5 2.2 4.5 6.6 8.2 8.9 10.0];
figure('Position', [50 50 1500 400]);
for i=1:3
    subplot(1,3,i); p = polyfit(x,y,i);
   xfit = x(1):0.1:x(end); yfit = polyval(p,xfit);
    plot(x,y,'ro',xfit,yfit); set(gca,'FontSize',14);
    ylim([-17,11]); legend('Data points','Fitted curve');
end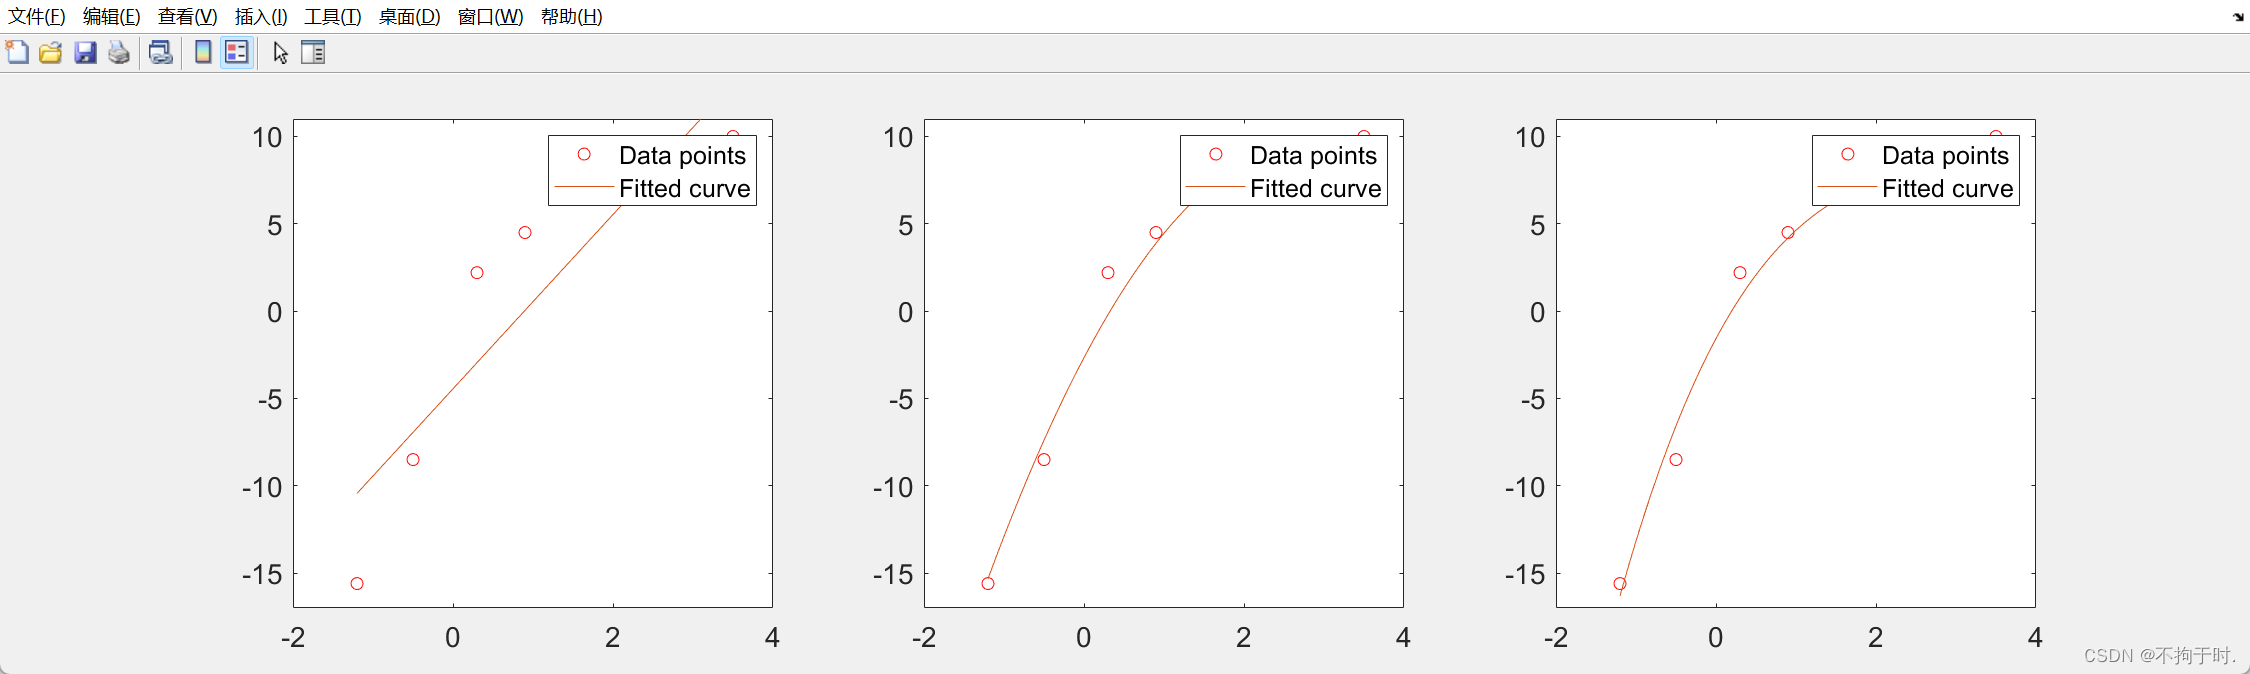
6. 4 5 6阶练习
不是越高阶越好,会过拟合。
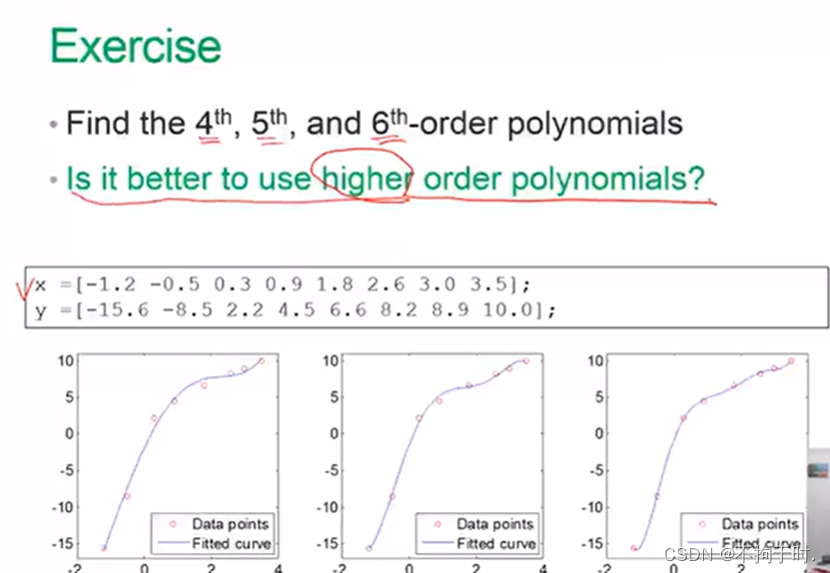
 x = [-1.2 -0.5 0.3 0.9 1.8 2.6 3.0 3.5];
y = [-15.6 -8.5 2.2 4.5 6.6 8.2 8.9 10.0];
figure('Position', [50 50 1500 400]);
for i=4:6
    subplot(1,3,i-3); p = polyfit(x,y,i);
   xfit = x(1):0.1:x(end); yfit = polyval(p,xfit);
    plot(x,y,'ro',xfit,yfit); set(gca,'FontSize',14);
    ylim([-17,11]); legend('Data points','Fitted curve','Location','southeast');
end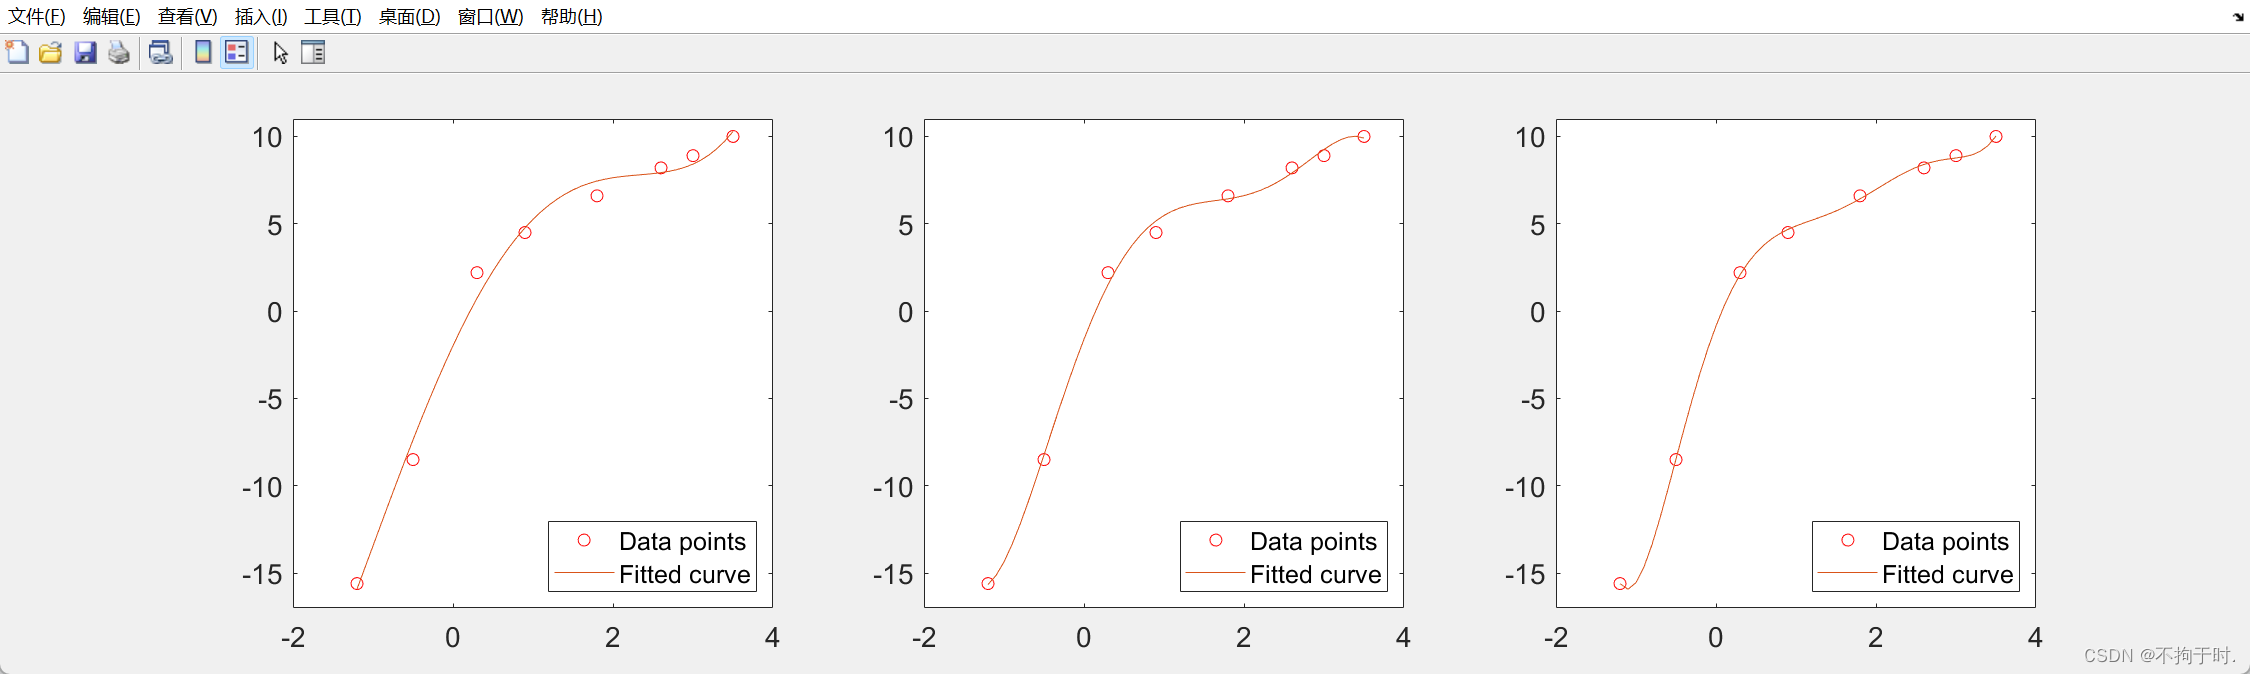
7.多个变量预测
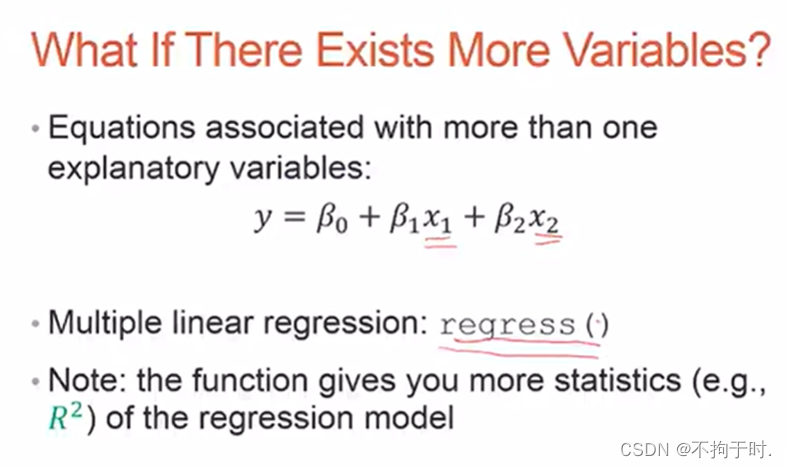
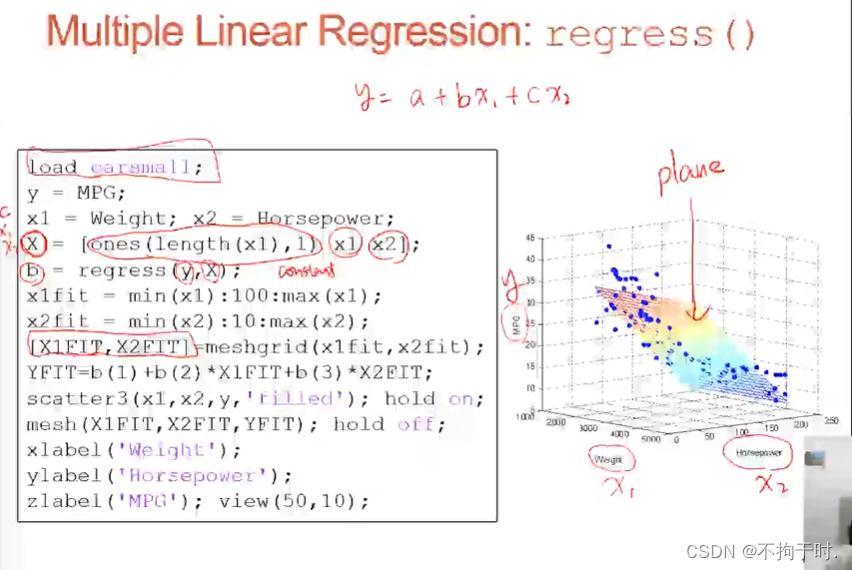
8.公式是否线性?
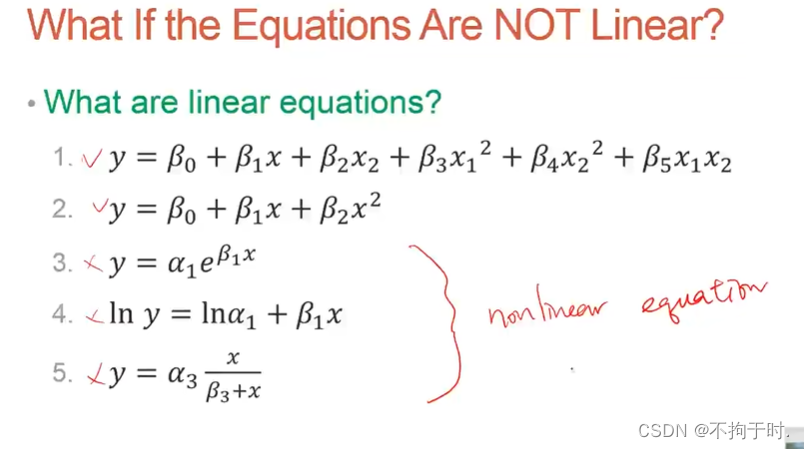
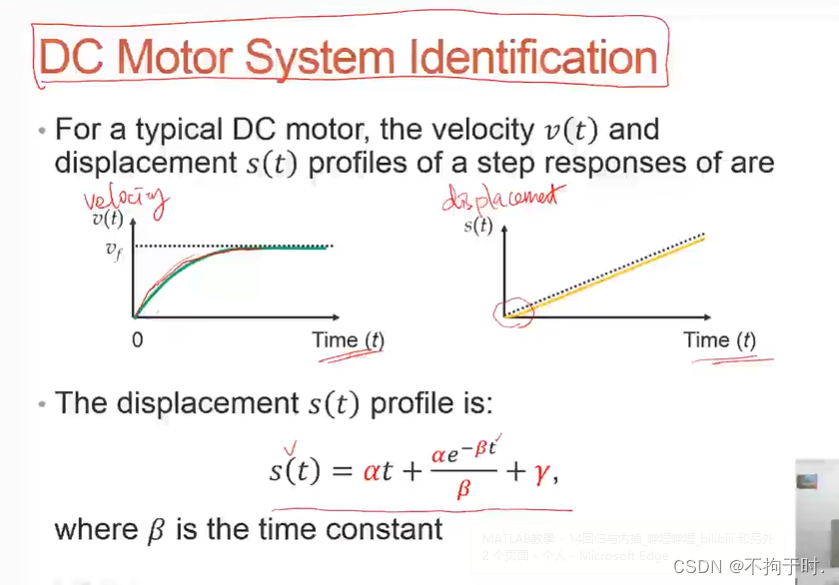
cftool部分因为没有输入数据就先不运用了。
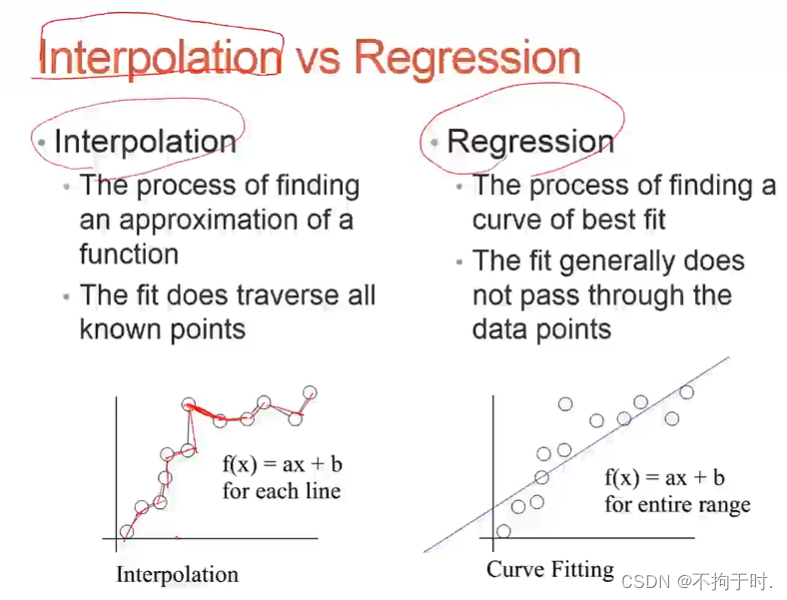
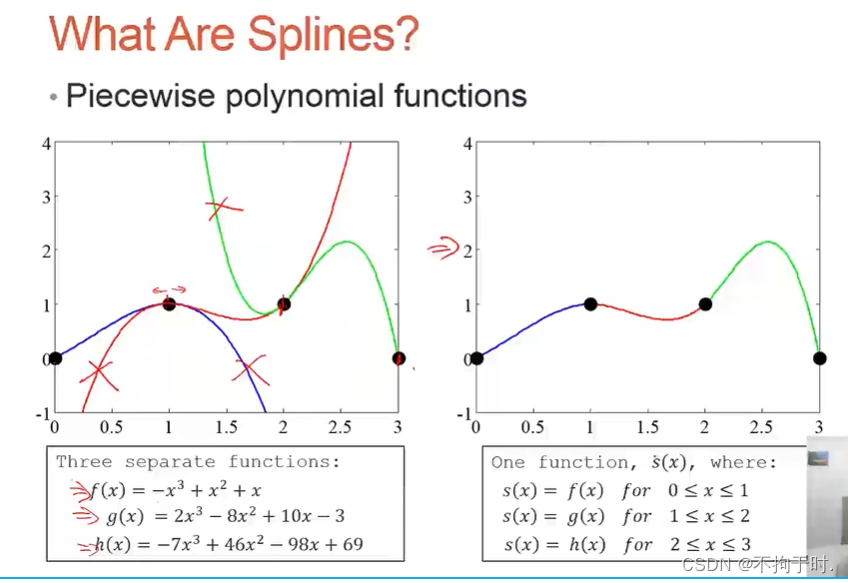
9.内插vs回归
回归是找一个趋势的线,内插是找很多条线,一个个连起来。
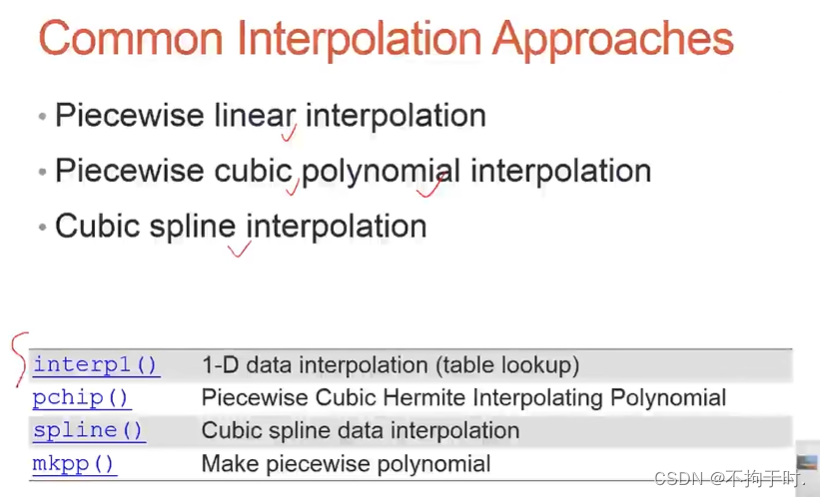
10.线性内插interp1
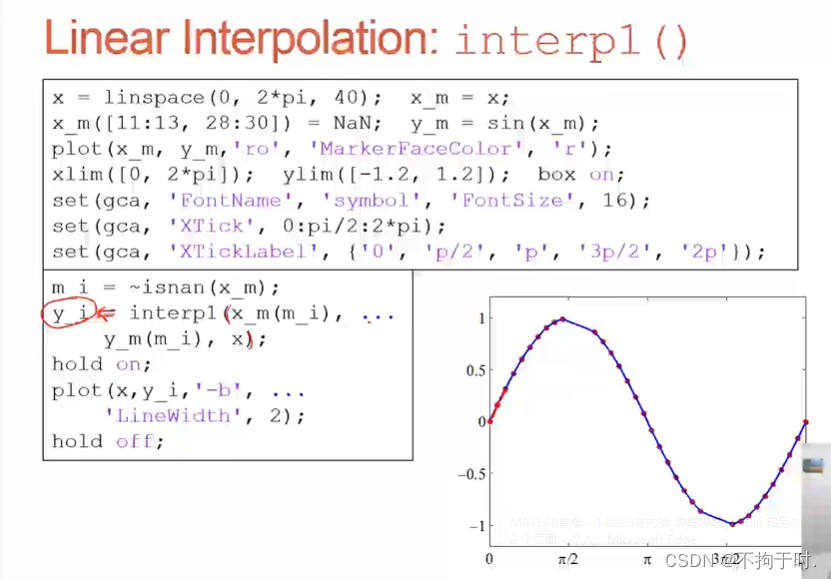
 m_i = ~isnan(x_m);
y_i = interp1(x_m(m_i), y_m(m_i), x);
hold on;
plot(x,y_i,'-b', 'LineWidth', 2);
hold off;
>> x = linspace(0, 2*pi, 40); x_m = x;
x_m([11:13, 28:30]) = NaN; y_m = sin(x_m);
plot(x_m,y_m,'ro','MarkerFaceColor', 'r');
xlim([0, 2*pi]); ylim([-1.2, 1.2]); box on;
set(gca, 'FontSize', 16);
set(gca, 'XTick', 0:pi/2:2*pi);
set(gca, 'XTickLabel', {'0','π/2', 'π', '3π/2','2π'});
m_i = ~isnan(x_m);
y_i = interp1(x_m(m_i), y_m(m_i), x);
hold on;
plot(x,y_i,'-b', 'LineWidth', 2);
hold off;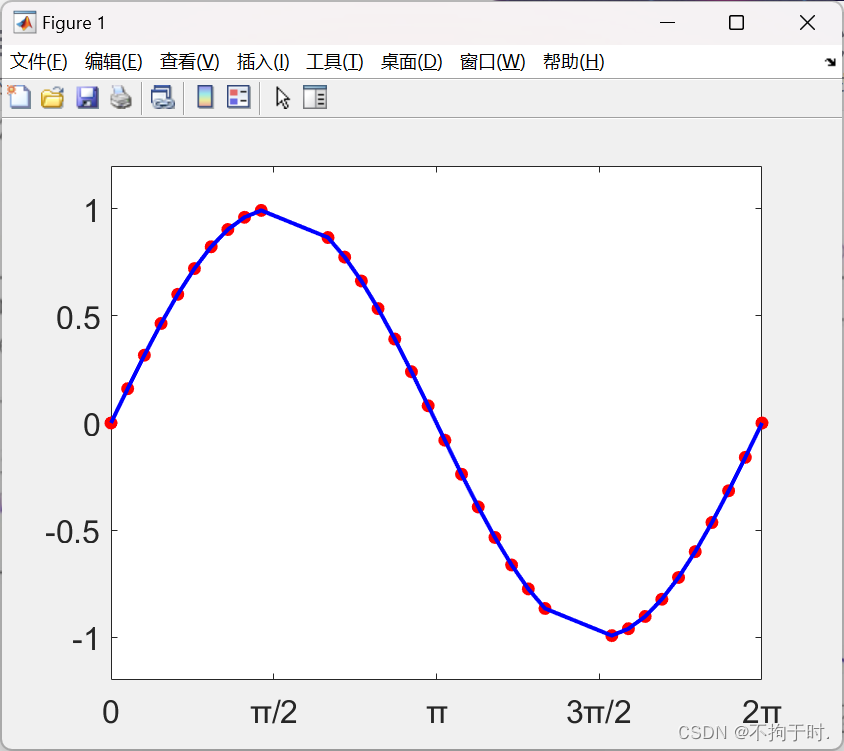
spline可以显得更加平滑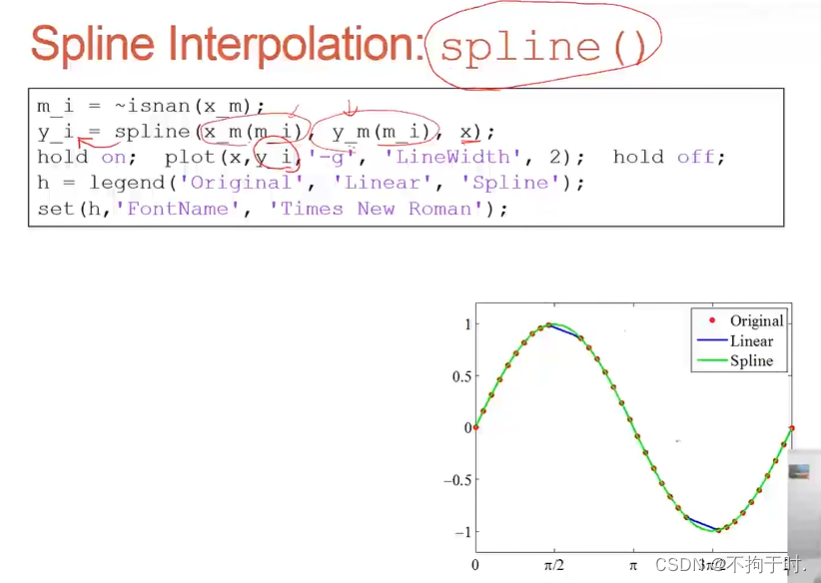
 x = linspace(0, 2*pi, 40); x_m = x;
x_m([11:13, 28:30]) = NaN; y_m = sin(x_m);
plot(x_m,y_m,'ro','MarkerFaceColor', 'r');
xlim([0, 2*pi]); ylim([-1.2, 1.2]); box on;
set(gca, 'FontSize', 16);
set(gca, 'XTick', 0:pi/2:2*pi);
set(gca, 'XTickLabel', {'0','π/2', 'π', '3π/2','2π'});
m_i = ~isnan(x_m);
y_i = interp1(x_m(m_i), y_m(m_i), x);
hold on;
plot(x,y_i,'-b', 'LineWidth', 2);
hold off;
m_i = ~isnan(x_m);
y_i = spline(x_m(m_i), y_m(m_i), x);
hold on;
plot(x,y_i,'-g', 'LineWidth', 2);
hold off;
h = legend('Original', 'Linear', 'Spline');
set(h,'FontName', 'Times New Roman');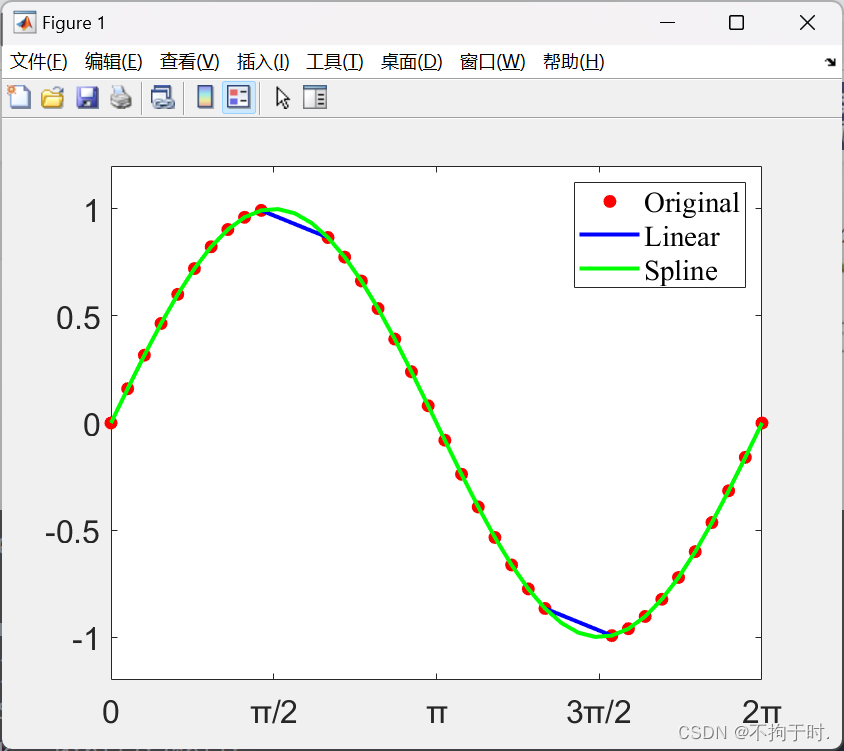
11. linear和spline练习
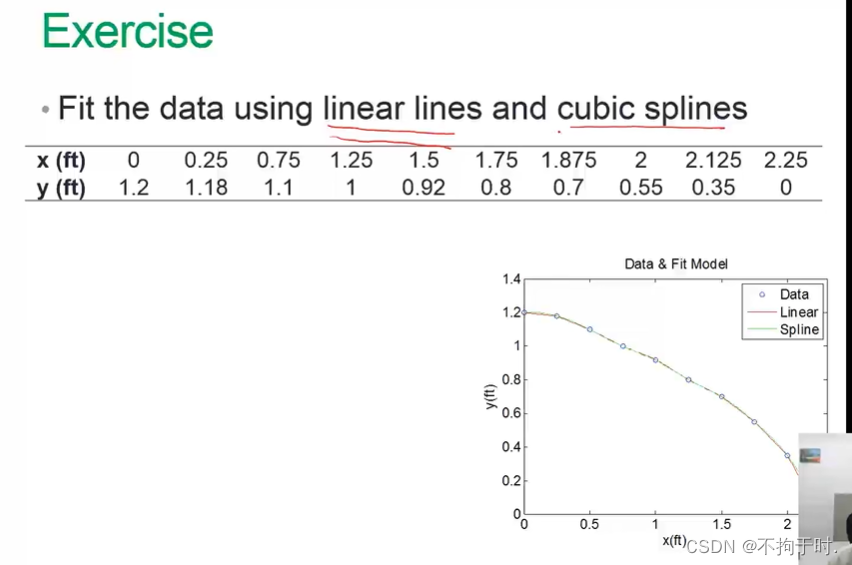
x = [0 0.25 0.75 1.25 1.5 1.75 1.875 2 2.125 2.25];
y = [1.2 1.18 1.1 1 0.92 0.8 0.7 0.55 0.35 0];
plot(x,y,'ro','MarkerFaceColor', 'b');
xlim([0, 2.5]); ylim([0, 1.4]); box on;
set(gca, 'FontSize', 16);
set(gca, 'XTick', 0:0.5:2.5);
set(gca, 'YTick', 0:0.2:1.4);
y1 = interp1(x, y, x);
hold on;
plot(x,y1,'-r', 'LineWidth', 2);
hold off;
y2 = spline(x, y, x);
hold on;
plot(x,y2,'-g', 'LineWidth', 2);
hold off;
h = legend('Data', 'Linear', 'Spline');
set(h,'FontName', 'Times New Roman');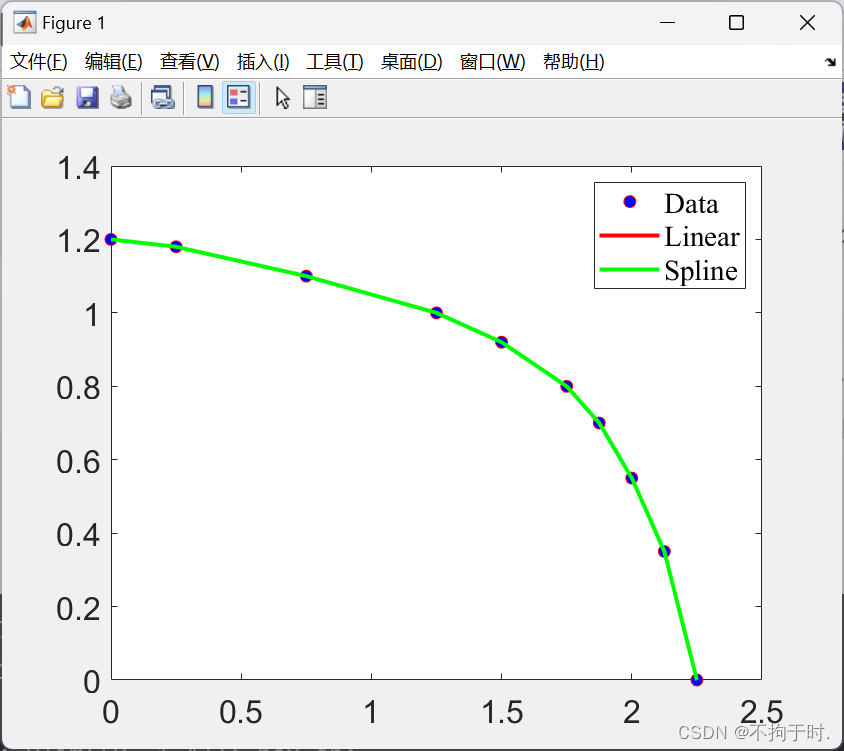
12.cubic spline vs hermite polynomial
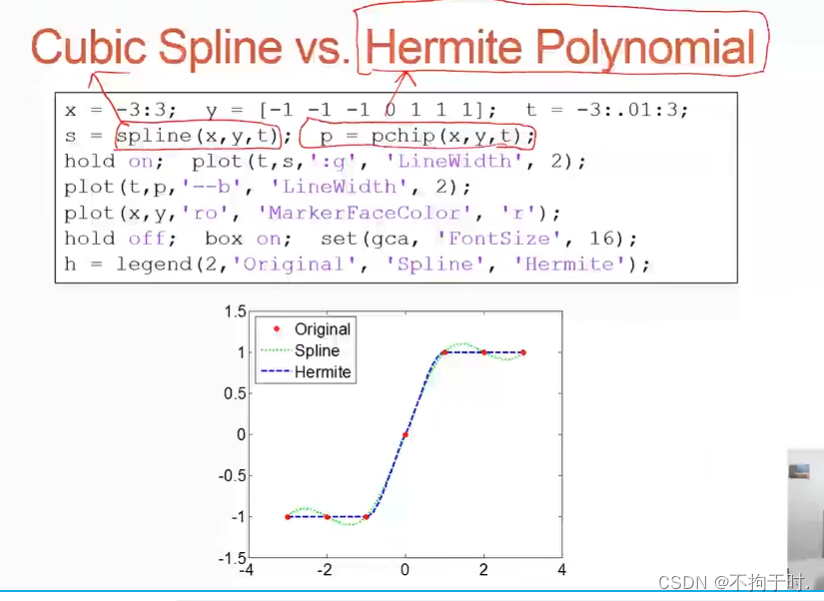
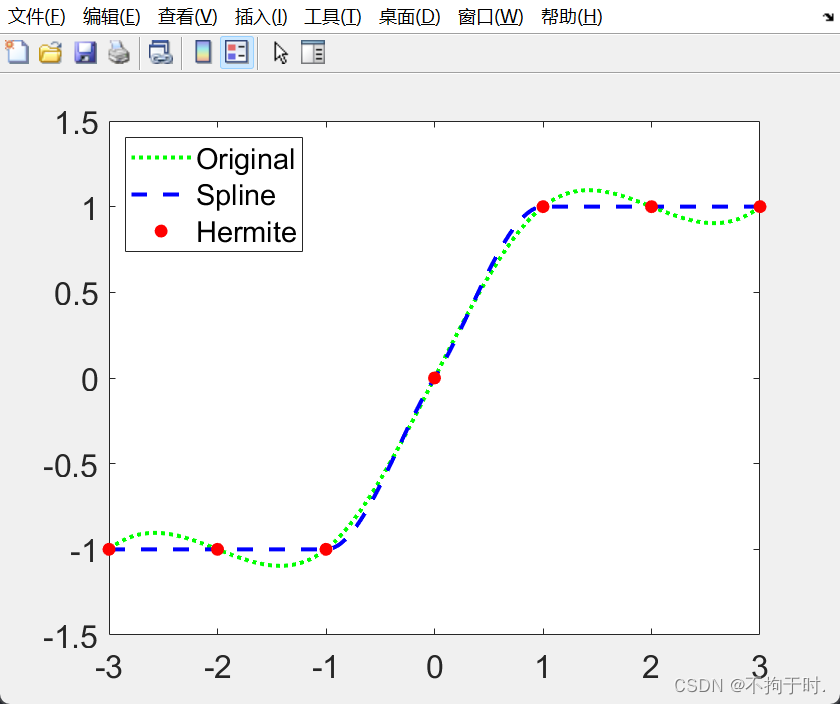
x = -3:3; y = [-1 -1 -1 0 1 1 1]; t = -3:.01:3;
s = spline(x,y,t); p = pchip(x,y,t);
hold on; plot(t,s,':g', 'LineWidth', 2);
plot(t,p,'--b', 'LineWidth',2);
plot(x,y,'ro','MarkerFaceColor','r');
hold off; box on; set(gca,'FontSize', 16);
h = legend('Original', 'Spline','Hermite');
>> x = -3:3; y = [-1 -1 -1 0 1 1 1]; t = -3:.01:3;
s = spline(x,y,t); p = pchip(x,y,t);
hold on; plot(t,s,':g', 'LineWidth', 2);
plot(t,p,'--b', 'LineWidth',2);
plot(x,y,'ro','MarkerFaceColor','r');
hold off; box on; set(gca,'FontSize', 16);
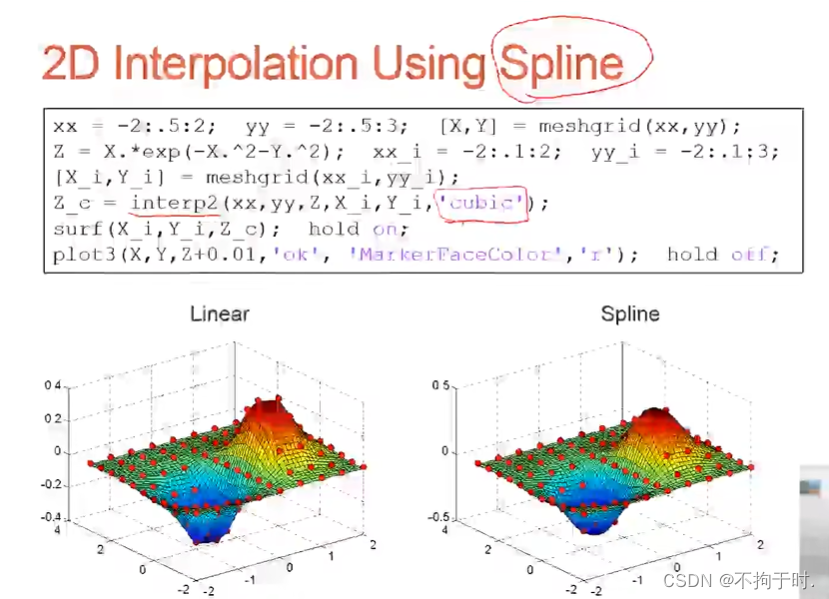
h = legend('Original', 'Spline','Hermite','Location','Northwest');13.interp2
两个x,一个y的值。就照着代码敲了一下。
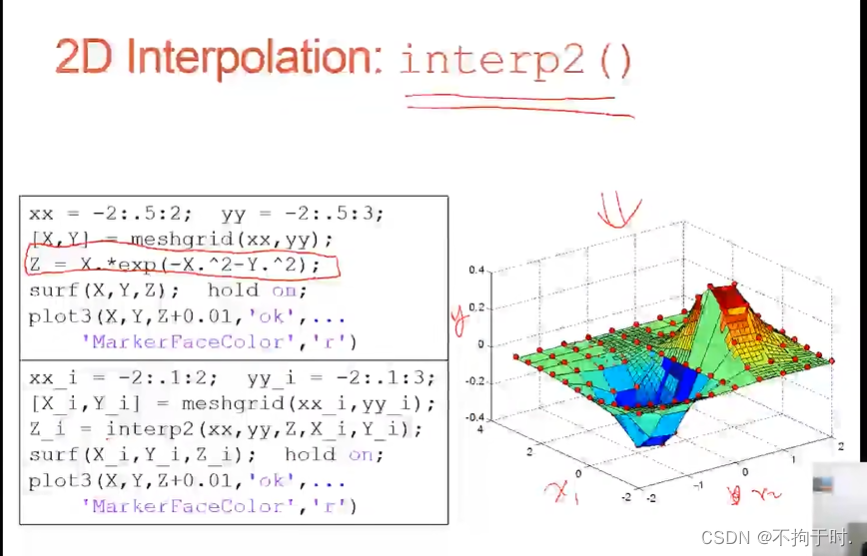
 xx = -2:.4:2; yy = -2:.5:3;
[X,Y] = meshgrid(xx,yy);
Z = X.*exp(-X.^2-Y.^2);
surf(X,Y,Z); hold on;
plot3(X,Y,Z+0.01,'ok','MarkerFaceColor','r')
xx_i = -2:.1:2; yy_i = -2:.1:3;
[X_i,Y_i] = meshgrid(xx_i,yy_i);
Z_i = interp2(xx,yy,Z,X_i,Y_i);
surf(X_i,Y_i,Z_i); hold on;
plot3(X,Y,Z+0.01,'ok','MarkerFaceColor','r')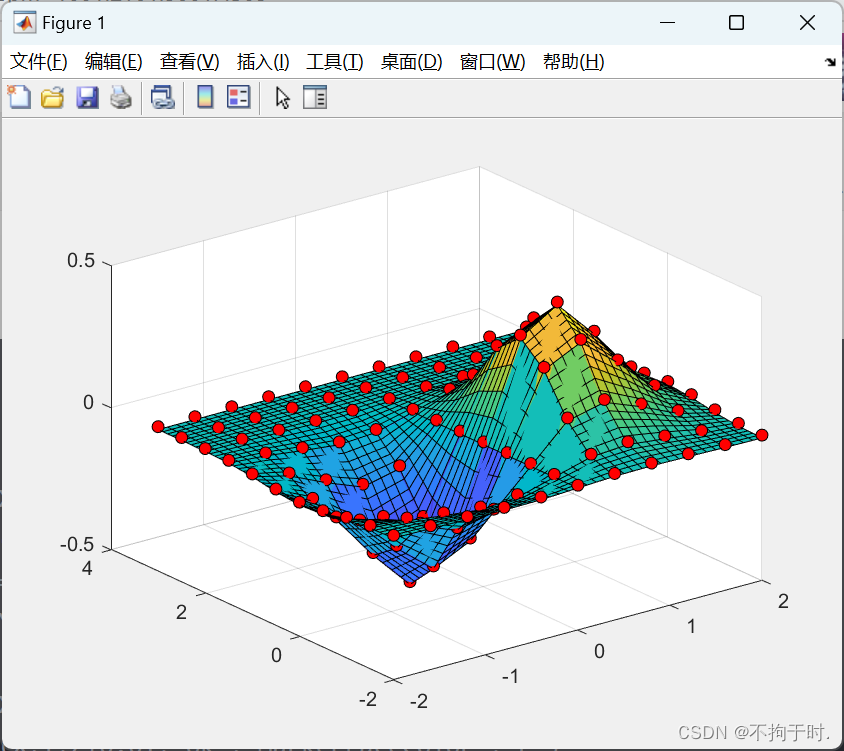


 1767
1767

 被折叠的 条评论
为什么被折叠?
被折叠的 条评论
为什么被折叠?
 到【灌水乐园】发言


