


首先进行安装 Pyside2
pip install pyside2再进行安装 pyqtgraph
pip3 install pyqtgrathUI 转出的PY文件完整代码 mutli_pyqtgraph 文件
# -*- coding: utf-8 -*-

################################################################################
## Form generated from reading UI file 'mutli_pyqtgraph.ui'
##
## Created by: Qt User Interface Compiler version 5.15.2
##
## WARNING! All changes made in this file will be lost when recompiling UI file!
################################################################################

from PySide2.QtCore import *
from PySide2.QtGui import *
from PySide2.QtWidgets import *

from pyqtgraph import GraphicsLayoutWidget


class Ui_GraphicsLayoutWidget(object):
    def setupUi(self, GraphicsLayoutWidget):
        if not GraphicsLayoutWidget.objectName():
            GraphicsLayoutWidget.setObjectName(u"GraphicsLayoutWidget")
        GraphicsLayoutWidget.resize(658, 639)
        self.horizontalLayout = QHBoxLayout(GraphicsLayoutWidget)
        self.horizontalLayout.setObjectName(u"horizontalLayout")
        # self.graphicsView = GraphicsLayoutWidget(GraphicsLayoutWidget)
        # self.graphicsView.setObjectName(u"graphicsView")
        #
        # self.horizontalLayout.addWidget(self.graphicsView)
        #
        #
        self.retranslateUi(GraphicsLayoutWidget)

        QMetaObject.connectSlotsByName(GraphicsLayoutWidget)
    # setupUi

    def retranslateUi(self, GraphicsLayoutWidget):
        GraphicsLayoutWidget.setWindowTitle(QCoreApplication.translate("GraphicsLayoutWidget", u"Dialog", None))
    # retranslateUi
实现多个二维图谱的主要代码 main.py
# @File  : 09.pyside_openglwidget二维.py
# @Author: Dyz
# @Time: 2023/3/16 9:42
# -*- coding: utf-8 -*-

from PySide2.QtWidgets import QApplication, QDialog
from PySide2.QtUiTools import QUiLoader
from source_ui.mutli_pyqtgraph import Ui_GraphicsLayoutWidget
import pyqtgraph as pg
import numpy as np
from pyqtgraph.Qt import QtCore

import sys


class PyqtGraphExample(Ui_GraphicsLayoutWidget, QDialog):
    def __init__(self):
        super(PyqtGraphExample, self).__init__()
        self.setupUi(self)
        # 创建用于存放 plot 对象的布局控件
        self.win = pg.GraphicsLayoutWidget(show=True, title="Basic plotting examples")
        # 设置对象大小
        self.win.resize(1000, 600)
        # 设置对象名称
        self.win.setWindowTitle('pyqtgraph example: Plotting')
        # 设置主窗口大小
        self.resize(1000, 600)
        # 将layout对象添加入布局中
        self.horizontalLayout.addWidget(self.win)
        # Enable antialiasing for prettier plots
        # 设置配置选项 antialias为true
        pg.setConfigOptions(antialias=True)
        # np.random.normal(size=100) 返回一个Int列表
        # 生成第一个统计图 标题为 Basic array plotting  由一百个在Y轴上随机数字组成的数据
        self.p1 = self.win.addPlot(title="Basic array plotting", y=np.random.normal(size=100))
        # 生成第一个统计图 标题为 Multiple curves
        self.p2 = self.win.addPlot(title="Multiple curves")
        # 第一根线 画笔颜色为 pen=(255, 0, 0), name="Red curve"
        self.p2.plot(np.random.normal(size=100), pen=(255, 0, 0), name="Red curve")
        # 第二根线 pen=(0, 255, 0), name="Green curve"
        self.p2.plot(np.random.normal(size=110) + 5, pen=(0, 255, 0), name="Green curve")
        # 第三根线 pen=(0, 0, 255), name="Blue curve"
        self.p2.plot(np.random.normal(size=120) + 10, pen=(0, 0, 255), name="Blue curve")
        # 生成第三张统计图
        self.p3 = self.win.addPlot(title="Drawing with points")
        # 画笔颜色 pen=(200, 200, 200) 在峰值上标点颜色 symbolBrush=(255, 255, 0), 峰值点的边缘颜色 symbolPen='w'
        self.p3.plot(np.random.normal(size=100), pen=(200, 200, 200), symbolBrush=(255, 255, 0), symbolPen='b')
        # 换行
        self.win.nextRow()
        # 第四张统计图
        self.p4 = self.win.addPlot(title="Parametric, grid enabled")
        # 使用三角函数封装数据
        x = np.cos(np.linspace(0, 2 * np.pi, 1000))
        y = np.sin(np.linspace(0, 4 * np.pi, 1000))
        self.p4.plot(x, y)
        # 显示网格
        self.p4.showGrid(x=True, y=True)

        self.p5 = self.win.addPlot(title="Scatter plot, axis labels, log scale")
        x = np.random.normal(size=1000) * 1e-5
        y = x * 1000 + 0.005 * np.random.normal(size=1000)
        y -= y.min() - 1.0
        mask = x > 1e-15
        x = x[mask]
        y = y[mask]
        self.p5.plot(x, y, pen=None, symbol='t', symbolPen=None, symbolSize=10, symbolBrush=(100, 100, 255, 50))
        self.p5.setLabel('left', "Y Axis", units='A')
        self.p5.setLabel('bottom', "Y Axis", units='s')
        self.p5.setLogMode(x=True, y=False)

        # todo 实时刷新统计图
        self.p6 = self.win.addPlot(title="Updating plot")
        self.curve = self.p6.plot(pen='y')
        self.data = np.random.normal(size=(10, 1000))
        self.ptr = 0
        # 创建定时器
        timer = QtCore.QTimer()
        timer.setParent(self)
        # 定时器连接函数
        timer.timeout.connect(self.update)
        timer.start(50)
        # 控件布局内换行
        self.win.nextRow()
        # 第七张统计图
        p7 = self.win.addPlot(title="Filled plot, axis disabled")
        y = np.sin(np.linspace(0, 10, 1000)) + np.random.normal(size=1000, scale=0.1)
        p7.plot(y, fillLevel=-0.3, brush=(50, 50, 200, 100))
        # 显示坐标轴
        p7.showAxis('bottom', False)

        x2 = np.linspace(-100, 100, 1000)
        data2 = np.sin(x2) / x2
        p8 = self.win.addPlot(title="Region Selection")
        p8.plot(data2, pen=(255, 255, 255, 200))
        # lr 是焦点块
        self.lr = pg.LinearRegionItem([400, 700])
        self.lr.setZValue(-10)
        p8.addItem(self.lr)
        # 设置第九张统计图
        self.p9 = self.win.addPlot(title="Zoom on selected region")
        self.p9.plot(data2)
        # 信号连接
        # lr 焦点块动作连接 函数 updatePlot
        self.lr.sigRegionChanged.connect(self.updatePlot)
        # 第九张图 updateRegion x 轴变化连接
        self.p9.sigXRangeChanged.connect(self.updateRegion)
        self.updatePlot()

    def update(self):
        # 第六张图动态刷新函数
        self.curve.setData(self.data[self.ptr % 10])
        if self.ptr == 0:
            self.p6.enableAutoRange('xy', False)  ## stop auto-scaling after the first data set is plotted
        self.ptr += 1

    def updatePlot(self):
        # 设置第九张图 X点坐标
        self.p9.setXRange(*self.lr.getRegion(), padding=0)

    def updateRegion(self):
        # 焦点块变换
        self.lr.setRegion(self.p9.getViewBox().viewRange()[0])


if __name__ == '__main__':
    # 该部分以及结束的 sys.exit(app.exec_()) 是固定的 PyQt5 运行语句
    app = QApplication()

    # 建立窗口实例并展示
    window = PyqtGraphExample()
    window.show()

    sys.exit(app.exec_())
如果 运行成功 可以 看到以下窗口
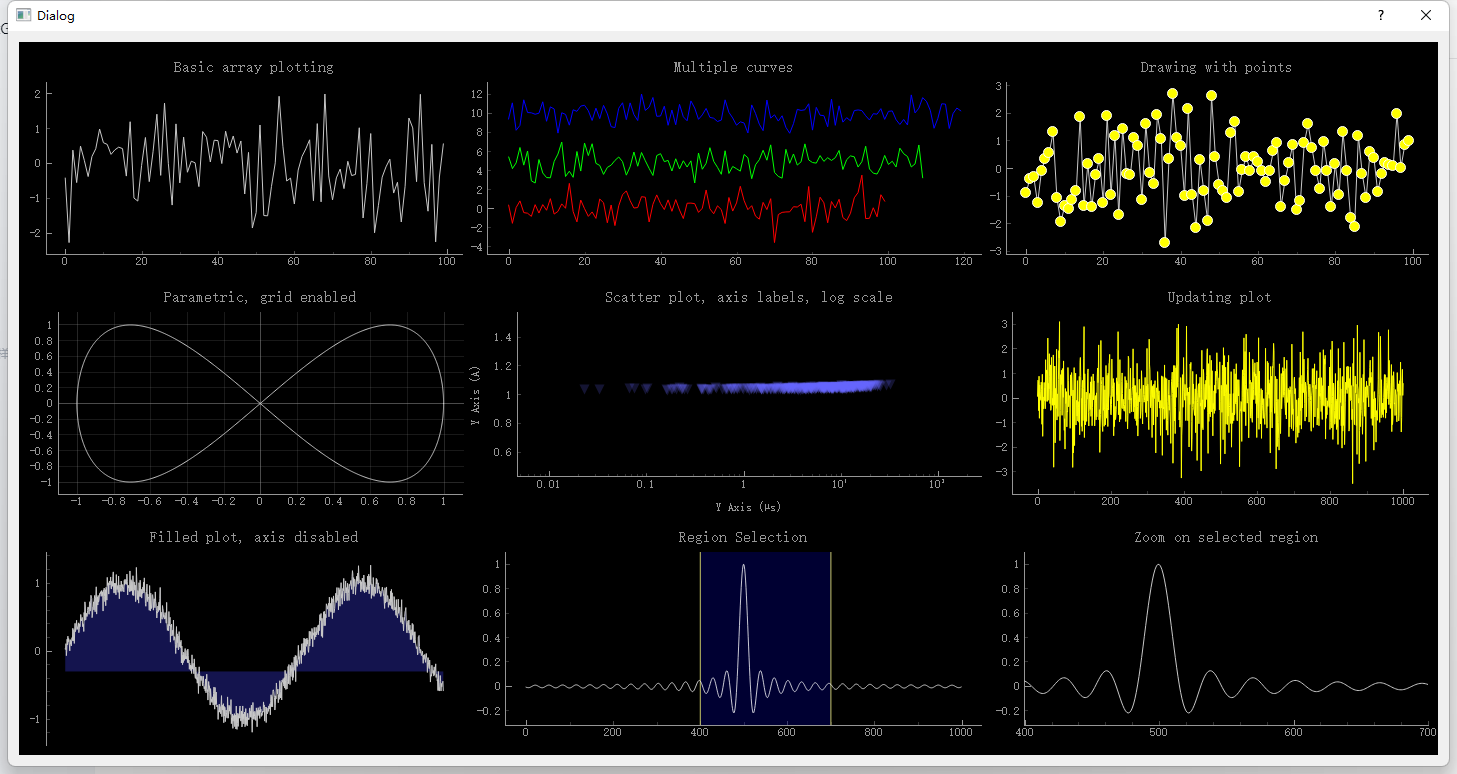
注意:如果运行报错 PYTHON 需要安装 OpenGl 的话 详情见 编者的另一篇笔记


 892
892


 被折叠的 条评论
为什么被折叠?
被折叠的 条评论
为什么被折叠?
 到【灌水乐园】发言


