本文为个人理解,如有错误请多指教。
github地址:(https://github.com/PhilJay/MPAndroidChart#questions–issues)
**** 饼图 PieChart
1.首先在build.gradle(Project: )中找到repositories,在其中加上 maven { url “https://jitpack.io” }
allprojects {
    repositories {
        google()
        jcenter()
        maven { url "https://jitpack.io" }
    }
}
在build.gradle(Module: )的dependencies中加上 implementation ‘com.github.PhilJay:MPAndroidChart:v3.1.0’
dependencies {

    implementation 'com.github.PhilJay:MPAndroidChart:v3.1.0'


    implementation fileTree(dir: 'libs', include: ['*.jar'])
    implementation 'androidx.appcompat:appcompat:1.1.0'
    implementation 'androidx.constraintlayout:constraintlayout:1.1.3'
    testImplementation 'junit:junit:4.12'
    androidTestImplementation 'androidx.test:runner:1.2.0'
    androidTestImplementation 'androidx.test.espresso:espresso-core:3.2.0'
}
2.在布局中引用
    <com.github.mikephil.charting.charts.PieChart
        android:layout_width="match_parent"
        android:layout_height="match_parent"
        android:id="@+id/pieChart"
        />
3.在活动中构造PieChart
public class MainActivity extends AppCompatActivity {
PieChart pieChart;
@Override
protected void onCreate(Bundle savedInstanceState) {
super.onCreate(savedInstanceState);
setContentView(R.layout.piechartlayout);
pieChart = (PieChart) findViewById(R.id.pieChart);
pieChart.setUsePercentValues(true);
pieChart.getDescription().setEnabled(false);
pieChart.setExtraOffsets(5,10,5,5);
pieChart.setDragDecelerationFrictionCoef(0.9f);
pieChart.setDrawHoleEnabled(true);
pieChart.setHoleColor(Color.WHITE);
pieChart.setTransparentCircleRadius(64f);
pieChart.animateY(1000, Easing.EaseInBack);
Description description = new Description();
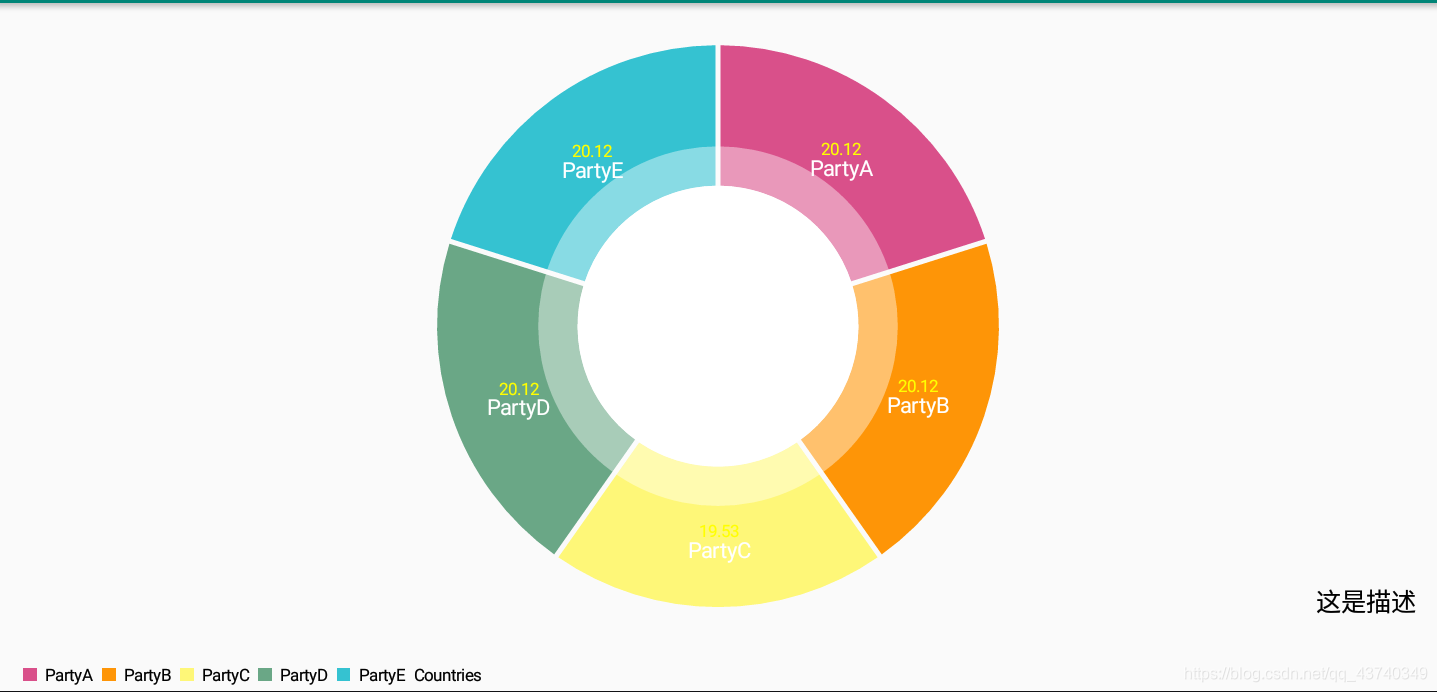
description.setText("这是描述");
description.setTextSize(15f);
pieChart.setDescription(description);
ArrayList<PieEntry> yValues = new ArrayList<>();
yValues.add(new PieEntry(34f,"PartyA"));
yValues.add(new PieEntry(34f,"PartyB"));
yValues.add(new PieEntry(33f,"PartyC"));
yValues.add(new PieEntry(34f,"PartyD"));
yValues.add(new PieEntry(34f,"PartyE"));
PieDataSet dataSet = new PieDataSet(yValues,"Countries");
dataSet.setSliceSpace(3f);
dataSet.setSelectionShift(5f);
dataSet.setColors(ColorTemplate.JOYFUL_COLORS);
PieData data = new PieData(dataSet);
data.setValueTextSize(10f);
data.setValueTextColor(Color.YELLOW);;
pieChart.setData(data);
}
}
最简单pieChart就实现了,效果如下


 1104
1104

 被折叠的 条评论
为什么被折叠?
被折叠的 条评论
为什么被折叠?
 到【灌水乐园】发言


