


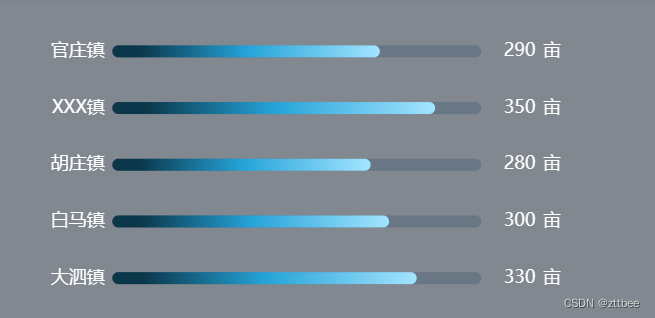
1、实现效果,条形图自动滚动,鼠标移入停止滚动,移出继续滚动
2、代码
声明的变量:图表,图表数据与定时器
myChartArea: '',
dataArea: {
  categoryData: [],
  valueData: [],
  fullData: [],
},
timeOut: null,
设置基础数据,并调用函数
this.dataArea.categoryData = ['永安镇', '大泗镇', '白马镇', '胡庄镇', 'XXX镇', '官庄镇', '侏儒山', '永安镇', '大泗镇', '白马镇', '胡庄镇', ];
this.dataArea.valueData = [200, 330, 300, 280, 350, 290, 180, 200, 330, 300, 280, ];
this.dataArea.fullData = [400, 400, 400, 400, 400, 400, 400, 400, 400, 400, 400, ];
this.initChartArea();
相关函数:配置图表函数,自动播放函数,停止播放函数,继续播放函数
initChartArea() {
				this.myChartArea = echarts.init(this.$refs.chartImplement);
				this.myChartArea.clear();
				var that = this;
				var categoryData = this.dataArea.categoryData;
				var valueData = this.dataArea.valueData;
				this.option = {
					tooltip: {
						show: false,
					},
					grid: {
						top: '0%',
						left: '1%',
						right: '0%',
						bottom: '0%',
						containLabel: true
					},
					xAxis: {
						type: 'value',
						boundaryGap: [0, 0.01],
						splitLine: {
							show: false,
						},
						axisLabel: {
							show: false,
							color: 'transparent',
						},
					},
					yAxis: {
						type: 'category',
						data: this.dataArea.categoryData,
						axisLabel: {
							show: true,
							color: 'transparent',
						},
						axisLine: {
							show: false,
						},
						axisTick: {
							show: false,
						}
					},
					// 自动滚动
					dataZoom: [ //滑动条
						{
							show: false, //是否显示滑动条
							yAxisIndex: 0,
							type: 'slider', // 这个 dataZoom 组件是 slider 型 dataZoom 组件
							startValue: 0, // 从头开始。
							endValue: 4 // 一次性展示5个。
						}
					],
					series: [{
							name: '亩数',
							type: 'bar',
							barWidth: 8,
							data: this.dataArea.valueData,
							label: { //图形上的文本标签
								show: true,
								position: 'left', //标签的位置
								offset: [0, 0], //标签文字的偏移,此处表示向上偏移40
								formatter: function(data) {
									return data.name;
								},
								textStyle: {
									fontSize: 12,
									color: '#FFFFFF',
								},
							},
							itemStyle: {
								normal: {
									color: new echarts.graphic.LinearGradient(0, 0, 1, 0, [ // color在这里
										{
											offset: 0.1,
											color: '#0A374A'
										},
										{
											offset: 0.5,
											color: '#24A3D8'
										},
										{
											offset: 1,
											color: '#A4E4FF'
										}
									]),
									barBorderRadius: 4, //柱条圆角半径,单位px.

								}
							},
							zlevel: 1 //柱状图所有图形的 zlevel 值,
						},
						{
							name: '背景色',
							type: 'bar',
							barWidth: 8,
							barGap: '-100%',
							data: this.dataArea.fullData,
							label: { //图形上的文本标签
								show: true,
								position: 'right', //标签的位置
								offset: [0, 0], //标签文字的偏移,此处表示向上偏移40
								formatter: function(data) {
									var traceValue;

									for (var i = 0; i < categoryData.length; i++) {
										if (data.name === categoryData[i]) {
											traceValue = valueData[i]
											break
										}
									}
									var arr = [
										'{a|' + traceValue + '}',
										'{b|亩}'
									]
									return arr.join('');
								},
								textStyle: {
									rich: {
										a: {
											fontSize: 12,
											color: '#FFFFFF',
											padding: [0, 0, 0, 10],
										},
										b: {
											fontSize: 12,
											color: '#FFFFFF',
											padding: [0, 0, 0, 5],
										},
									}
								},
							},
							itemStyle: {
								normal: {
									color: 'rgb(60, 83, 110,0.35)',
									barBorderRadius: 4, //柱条圆角半径,单位px.
								},

							},
						},
					]
				};
				this.myChartArea.setOption(this.option)
				this.myChartArea.on('mouseover', this.stop)
				this.myChartArea.on('mouseout', this.goMove)
				this.autoMove()
				window.addEventListener("resize", () => {
					this.myChartArea.resize();
				});

			},
			//自动滚动
			autoMove() {
				this.timeOut = setInterval(() => {
					if (Number(this.option.dataZoom[0].endValue) === this.dataArea.valueData.length - 1) {
						this.option.dataZoom[0].endValue = 4;
						this.option.dataZoom[0].startValue = 0;
					} else {
						this.option.dataZoom[0].endValue = this.option.dataZoom[0].endValue + 1;
						this.option.dataZoom[0].startValue = this.option.dataZoom[0].startValue + 1;
					}
					this.myChartArea.setOption(this.option)
				}, 3000);
			},
			//停止滚动
			stop() {
				clearInterval(this.timeOut)
			},
			//继续滚动
			goMove() {
				this.autoMove()
			},


 779
779


 被折叠的 条评论
为什么被折叠?
被折叠的 条评论
为什么被折叠?
 到【灌水乐园】发言


