


 本文详细介绍了如何使用PowerPoint进行图表操作,包括获取图表系列和点数据,设置数据标签的显示方式,调整数据标记样式,以及图表图例的布局。通过具体代码示例,读者可以学习如何定制图表以满足各种展示需求。
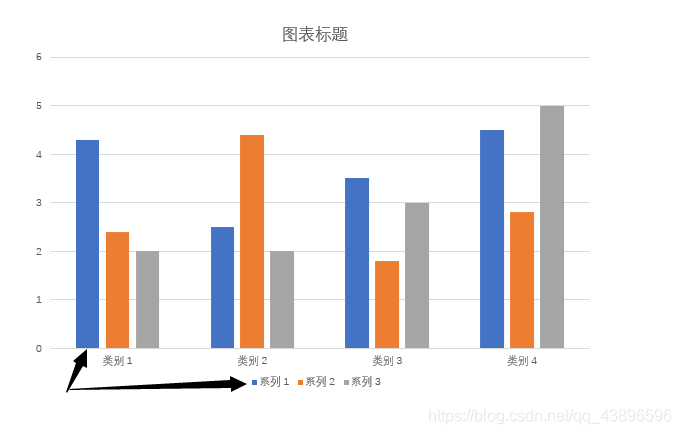
1.获取图表的每个系列,并获取到每个点(如图,该图表有3个系列,每个系列有4个点)
PowerPoint.SeriesCollection seriesCollection = chart.SeriesCollection();
//获取图表的所有系列
	for (int seriesItem = 1; seriesItem <= seriesCollection.Count; seriesItem++)  //系列Count = 3
	{
		Series series = seriesCollection.Item(seriesItem); //获取第seriesItem个系列
		PowerPoint.Points points = series.Points();  //数据点 Count = 4
		for (int i = 1; i <= points.Count; i++)
		{
			PowerPoint.Point point = series.Points(i); //获取第i个点
		}
	}
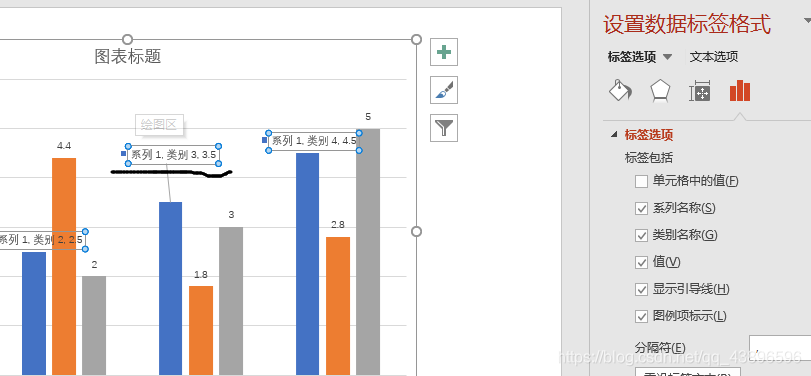
2.设置某一个点的数据标签,如图
point.HasDataLabel = true;  //设置数据标签之前需要保证HasDataLabel为True
point.DataLabel.ShowValue = true;   //显示数据标签的值
point.DataLabel.ShowSeriesName = true;   //设置数据标签的系列名
point.DataLabel.ShowCategoryName = true; //设置数据标签的分类名
point.DataLabel.ShowLegendKey = true;  //设置数据标签的图例项标
3.设置数据标签的引导线
series.HasLeaderLines = true;
4.设置数据标签的显示位置(不同的图表类型有不同的显示位置)
//柱形图
point.DataLabel.Position = PowerPoint.XlDataLabelPosition.xlLabelPositionInsideEnd; //在数据点的上边缘内测
point.DataLabel.Position = PowerPoint.XlDataLabelPosition.xlLabelPositionCenter; //在数据点的内侧中心
point.DataLabel.Position = PowerPoint.XlDataLabelPosition.xlLabelPositionOutsideEnd; //默认标签显示的位置,在数据点上边缘外测
//折线图
point.DataLabel.Position = PowerPoint.XlDataLabelPosition.xlLabelPositionAbove;  //数据标签显示在数据点的上方
point.DataLabel.Position = PowerPoint.XlDataLabelPosition.xlLabelPositionBelow;  //数据标签显示在数据点的上方
5.折线图的数据标记的类型
point.MarkerStyle = PowerPoint.XlMarkerStyle.xlMarkerStyleNone;  //没有数据标记
point.MarkerStyle = PowerPoint.XlMarkerStyle.xlMarkerStyleDiamond; //菱形标记
point.MarkerStyle = PowerPoint.XlMarkerStyle.xlMarkerStyleCircle;  //圆形数据标记
point.MarkerStyle = PowerPoint.XlMarkerStyle.xlMarkerStyleTriangle;  //三角形数据标记
point.MarkerStyle = PowerPoint.XlMarkerStyle.xlMarkerStyleSquare;  //正方形标记
point.MarkerSize = 20;// 设置数据标记的大小
point.MarkerBackgroundColor = 0;//设置数据标记的背景颜色为黑色
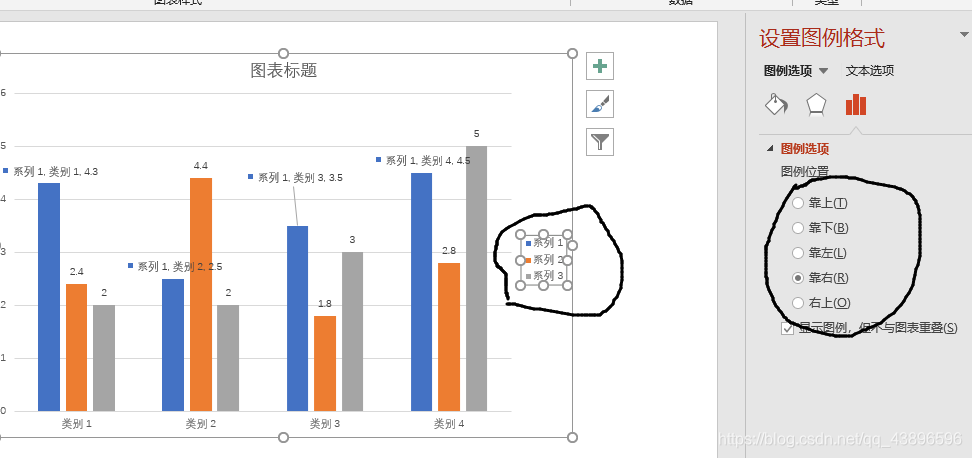
6.设置图表数据系列的显示位置
chart.HasLegend = True; //设置显示图表的图例
chart.Legend.Position = XlLegendPosition.xlLegendPositionBottom; //指定图例在图表的下方
chart.Legend.Position = XlLegendPosition.xlLegendPositionTop; //指定图例在图表的上方
//更多的显示位置参考该网址
https://docs.microsoft.com/zh-cn/office/vba/api/powerpoint.xllegendposition


 426
426

 被折叠的 条评论
为什么被折叠?
被折叠的 条评论
为什么被折叠?
 到【灌水乐园】发言


