


1、横坐标特别多,如何处理为需要的间隔
2、横纵坐标与折线图的距离的问题
3、折点上的数据显示位置设置
4、面积内的渐变色设置
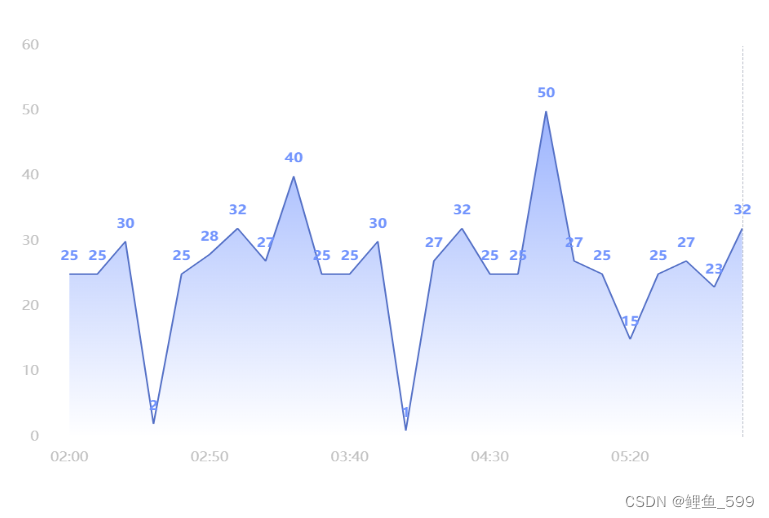
效果图
完整代码
<template>
  <div id="test_app">
    <!--echarts的容器-->
    <div id="main"></div>
  </div>
</template>

<script>
import * as echarts from 'echarts'
export default {
  // name: '',
  data () {
    return {
      charts: ''
    }
  },
  methods: {
    // 传入div的ID
    drawLine (id) {
      // 数据
      const opinionData = [25, 25, 30, 2, 25,
        +28, 32, 27, 40, 25, 25, 30, 1,
        +27, 32, 25, 25, 50, 27, 25, 15,
        +25, 27, 23, 32]
      const datax = ['02:00', '02:10', '02:20', '02:30', '02:40', '02:50',
        +'03:00', '03:10', '03:20', '03:30', '03:40', '03:50',
        +'04:00', '04:10', '04:20', '04:30', '04:40', '04:40',
        +'05:00', '05:10', '05:20', '05:30', '05:40', '05:50',
        +'06:00']
      this.charts = echarts.init(document.getElementById(id))
      this.charts.setOption({
        title: {
          // left: '3%',
          // top: '5%',
          // text: '标题'
        },
        tooltip: {
          // 鼠标悬停提示内容
          trigger: 'axis'
        },
        grid: {
          left: '5%',
          right: '5%',
          bottom: '5%',
          containLabel: true
        },
        xAxis: {
          type: 'category',
          // boundaryGap: true,
          axisTick: {
            show: false,
            alignWithLabel: true // 保证刻度线和标签对齐
          },
          axisLine: {
            show: false // 不显示坐标轴线
          },
          axisLabel: {
            interval: datax.length > 15 ? 4 : 0,
            // interval: Math.trunc(datax.length / 4),
            textStyle: {
              color: 'rgb(191, 191, 191)'
            },
            fontSize: 18,
            margin: 20
          },
          data: datax // x坐标的名称
        },
        yAxis: {
          type: 'value',
          boundaryGap: true,
          // 取到最大值往上加是10
          max: Math.max.apply(null, opinionData) + 10,
          interval: 10, // 强制设置坐标轴分割间隔
          axisLabel: {
            textStyle: {
              color: 'rgb(191, 191, 191)'
            },
            fontSize: 18,
            margin: 20
          },
          splitLine: {
            show: false // 不显示网格线
          }
        },

        series: [{
          name: '数值',
          symbol: 'circle',
          symbolSize: 0,
          type: 'line',
          data: opinionData,
          areaStyle: {
            // 显示区域颜色---渐变效果
            color: {
              type: 'linear',
              x: 0,
              y: 0,
              x2: 0,
              y2: 1,
              colorStops: [{
                offset: 0, color: '#7294FD' // 0% 处的颜色
              }, {
                offset: 1, color: '#ffffff' // 100% 处的颜色
              }],
              global: false // 缺省为 false
            }
          },
          label: {
            normal: {
              formatter: '{c}',
              show: true,
              position: 'top',
              distance: 15
            }
          },
          itemStyle: {
            color: 'rgb(125, 140, 241)', // 改变折线点的颜色
            lineStyle: {
              color: '#7294FD' // 改变折线颜色
            },
            normal: {
              label: {
                show: true,
                textStyle: {
                  color: '#7294FD',
                  fontWeight: 600,
                  fontSize: 18,
                  position: 'top', // 定位在拐点下面
                  distance: 115 // 偏移量,举例拐点多少
                } // 拐点文字样式
              }
            },
            emphasis: { // 鼠标经过时
              color: '#E60012'
            }
          }
        }]
      })
    }
  },
  // 调用
  mounted () {
    this.$nextTick(function () {
      this.drawLine('main')
    })
  }
}
</script>

<style scoped>
/* * {
  margin: 0;
  padding: 0;
  list-style: none;
} */
.test_app {
  width: 340px;
  align-items: center;
  background-color: rgb(176, 196, 253);
  display: flex;
  justify-items: center;
}
#main {
  width: 1000px;
  height: 680px;
  background:#fff
}
</style>


 1万+
1万+


 被折叠的 条评论
为什么被折叠?
被折叠的 条评论
为什么被折叠?
 到【灌水乐园】发言


