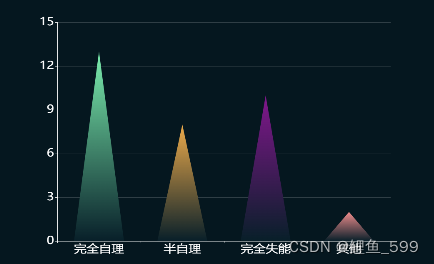
vue3 echarts绘制柱状图,三角形的柱子,每个柱子不一样的颜色且渐变
<template>
  <div class="hechart" ref="mychart"></div>
</template>

<script setup>
import * as echarts from 'echarts'
import { onMounted, getCurrentInstance, watch } from 'vue'
let currentInstance = ''
currentInstance = getCurrentInstance()
const props = defineProps({
  cData: {
    type: Object
  }
})
onMounted(() => {
  initCharts()
  setOptions()
})
watch(props.cData, (newValue, oldValue) => {
  console.log('数据发生变化', newValue, oldValue)
  setOptions()
})
let chart = ''
const initCharts = () => {
  chart = echarts.init(currentInstance.ctx.$refs.mychart)
  window.addEventListener('resize', function () {
    chart.resize()
  })
}
const setOptions = () => {
  const cData = JSON.parse(JSON.stringify(props.cData))
  console.log('传入的三角柱状图数据', cData)
  // 基本柱状图
  const option = {
    xAxis: {
      data: cData.xData,
      axisLabel: {
        textStyle: {
          fontSize: 30,
          color: '#ffffff'
        }
      },
      axisLine: {
        lineStyle: {
          color: '#FFFFFF',
          width: 1 // 这里是为了突出显示加上的
        }
      }
    },
    yAxis: {
      axisLabel: { // 坐标轴文本标签
        textStyle: {
          fontSize: 30,
          color: '#ffffff'
        }
      },
      axisLine: {
        lineStyle: {
          color: '#FFFFFF',
          width: 1
        }
      },
      splitLine: {
        show: true,
        lineStyle: {
          color: 'rgba(255, 255, 255, 0.2)',
          width: 1,
          type: 'solid'
        }
      }
    },
    series: [{
      type: 'pictorialBar',
      data: cData.yData,
      barWidth: '60%',
      barCategoryGap: '10%',
      symbol: 'triangle',
      itemStyle: {
        normal: {
          color: function (params) {
            console.log(params)
            const colorList = [
              ['rgb(124, 239, 175)', 'rgb(8, 31, 41)'],
              ['rgb(237, 171, 75)', 'rgb(8, 31, 41)'],
              ['rgb(129, 23, 140)', 'rgb(8, 31, 41)'],
              ['rgb(239, 140, 140)', 'rgb(8, 31, 41)']
            ]
            const colorItem = colorList[params.dataIndex]
	        // 线性渐变,前四个参数分别是 x0, y0, x2, y2, 范围从 0 - 1,分别表示右,下,左,上。例如(0,0,0,1)表示从正上开始向下渐变;如果是(1,0,0,0),则是从正右开始向左渐变。
	        // 相当于在图形包围盒中的百分比,如果最后一个参数传 true,则该四个值是绝对的像素位置
            return new echarts.graphic.LinearGradient(0, 0, 0, 1, [{
              offset: 0,
              color: colorItem[0]
            },
            {
              offset: 1,
              color: colorItem[1]
            }
            ], false)
          }
        }
      }
    }]
  }
  console.log(option)
  chart.setOption(option)
}
</script>

<style lang="less">
.hechart {
  width: 1000px;
  height: 720px;
}
</style>


 552
552


 被折叠的 条评论
为什么被折叠?
被折叠的 条评论
为什么被折叠?
 到【灌水乐园】发言


