


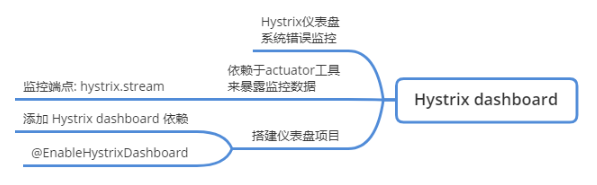
hystrix 对请求的降级和熔断,可以产生监控信息,hystrix dashboard可以实时的进行监控
sp07-hystrix项目添加actuator,并暴露 hystrix监控端点
actuator 是 spring boot 提供的服务监控工具,提供了各种监控信息的监控端点
management.endpoints.web.exposure.include 配置选项,
可以指定端点名,来暴露监控端点
如果要暴露所有端点,可以用 “*”

1.pom.xml添加actuator依赖
<dependency>
	<groupId>org.springframework.boot</groupId>
	<artifactId>spring-boot-starter-actuator</artifactId>
</dependency>
2.调整 application.yml 配置,并暴露 hystrix.stream 监控端点
server:
  port: 3001
spring:
  application:
    name: hystrix-server
eureka:
  client:
    service-url:
      defaultZone: http://eureka1:2001/eureka,http://eureka2:2002/eureka
ribbon:
  MaxAutoRetriesNextServer: 2
  MaxAutoRetried: 1
hystrix:
  command:
    default:
      execution:
        isolation:
          thread:
            timeoutInMilliseconds: 500
management:
  endpoints:
    web:
      exposure:
        include: hystrix.stream
3.访问 actuator 路径,查看监控端点
Hystrix dashboard 仪表盘
1.新建项目

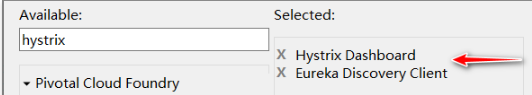
2.pom.xml
<?xml version="1.0" encoding="UTF-8"?>
<project xmlns="http://maven.apache.org/POM/4.0.0" xmlns:xsi="http://www.w3.org/2001/XMLSchema-instance"
         xsi:schemaLocation="http://maven.apache.org/POM/4.0.0 https://maven.apache.org/xsd/maven-4.0.0.xsd">
    <modelVersion>4.0.0</modelVersion>
    <parent>
        <groupId>org.springframework.boot</groupId>
        <artifactId>spring-boot-starter-parent</artifactId>
        <version>2.3.2.RELEASE</version>
        <relativePath/> <!-- lookup parent from repository -->
    </parent>
    <groupId>cn.tedu</groupId>
    <artifactId>sp08-hystrix-dashboard</artifactId>
    <version>0.0.1-SNAPSHOT</version>
    <name>sp08-hystrix-dashboard</name>
    <description>Demo project for Spring Boot</description>

    <properties>
        <java.version>1.8</java.version>
        <spring-cloud.version>Hoxton.SR4</spring-cloud.version>
    </properties>

    <dependencies>
        <dependency>
            <groupId>org.springframework.cloud</groupId>
            <artifactId>spring-cloud-starter-netflix-eureka-client</artifactId>
        </dependency>
        <dependency>
            <groupId>org.springframework.cloud</groupId>
            <artifactId>spring-cloud-starter-netflix-hystrix-dashboard</artifactId>
        </dependency>

        <dependency>
            <groupId>org.springframework.boot</groupId>
            <artifactId>spring-boot-starter-test</artifactId>
            <scope>test</scope>
            <exclusions>
                <exclusion>
                    <groupId>org.junit.vintage</groupId>
                    <artifactId>junit-vintage-engine</artifactId>
                </exclusion>
            </exclusions>
        </dependency>
    </dependencies>

    <dependencyManagement>
        <dependencies>
            <dependency>
                <groupId>org.springframework.cloud</groupId>
                <artifactId>spring-cloud-dependencies</artifactId>
                <version>${spring-cloud.version}</version>
                <type>pom</type>
                <scope>import</scope>
            </dependency>
        </dependencies>
    </dependencyManagement>

    <build>
        <plugins>
            <plugin>
                <groupId>org.springframework.boot</groupId>
                <artifactId>spring-boot-maven-plugin</artifactId>
            </plugin>
        </plugins>
    </build>

</project>
3.application.yml
spring:
  application:
    name: hystrix-dashboard

server:
  port: 4001

eureka:
  client:
    service-url:
      defaultZone: http://eureka1:2001/eureka, http://eureka2:2002/eureka
4.主程序添加 @EnableHystrixDashboard 和 @EnableDiscoveryClient
@EnableDiscoveryClient
@EnableHystrixDashboard
@SpringBootApplication
public class Sp08HystrixDashboardApplication {

	public static void main(String[] args) {
		SpringApplication.run(Sp08HystrixDashboardApplication.class, args);
	}

}
5.启动并测试
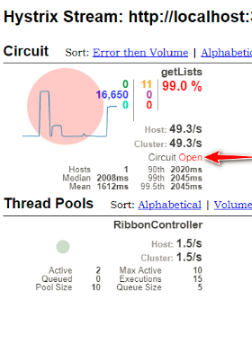
访问 hystrix dashboard

填入 hystrix 的监控端点,开启监控
- http://localhost:3001/actuator/hystrix.stream

- 通过 hystrix 访问服务多次,观察监控信息
http://localhost:3001/item-service/35

hystrix 熔断
整个链路达到一定的阈值,默认情况下,10秒内产生超过20次请求,则符合第一个条件。
满足第一个条件的情况下,如果请求的错误百分比大于阈值,则会打开断路器,默认为50%。
Hystrix的逻辑,先判断是否满足第一个条件,再判断第二个条件,如果两个条件都满足,则会开启断路器
断路器打开 5 秒后,会处于半开状态,会尝试转发请求,如果仍然失败,保持打开状态,如果成功,则关闭断路器
- 断路器状态为 Open,所有请求会被短路,直接降级执行 fallback 方法
hystrix 配置
https://github.com/Netflix/Hystrix/wiki/Configuration
-
hystrix.command.default.execution.isolation.thread.timeoutInMilliseconds
请求超时时间,超时后触发失败降级 -
hystrix.command.default.circuitBreaker.requestVolumeThreshold
10秒内请求数量,默认20,如果没有达到该数量,即使请求全部失败,也不会触发断路器打开 -
hystrix.command.default.circuitBreaker.errorThresholdPercentage
失败请求百分比,达到该比例则触发断路器打开 -
hystrix.command.default.circuitBreaker.sleepWindowInMilliseconds
断路器打开多长时间后,再次允许尝试访问(半开),仍失败则继续保持打开状态,如成功访问则关闭断路器,默认 5000


 462
462


 被折叠的 条评论
为什么被折叠?
被折叠的 条评论
为什么被折叠?
 到【灌水乐园】发言


