


- 安装拓展
Jupyter Keymap
然后重启vscode - 在代码之前加上这个代码,利用jupyter一行一行运行
# %% - 点击Run Cell即可运行
# %%
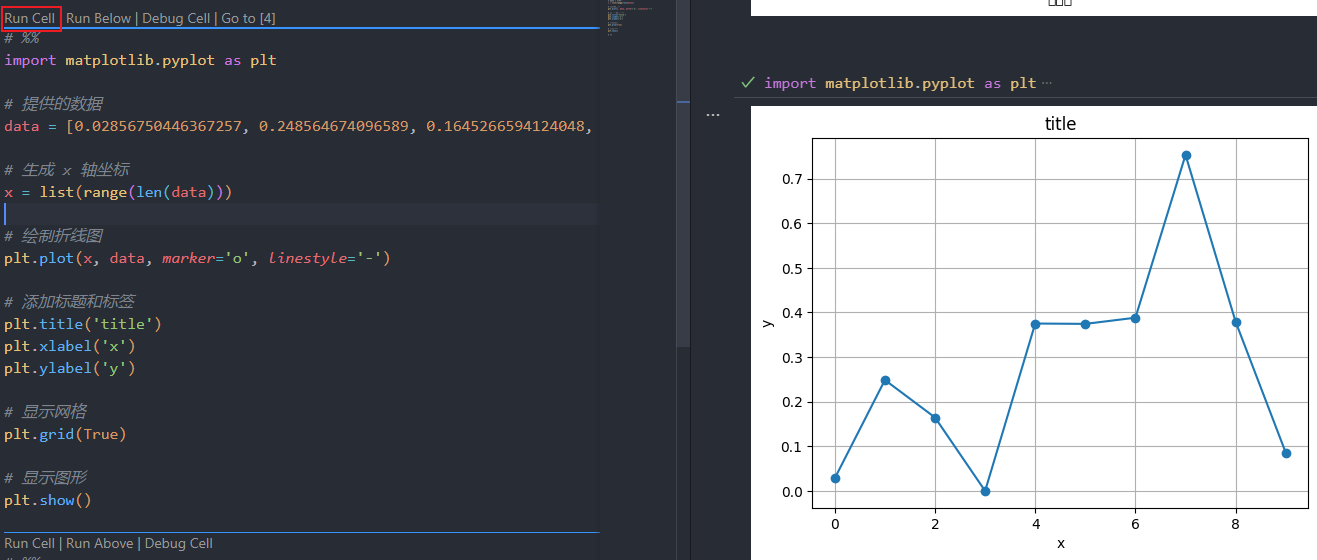
import matplotlib.pyplot as plt
# 提供的数据
data = [0.02856750446367257, 0.248564674096589, 0.1645266594124048, 0, 0.37510894195572597, 0.37431360585723, 0.38815374921235035, 0.7529296875, 0.3791038612430312, 0.08570251339101771]
# 生成 x 轴坐标
x = list(range(len(data)))
# 绘制折线图
plt.plot(x, data, marker='o', linestyle='-')
# 添加标题和标签
plt.title('title')
plt.xlabel('x')
plt.ylabel('y')
# 显示网格
plt.grid(True)
# 显示图形
plt.show()
# %%
错误排查:
- 已经安装了matplotlib
- 报错
Running cells with '****' requires the ipykernel package.
Run the following command to install 'ipykernel' into the Python environment.
Command: 'conda install -n dassl ipykernel --update-deps --force-reinstall'
解决:在当前***的环境下,安装ipykernel 包
conda install -n dassl ipykernel --update-deps --force-reinstall


 1489
1489

 被折叠的 条评论
为什么被折叠?
被折叠的 条评论
为什么被折叠?
 到【灌水乐园】发言


