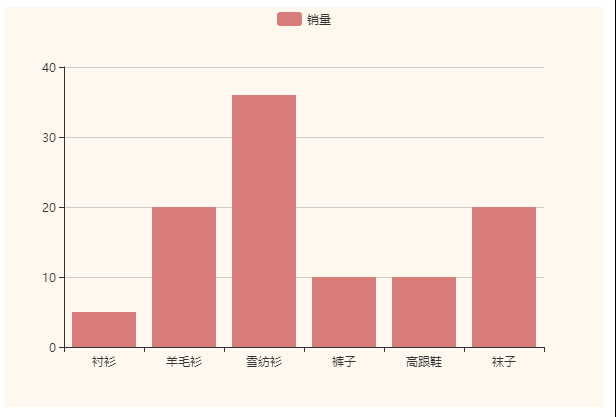
主题
- 引入主题的步骤
- 如果引入的是系统内置的主题 light dark直接在init方法第二个参数的位置填入
- 引入其他主题需要先引入对应的js文件,然后init方法第二个参数放置
- 图表代码
<!DOCTYPE html>
<html>
<head>
<meta charset="utf-8">
<title>主题使用</title>
<script src="js/lib/echarts.min.js" type="text/javascript" charset="utf-8"></script>
<script src="js/theme/shine.js"></script>
</head>
<body>
<div id="main" style="width: 600px;height:400px;"></div>
<script type="text/javascript">
var myChart = echarts.init(document.querySelector('div'),'vintage');
var option = {
legend: {
data:['销量']
},
xAxis: {
type:'category',
data: ["衬衫","羊毛衫","雪纺衫","裤子","高跟鞋","袜子"]
},
yAxis: {
type:'value',
},
series: [
{
name: '销量',
type: 'bar',
data: [5, 20, 36, 10, 10, 20],
}
]
};
myChart.setOption(option);
</script>
</body>
</html>
(function (root, factory) {
if (typeof define === 'function' && define.amd) {
define(['exports', 'echarts'], factory);
} else if (typeof exports === 'object' && typeof exports.nodeName !== 'string') {
factory(exports, require('echarts'));
} else {
factory({}, root.echarts);
}
}(this, function (exports, echarts) {
var log = function (msg) {
if (typeof console !== 'undefined') {
console && console.error && console.error(msg);
}
};
if (!echarts) {
log('ECharts is not Loaded');
return;
}
var colorPalette = ['#d87c7c','#919e8b', '#d7ab82', '#6e7074','#61a0a8','#efa18d', '#787464', '#cc7e63', '#724e58', '#4b565b'];
echarts.registerTheme('vintage', {
color: colorPalette,
backgroundColor: '#fef8ef',
graph: {
color: colorPalette
}
});
}));
调色盘
主题调色盘
全局调色盘
var option = {
color:['red','green','blue','skyblue','purple'],
}
局部调色盘
var option = {
series:[
{
color:['pink','yellow','black','orange','red'],
}
]
}
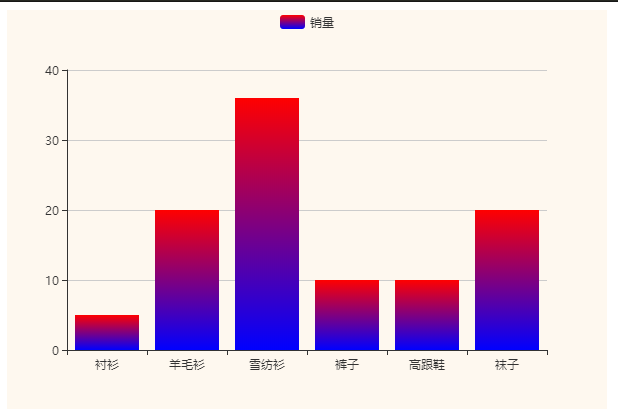
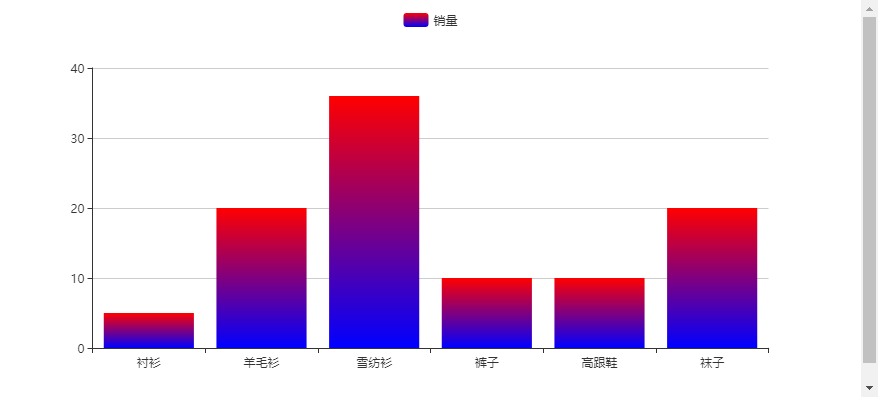
颜色渐变
线性渐变
series: [
{
name: '销量',
type: 'bar',
data: [5, 20, 36, 10, 10, 20],
itemStyle:{
color:{
type:'linear',
x:0,
y:0,
x2:0,
y2:1,
colorStops:[
{
offset:0,color:'red'
},
{
offset:1,color:'blue'
}
]
}
}
}
]
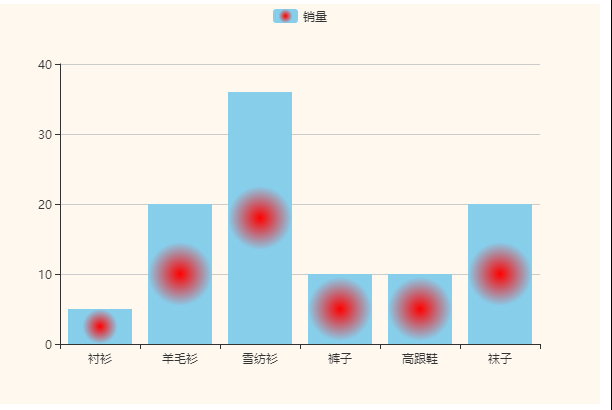
径向渐变
series: [
{
name: '销量',
type: 'bar',
data: [5, 20, 36, 10, 10, 20],
itemStyle:{
color:{
type:'linear',
x:0,
y:0,
x2:0,
y2:1,
colorStops:[
{
offset:0,color:'red'
},
{
offset:1,color:'blue'
}
]
}
}
}
]
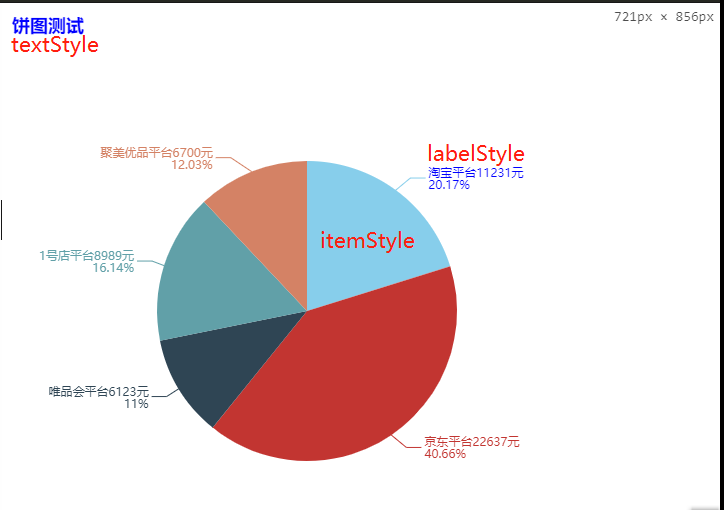
样式
直接样式
- itemStyle
- textStyle
- lineStyle
- areaStyle
- label
<!DOCTYPE html>
<html lang="en">
<head>
<meta charset="UTF-8">
<meta name="viewport" content="width=device-width, initial-scale=1.0">
<meta http-equiv="X-UA-Compatible" content="ie=edge">
<title>样式</title>
<script src="js/lib/echarts.min.js"></script>
</head>
<body>
<div style="width: 600px;height:600px"></div>
<script>
var mCharts = echarts.init(document.querySelector("div"))
var peiData = [
{
name:'淘宝',
value:11231,
itemStyle:{
color:'skyblue'
},
label:{
color:'blue'
}
},
{
name:'京东',
value:22637
},
{
name:'唯品会',
value:6123
},
{
name:'1号店',
value:8989
},
{
name:'聚美优品',
value:6700
}
]
var option = {
title:{
text:'饼图测试',
textStyle:{
color:'blue'
}
},
series:[
{
type:'pie',
data: peiData,
label:{
show:true,
formatter:function(arg){
console.log(arg);
return arg.name+'平台'+arg.value+'元\n' +arg.percent+'%'
}
},
radius:'50%',
selectedMode:'multiple',
selectedOffset:30
}
]
}
mCharts.setOption(option)
</script>
</body>
</html>
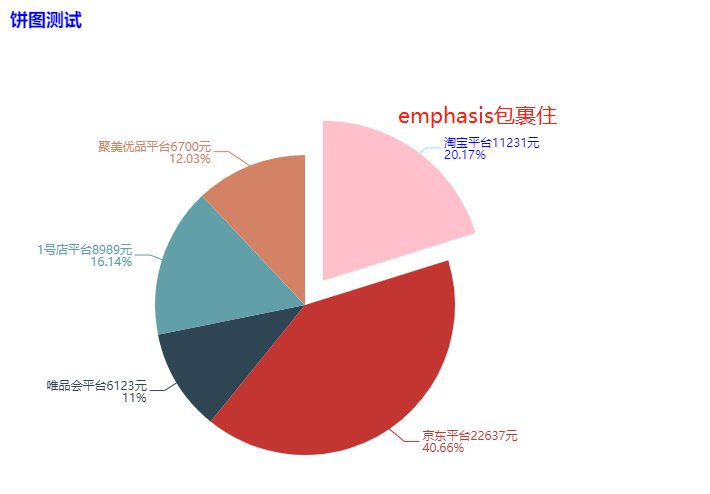
高亮样式
<!DOCTYPE html>
<html lang="en">
<head>
<meta charset="UTF-8">
<meta name="viewport" content="width=device-width, initial-scale=1.0">
<meta http-equiv="X-UA-Compatible" content="ie=edge">
<title>样式</title>
<script src="js/lib/echarts.min.js"></script>
</head>
<body>
<div style="width: 600px;height:600px"></div>
<script>
var mCharts = echarts.init(document.querySelector("div"))
var peiData = [
{
name:'淘宝',
value:11231,
itemStyle:{
color:'skyblue'
},
label:{
color:'blue'
},
emphasis:{
itemStyle:{
color:'pink'
},
label:{
color:'blue'
},
}
},
{
name:'京东',
value:22637
},
{
name:'唯品会',
value:6123
},
{
name:'1号店',
value:8989
},
{
name:'聚美优品',
value:6700
}
]
var option = {
title:{
text:'饼图测试',
textStyle:{
color:'blue'
}
},
series:[
{
type:'pie',
data: peiData,
label:{
show:true,
formatter:function(arg){
console.log(arg);
return arg.name+'平台'+arg.value+'元\n' +arg.percent+'%'
}
},
radius:'50%',
selectedMode:'multiple',
selectedOffset:30
}
]
}
mCharts.setOption(option)
</script>
</body>
</html>
自适应
<!DOCTYPE html>
<html>
<head>
<meta charset="utf-8">
<title>颜色渐变</title>
<script src="js/lib/echarts.min.js" type="text/javascript" charset="utf-8"></script>
</head>
<body>
<div id="main" style="height:400px;"></div>
<script type="text/javascript">
var myChart = echarts.init(document.querySelector('div'));
var option = {
legend: {
data:['销量']
},
xAxis: {
type:'category',
data: ["衬衫","羊毛衫","雪纺衫","裤子","高跟鞋","袜子"]
},
yAxis: {
type:'value',
},
series: [
{
name: '销量',
type: 'bar',
data: [5, 20, 36, 10, 10, 20],
itemStyle:{
color:{
type:'linear',
x:0,
y:0,
x2:0,
y2:1,
colorStops:[
{
offset:0,color:'red'
},
{
offset:1,color:'blue'
}
]
},
}
}
]
};
myChart.setOption(option);
window.onresize = myChart.resize;
</script>
</body>
</html>


 369
369

 被折叠的 条评论
为什么被折叠?
被折叠的 条评论
为什么被折叠?
 到【灌水乐园】发言


