<!DOCTYPE html>
<html lang="en">
<head>
<meta charset="utf-8">
<title>饼图</title>
<meta name="renderer" content="webkit|ie-comp|ie-stand">
<meta name="renderer" content="webkit">
<meta http-equiv="X-UA-Compatible" content="IE=edge,chrome=1" />
<meta name="viewport" content="width=device-width, initial-scale=1, minimum-scale=1, maximum-scale=1">
<script src="js/jquery-3.3.1.min.js"></script>
<script src="js/echarts.js"></script>
</head>
<body>
<!-- 准备一个具备大小(宽高)的 DOM -->
<div id="pin" style="width: 80%;height:600px;margin: 0 10%"></div>
</body>
<script>
// 图标响应式大小
$(document).ready(function() {
$(window).resize(function() {
var _width = $("#pin").width();
myCharte.resize(_width);
console.log(_width);
});
});
// 注册
var myCharte = echarts.init(document.getElementById('pin'));
var colorList = ['#afa3f5', '#00d488', '#3feed4', '#3bafff', '#f1bb4c', "rgba(250,250,250,0.5)"];
var sportsIcon = {
'a': 'img/1.png',
'b': 'img/1.png',
'c': 'img/1.png',
'd': 'img/1.png',
'e': 'img/1.png',
};
option = {
// 标题
title: {
show: true, //是否显示标题组件true/false
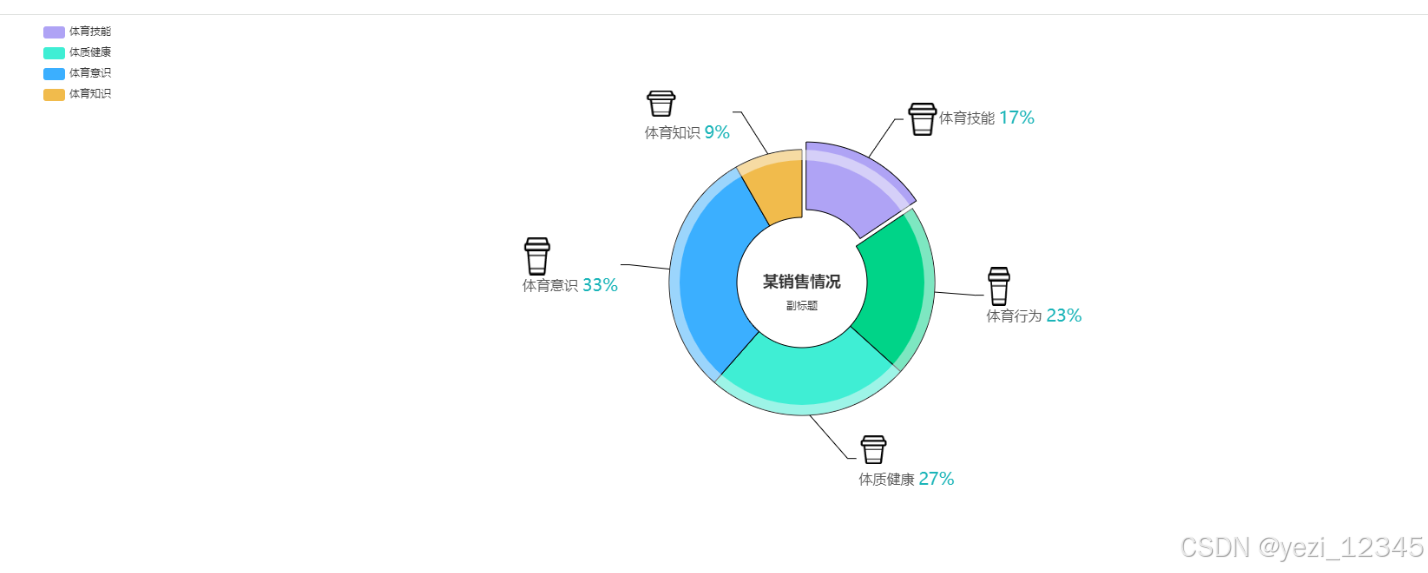
text: '某销售情况', //标题
link: 'https://www.baidu.com/', //标题链接
target: 'blank', //新链接打开方式'self'/'blank'
//主标题样式
textStyle: {
color: '#333',
fontStyle: 'normal',
fontWeight: 600,
fontFamily: 'sans-serif',
fontSize: 18,
},
// 副标题
subtext: '副标题', //副标题
sublink: 'https://www.baidu.com/', //标题链接
subtarget: 'blank', //新链接打开方式'self'/'blank'
//副标题样式
subtextStyle: {
color: '#333',
fontStyle: 'normal',
fontWeight: 'normal',
fontFamily: 'sans-serif',
fontSize: 12,
},
//textAlign: 'center', //字体整体的水平对齐。可选值:'auto'、'left'、'right'、'center'。
//textVerticalAlign: 'center', //字体整体的垂直对齐可选值:'auto'、'top'、'bottom'、'middle'。
// padding: 5,// 设置内边距为 5
// padding: [5, 10],// 设置上下的内边距为 5,左右的内边距为 10
padding: [5, 10, 5, 10], // 上右下左
itemGap: 10, //主副标题之间的间距。
left: 'center', //grid 组件离容器左侧的距离,可选值'auto''left', 'center', 'right'。
top: 'center',
right: 'auto',
bottom: 'auto',
// backgroundColor: '#fff',
// borderColor: '#ccc',
// borderWidth: 0,
// borderRadius: 10,
// shadowColor: 'rgba(0,0,0,0.6)',
// shadowBlur: 10,
// shadowOffsetX: 2,
// shadowOffsetY: 5,
},
//提示框组件。
tooltip: {
trigger: 'item', //数据项图形触发,主要在散点图,饼图等无类目轴的图表中使用。
formatter: "{a} <br/>{b} : {c} ({d}%)"
//模板变量有 {a}, {b},{c},{d},{e},分别表示系列名,数据名,数据值等。 在 trigger 为 'axis' 的时候,会有多个系列的数据,此时可以通过 {a0}, {a1}, {a2} 这种后面加索引的方式表示系列的索引。 不同图表类型下的 {a},{b},{c},{d} 含义不一样。 其中变量{a}, {b}, {c}, {d}在不同图表类型下代表数据含义为:
// 折线(区域)图、柱状(条形)图、K线图 : {a}(系列名称),{b}(类目值),{c}(数值), {d}(无)
// 散点图(气泡)图 : {a}(系列名称),{b}(数据名称),{c}(数值数组), {d}(无)
// 地图 : {a}(系列名称),{b}(区域名称),{c}(合并数值), {d}(无)
// 饼图、仪表盘、漏斗图: {a}(系列名称),{b}(数据项名称),{c}(数值), {d}(百分比)
},
//图例组件。
legend: {
orient: 'vertical',
x: 'left',
data: ['体育技能', '体育技能', '体质健康', '体育意识', '体育知识']
},
//工具栏。内置有导出图片,数据视图,动态类型切换,数据区域缩放,重置五个工具。
toolbox: {
show: true,
orient: 'horizontal', //'horizontal'或者'vertical'
itemSize: 15, //工具栏 icon 的大小。
itemGap: 10, //工具栏 icon 每项之间的间隔。横向布局时为水平间隔,纵向布局时为纵向间隔。
showTitle: true, //是否在鼠标 hover 的时候显示每个工具 icon 的标题。
z: 10,
//各工具配置项
feature: {
// 保存图片
saveAsImage: {
show: true,
type: 'png', //保存的图片格式。支持 'png' 和 'jpeg'。
name: '销售报表', //保存的文件名称
backgroundColor: '#fff', //保存的文件背景
excludeComponents: ['toolbox'], //保存为图片时忽略的组件列表,默认忽略工具栏。
show: true,
title: '保存为图片',
pixelRatio: 2, //保存图片的分辨率比例,默认跟容器相同大小,如果需要保存更高分辨率的,可以设置为大于 1 的值,例如 2。
// icon: 'image://http://xxx.xxx.xxx/a/b.png',
// 图标样式
// iconStyle: {
// //color: 'red',
// // 线性渐变,前四个参数分别是 x0, y0, x2, y2, 范围从 0 - 1,相当于在图形包围盒中的百分比,如果 globalCoord 为 `true`,则该四个值是绝对的像素位置
// color: {
// type: 'linear',
// x: 0,
// y: 0,
// x2: 0,
// y2: 1,
// colorStops: [{
// offset: 0,
// color: 'red' // 0% 处的颜色
// }, {
// offset: 1,
// color: 'blue' // 100% 处的颜色
// }],
// global: false // 缺省为 false
// },
// borderColor: '#666',
// borderWidth: 1,
// borderType: 'solid',
// opacity: 0.5,
// },
},
// 还原刷新
restore: {
show: true,
title: '还原',
},
// 数据区域缩放。目前只支持直角坐标系的缩放。
// dataZoom: { show: true,}
},
},
series: [{
name: '访问来源',
type: 'pie',
center: ['50%', '50%'], //饼图的中心(圆心)坐标,数组的第一项是横坐标,第二项是纵坐标。[ default: ['50%', '50%'] ]
radius: ['25%', '51%'], //饼图的半径,数组的第一项是内半径,第二项是外半径。
hoverAnimation: true, //是否开启 hover 在扇区上的放大动画效果。
hoverOffset: 10, //高亮扇区的偏移距离。
selectedMode: 'single', //选中模式,表示是否支持多个选中,默认关闭,支持布尔值和字符串,字符串取值可选'single','multiple',分别表示单选还是多选。
selectedOffset: 10, //选中扇区的偏移距离。
clockwise: true, //饼图的扇区是否是顺时针排布。
startAngle: 90, //起始角度,支持范围[0, 360]。
minAngle: 0, //最小的扇区角度(0 ~ 360),用于防止某个值过小导致扇区太小影响交互。
roseType: false, //是否展示成南丁格尔图,通过半径区分数据大小。可选择两种模式:
//'radius' 扇区圆心角展现数据的百分比,半径展现数据的大小。
//'area' 所有扇区圆心角相同,仅通过半径展现数据大小。
avoidLabelOverlap: true, //是否启用防止标签重叠策略,默认开启
stillShowZeroSum: false, //是否在数据和为0(一般情况下所有数据为0) 的时候不显示扇区。
//图形上的文本标签,
label: {
normal: {
show: true,
position: 'outside', //'top''left''right''bottom''inside''insideLeft''insideRight''insideTop''insideBottom''insideTopLeft''insideBottomLeft''insideTopRight''insideBottomRight'
// 'outside'饼图扇区外侧,通过视觉引导线连到相应的扇区。'inside'饼图扇区内部。'inner' 同 'inside'。'center'
//formatter: '{b}: ({d}%)'
formatter: function(params) {
var str = '';
switch (params.name) {
case '体育技能':
str = '{a|}{nameStyle|体育技能 }' + '{rate|' + params.value + '%}';
break;
case '体育行为':
str = '{b|}\n{nameStyle|体育行为 }' + '{rate|' + params.value + '%}';
break;
case '体质健康':
str = '{c|}\n{nameStyle|体质健康 }' + '{rate|' + params.value + '%}';
break;
case '体育意识':
str = '{d|}\n{nameStyle|体育意识 }' + '{rate|' + params.value + '%}';
break;
case '体育知识':
str = '{e|}\n{nameStyle|体育知识 }' + '{rate|' + params.value + '%}';
break;
}
return str
},
rich: {
a: {
width: 38,
height: 38,
lineHeight: 50,
backgroundColor: {
image: sportsIcon.e
},
align: 'left'
},
b: {
width: 29,
height: 45,
lineHeight: 50,
backgroundColor: {
image: sportsIcon.d
},
align: 'left'
},
c: {
width: 34,
height: 33,
lineHeight: 50,
backgroundColor: {
image: sportsIcon.c
},
align: 'left'
},
d: {
width: 34,
height: 44,
lineHeight: 50,
backgroundColor: {
image: sportsIcon.b
},
align: 'left'
},
e: {
width: 38,
height: 30,
lineHeight: 50,
backgroundColor: {
image: sportsIcon.a
},
align: 'left'
},
nameStyle: {
fontSize: 16,
color: "#555",
align: 'left'
},
rate: {
fontSize: 20,
color: "#1ab4b8",
align: 'left'
}
}
},
emphasis: {
show: true,
textStyle: {
fontSize: '30',
fontWeight: 'bold'
}
}
},
//标签的视觉引导线样式,在 label 位置 设置为'outside'的时候会显示视觉引导线。
labelLine: {
normal: {
show: true,
length: 50, //视觉引导线第一段的长度。
length2: 10, //视觉引导项第二段的长度。
smooth: false, //是否平滑视觉引导线,默认不平滑,可以设置成 true 平滑显示,也可以设置为 0 到 1 的值,表示平滑程度。
lineStyle: {
color: '#000',
width: 1,
type: 'solid',
},
},
// emphasis: {...},
},
//图形样式,有 normal 和 emphasis 两个状态。normal 是图形在默认状态下的样式;emphasis 是图形在高亮状态下的样式
itemStyle: {
normal: {
color: function(params) {
return colorList[params.dataIndex]
},
borderColor: '#000',
borderWidth: 1,
borderType: 'solid',
},
center: ['50%', '50%'],
radius: [0, '75%'],
},
data: [
// { value: 17,name: '体育技能',selected:true,},
{ value: 17,name: '体育技能'},
{ value: 23, name: '体育行为' },
{ value: 27, name: '体质健康' },
{ value: 33, name: '体育意识' },
{ value: 9, name: '体育知识' }
],
}, // 边框的设置
{
radius: ['47%', '51%'],
center: ['50%', '50%'],
type: 'pie',
label: {
normal: {
show: false
},
emphasis: {
show: false
}
},
labelLine: {
normal: {
show: false
},
emphasis: {
show: false
}
},
animation:true,
tooltip: {
show: false
},
itemStyle: {
normal: {
color: 'rgba(250,250,250,0.5)'
}
},
data: [{
value: 1,
}],
}]
};
// 使用刚指定的配置项和数据显示图表。
myCharte.setOption(option);
var count = 0;
timeTicket = setInterval(function () {
myCharte.dispatchAction({
type: 'pieUnSelect',//取消高亮指定的数据图形。//downplay
seriesIndex: 0
});
myCharte.dispatchAction({
type: 'pieSelect',//高亮指定的数据图形。//highlight
seriesIndex: 0,
dataIndex: (count++) % 5
});
}, 1000);
</script>
</html>


 8179
8179

 被折叠的 条评论
为什么被折叠?
被折叠的 条评论
为什么被折叠?
 到【灌水乐园】发言


