


🏅 前言
划水许久,终于在今天,开始了2022年的第一篇文章。
在想题材之际,打开私信,有许多萌新&小伙伴询问我之前写的一篇《python爬取天气预报数据,并实现数据可视化》中的bug怎么解决,虽然我在之前,就在评论区提供了自己的解决思路,但可能不够清楚,于是写这篇文章,来解决bug,并对程序进行优化。
- 爬取思路可以看之前那篇文章哟:
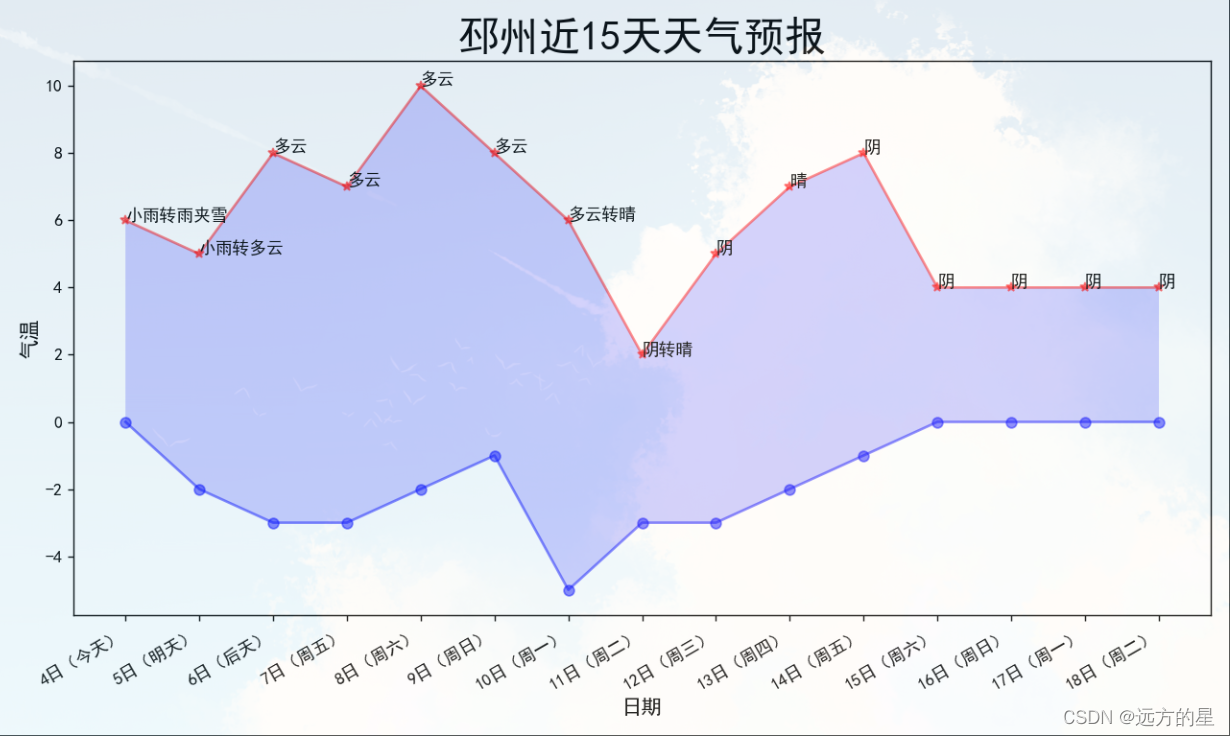
⚔ 结果展示
- 其中:
红线代表当天最高气温,蓝线代表最低气温,最高气温点上的标注为当天的天气情况。
如果使夜晚运行程序,则最高气温和最低气温的点会重合,使由爬取数据产生误差导致的。
⚔ 程序代码
详细请看注释
# -*- coding: UTF-8 -*-
"""
# @Time: 2022/1/4 11:02
# @Author: 远方的星
# @CSDN: https://blog.csdn.net/qq_44921056
"""
import chardet
import requests
from lxml import etree
from fake_useragent import UserAgent
import pandas as pd
from matplotlib import pyplot as plt


# 随机产生请求头
ua = UserAgent(verify_ssl=False, path='D:/Pycharm/fake_useragent.json')


# 随机切换请求头
def random_ua():
    headers = {
        "user-agent": ua.random
    }
    return headers


# 解析页面
def res_text(url):
    res = requests.get(url=url, headers=random_ua())
    res.encoding = chardet.detect(res.content)['encoding']
    response = res.text
    html = etree.HTML(response)
    return html


# 获得未来七天及八到十五天的页面链接
def get_url(url):
    html = res_text(url)
    url_7 = 'http://www.weather.com.cn/' + html.xpath('//*[@id="someDayNav"]/li[2]/a/@href')[0]
    url_8_15 = 'http://www.weather.com.cn/' + html.xpath('//*[@id="someDayNav"]/li[3]/a/@href')[0]
    # print(url_7)
    # print(url_8_15)
    return url_7, url_8_15


# 获取未来七天的天气情况
def get_data_7(url):
    html = res_text(url)
    list_s = html.xpath('//*[@id="7d"]/ul/li')  # 获取天气数据列表
    Date, Weather, Low, High = [], [], [], []
    for i in range(len(list_s)):
        list_date = list_s[i].xpath('./h1/text()')[0]  # 获取日期,如:4日(明天)
        # print(list_data)
        list_weather = list_s[i].xpath('./p[1]/@title')[0]  # 获取天气情况,如:小雨转雨夹雪
        # print(list_weather)
        tem_low = list_s[i].xpath('./p[2]/i/text()')  # 获取最低气温
        tem_high = list_s[i].xpath('./p[2]/span/text()')  # 获取最高气温
        if tem_high == []:  # 遇到夜晚情况,筛掉当天的最高气温
            tem_high = tem_low  # 无最高气温时,使最高气温等于最低气温
        tem_low = int(tem_low[0].replace('℃', '')) # 将气温数据处理
        tem_high = int(tem_high[0].replace('℃', ''))
        # print(type(tem_high))
        Date.append(list_date), Weather.append(list_weather), Low.append(tem_low), High.append(tem_high)
    excel = pd.DataFrame()  # 定义一个二维列表
    excel['日期'] = Date
    excel['天气'] = Weather
    excel['最低气温'] = Low
    excel['最高气温'] = High
    # print(excel)
    return excel


def get_data_8_15(url):
    html = res_text(url)
    list_s = html.xpath('//*[@id="15d"]/ul/li')
    Date, Weather, Low, High = [], [], [], []
    for i in range(len(list_s)):
        # data_s[0]是日期,如:周二(11日),data_s[1]是天气情况,如:阴转晴,data_s[2]是最低温度,如:/-3℃
        data_s = list_s[i].xpath('./span/text()')
        # print(data_s)
        date = modify_str(data_s[0])  # 获取日期情况
        weather = data_s[1]
        low = int(data_s[2].replace('/', '').replace('℃', ''))
        high = int(list_s[i].xpath('./span/em/text()')[0].replace('℃', ''))
        # print(date, weather, low, high)
        Date.append(date), Weather.append(weather), Low.append(low), High.append(high)
    # print(Date, Weather, Low, High)
    excel = pd.DataFrame()  # 定义一个二维列表
    excel['日期'] = Date
    excel['天气'] = Weather
    excel['最低气温'] = Low
    excel['最高气温'] = High
    # print(excel)
    return excel


# 将8-15天日期格式改成与未来7天一致
def modify_str(date):
    date_1 = date.split('(')
    date_2 = date_1[1].replace(')', '')
    date_result = date_2 + '(' + date_1[0] + ')'
    return date_result


# 实现数据可视化
def get_image(date, weather, high, low):
    # 用来正常显示中文标签
    plt.rcParams['font.sans-serif'] = ['SimHei']
    # 用来正常显示负号
    plt.rcParams['axes.unicode_minus'] = False
    # 根据数据绘制图形
    fig = plt.figure(dpi=128, figsize=(10, 6))
    ax = fig.add_subplot(111)
    plt.plot(date, high, c='red', alpha=0.5, marker='*')
    plt.plot(date, low, c='blue', alpha=0.5, marker='o')
    # 给图表中两条折线中间的部分上色
    plt.fill_between(date, high, low, facecolor='blue', alpha=0.2)
    # 设置图表格式
    plt.title('邳州近15天天气预报', fontsize=24)
    plt.xlabel('日期', fontsize=12)
    # 绘制斜的标签,以免重叠
    fig.autofmt_xdate()
    plt.ylabel('气温', fontsize=12)
    # 参数刻度线设置
    plt.tick_params(axis='both', which='major', labelsize=10)
    # 修改刻度
    plt.xticks(date[::1])
    # 对点进行标注,在最高气温点处标注当天的天气情况
    for i in range(15):
        ax.annotate(weather[i], xy=(date[i], high[i]))
    # 显示图片
    plt.show()


def main():
    base_url = 'http://www.weather.com.cn/weather1d/101190805.shtml'
    url_7, url_8_15 = get_url(base_url)
    data_1 = get_data_7(url_7)
    data_2 = get_data_8_15(url_8_15)
    data = pd.concat([data_1, data_2], axis=0, ignore_index=True)  # ignore_index=True实现两张表拼接,不保留原索引
    get_image(data['日期'], data['天气'], data['最高气温'], data['最低气温'])


if __name__ == '__main__':
    main()
⚔ 期望
这是以一个城市为例的可视化,下次争取做到根据输入的城市进行天气预报可视化📡
⚔ 完善(2022.1.5)
- ①、新增一个函数:
用于根据使用者需要,获取相应城市的名称和编号。
需要注意的是,城市名称在输入时,不要加上“市”,如北京市,输入北京即可;深圳市,输入深圳即可。
函数中用到的本地文件,可用下面的百度网盘链接下载:
链接:https://pan.baidu.com/s/10T8e6mNcL11jsgdW0DwVQw
提取码:ol39
def city_num():
    city = input("请输入您想要查询天气情况的城市:")
    file = pd.read_csv('D:/中国天气城市编号.csv', encoding="utf-8")  # 读取本地文件
    index = file[file['城市'] == '{}'.format(city)].index.tolist()[0]  # 根据城市查找行标签
    num = file.loc[index, '编号']  # 根据行标签和列表签锁定值
    return city, num
- ②、对可视化的细节进行一部分修改:
在图像中可直观看到气温变化,最高气温和最低气温数值,及每天的天气情况 - ③、完善后的结果:
- ④、完善后的源码:
# -*- coding: UTF-8 -*-
"""
# @Time: 2022/1/4 11:02
# @Author: 远方的星
# @CSDN: https://blog.csdn.net/qq_44921056
"""
import chardet
import requests
from lxml import etree
from fake_useragent import UserAgent
import pandas as pd
from matplotlib import pyplot as plt


# 随机产生请求头
ua = UserAgent(verify_ssl=False, path='D:/Pycharm/fake_useragent.json')


# 随机切换请求头
def random_ua():
    headers = {
        "user-agent": ua.random
    }
    return headers


def city_num():
    city = input("请输入您想要查询天气情况的城市:")
    file = pd.read_csv('D:/中国天气城市编号.csv', encoding="utf-8")  # 读取本地文件
    index = file[file['城市'] == '{}'.format(city)].index.tolist()[0]  # 根据城市查找行标签
    num = file.loc[index, '编号']  # 根据行标签和列表签锁定值
    return city, num


# 解析页面
def res_text(url):
    res = requests.get(url=url, headers=random_ua())
    res.encoding = chardet.detect(res.content)['encoding']
    response = res.text
    html = etree.HTML(response)
    return html


# 获得未来七天及八到十五天的页面链接
def get_url(url):
    html = res_text(url)
    url_7 = 'http://www.weather.com.cn/' + html.xpath('//*[@id="someDayNav"]/li[2]/a/@href')[0]
    url_8_15 = 'http://www.weather.com.cn/' + html.xpath('//*[@id="someDayNav"]/li[3]/a/@href')[0]
    # print(url_7)
    # print(url_8_15)
    return url_7, url_8_15


# 获取未来七天的天气情况
def get_data_7(url):
    html = res_text(url)
    list_s = html.xpath('//*[@id="7d"]/ul/li')  # 获取天气数据列表
    Date, Weather, Low, High = [], [], [], []
    for i in range(len(list_s)):
        list_date = list_s[i].xpath('./h1/text()')[0]  # 获取日期,如:4日(明天)
        # print(list_data)
        list_weather = list_s[i].xpath('./p[1]/@title')[0]  # 获取天气情况,如:小雨转雨夹雪
        # print(list_weather)
        tem_low = list_s[i].xpath('./p[2]/i/text()')  # 获取最低气温
        tem_high = list_s[i].xpath('./p[2]/span/text()')  # 获取最高气温
        if tem_high == []:  # 遇到夜晚情况,筛掉当天的最高气温
            tem_high = tem_low  # 无最高气温时,使最高气温等于最低气温
        tem_low = int(tem_low[0].replace('℃', '')) # 将气温数据处理
        tem_high = int(tem_high[0].replace('℃', ''))
        # print(type(tem_high))
        Date.append(list_date), Weather.append(list_weather), Low.append(tem_low), High.append(tem_high)
    excel = pd.DataFrame()  # 定义一个二维列表
    excel['日期'] = Date
    excel['天气'] = Weather
    excel['最低气温'] = Low
    excel['最高气温'] = High
    # print(excel)
    return excel


def get_data_8_15(url):
    html = res_text(url)
    list_s = html.xpath('//*[@id="15d"]/ul/li')
    Date, Weather, Low, High = [], [], [], []
    for i in range(len(list_s)):
        # data_s[0]是日期,如:周二(11日),data_s[1]是天气情况,如:阴转晴,data_s[2]是最低温度,如:/-3℃
        data_s = list_s[i].xpath('./span/text()')
        # print(data_s)
        date = modify_str(data_s[0])  # 获取日期情况
        weather = data_s[1]
        low = int(data_s[2].replace('/', '').replace('℃', ''))
        high = int(list_s[i].xpath('./span/em/text()')[0].replace('℃', ''))
        # print(date, weather, low, high)
        Date.append(date), Weather.append(weather), Low.append(low), High.append(high)
    # print(Date, Weather, Low, High)
    excel = pd.DataFrame()  # 定义一个二维列表
    excel['日期'] = Date
    excel['天气'] = Weather
    excel['最低气温'] = Low
    excel['最高气温'] = High
    # print(excel)
    return excel


# 将8-15天日期格式改成与未来7天一致
def modify_str(date):
    date_1 = date.split('(')
    date_2 = date_1[1].replace(')', '')
    date_result = date_2 + '(' + date_1[0] + ')'
    return date_result


# 实现数据可视化
def get_image(city, date, weather, high, low):
    # 用来正常显示中文标签
    plt.rcParams['font.sans-serif'] = ['SimHei']
    # 用来正常显示负号
    plt.rcParams['axes.unicode_minus'] = False
    # 根据数据绘制图形
    fig = plt.figure(dpi=128, figsize=(10, 6))
    ax = fig.add_subplot(111)
    plt.plot(date, high, c='red', alpha=0.5, marker='*')
    plt.plot(date, low, c='blue', alpha=0.5, marker='o')
    # 给图表中两条折线中间的部分上色
    plt.fill_between(date, high, low, facecolor='blue', alpha=0.2)
    # 设置图表格式
    plt.title('{}近15天天气预报'.format(city), fontsize=24)
    plt.xlabel('日期', fontsize=12)
    # 绘制斜的标签,以免重叠
    fig.autofmt_xdate()
    plt.ylabel('气温', fontsize=12)
    # 参数刻度线设置
    plt.tick_params(axis='both', which='major', labelsize=10)
    # 修改刻度
    plt.xticks(date[::1])
    # 对点进行标注,在最高气温点处标注当天的天气情况
    for i in range(15):
        ax.annotate(weather[i], xy=(date[i], low[i]+1))
        ax.annotate(str(high[i])+'℃', xy=(date[i], high[i]+0.2))
        ax.annotate(str(low[i])+'℃', xy=(date[i], low[i]+0.2))
    # 显示图片
    plt.show()


def main():
    city, num = city_num()
    base_url = 'http://www.weather.com.cn/weather1d/{}.shtml'.format(num)
    url_7, url_8_15 = get_url(base_url)
    data_1 = get_data_7(url_7)
    data_2 = get_data_8_15(url_8_15)
    data = pd.concat([data_1, data_2], axis=0, ignore_index=True)  # ignore_index=True实现两张表拼接,不保留原索引
    get_image(city, data['日期'], data['天气'], data['最高气温'], data['最低气温'])


if __name__ == '__main__':
    main()
如果对你有帮助,记得点个赞👍哟,也是对作者最大的鼓励🙇♂️。
如有不足之处可以在评论区👇多多指正,我会在看到的第一时间进行修正
作者:远方的星
CSDN:https://blog.csdn.net/qq_44921056
本文仅用于交流学习,未经作者允许,禁止转载,更勿做其他用途,违者必究。


 8753
8753


 被折叠的 条评论
为什么被折叠?
被折叠的 条评论
为什么被折叠?
 到【灌水乐园】发言


