


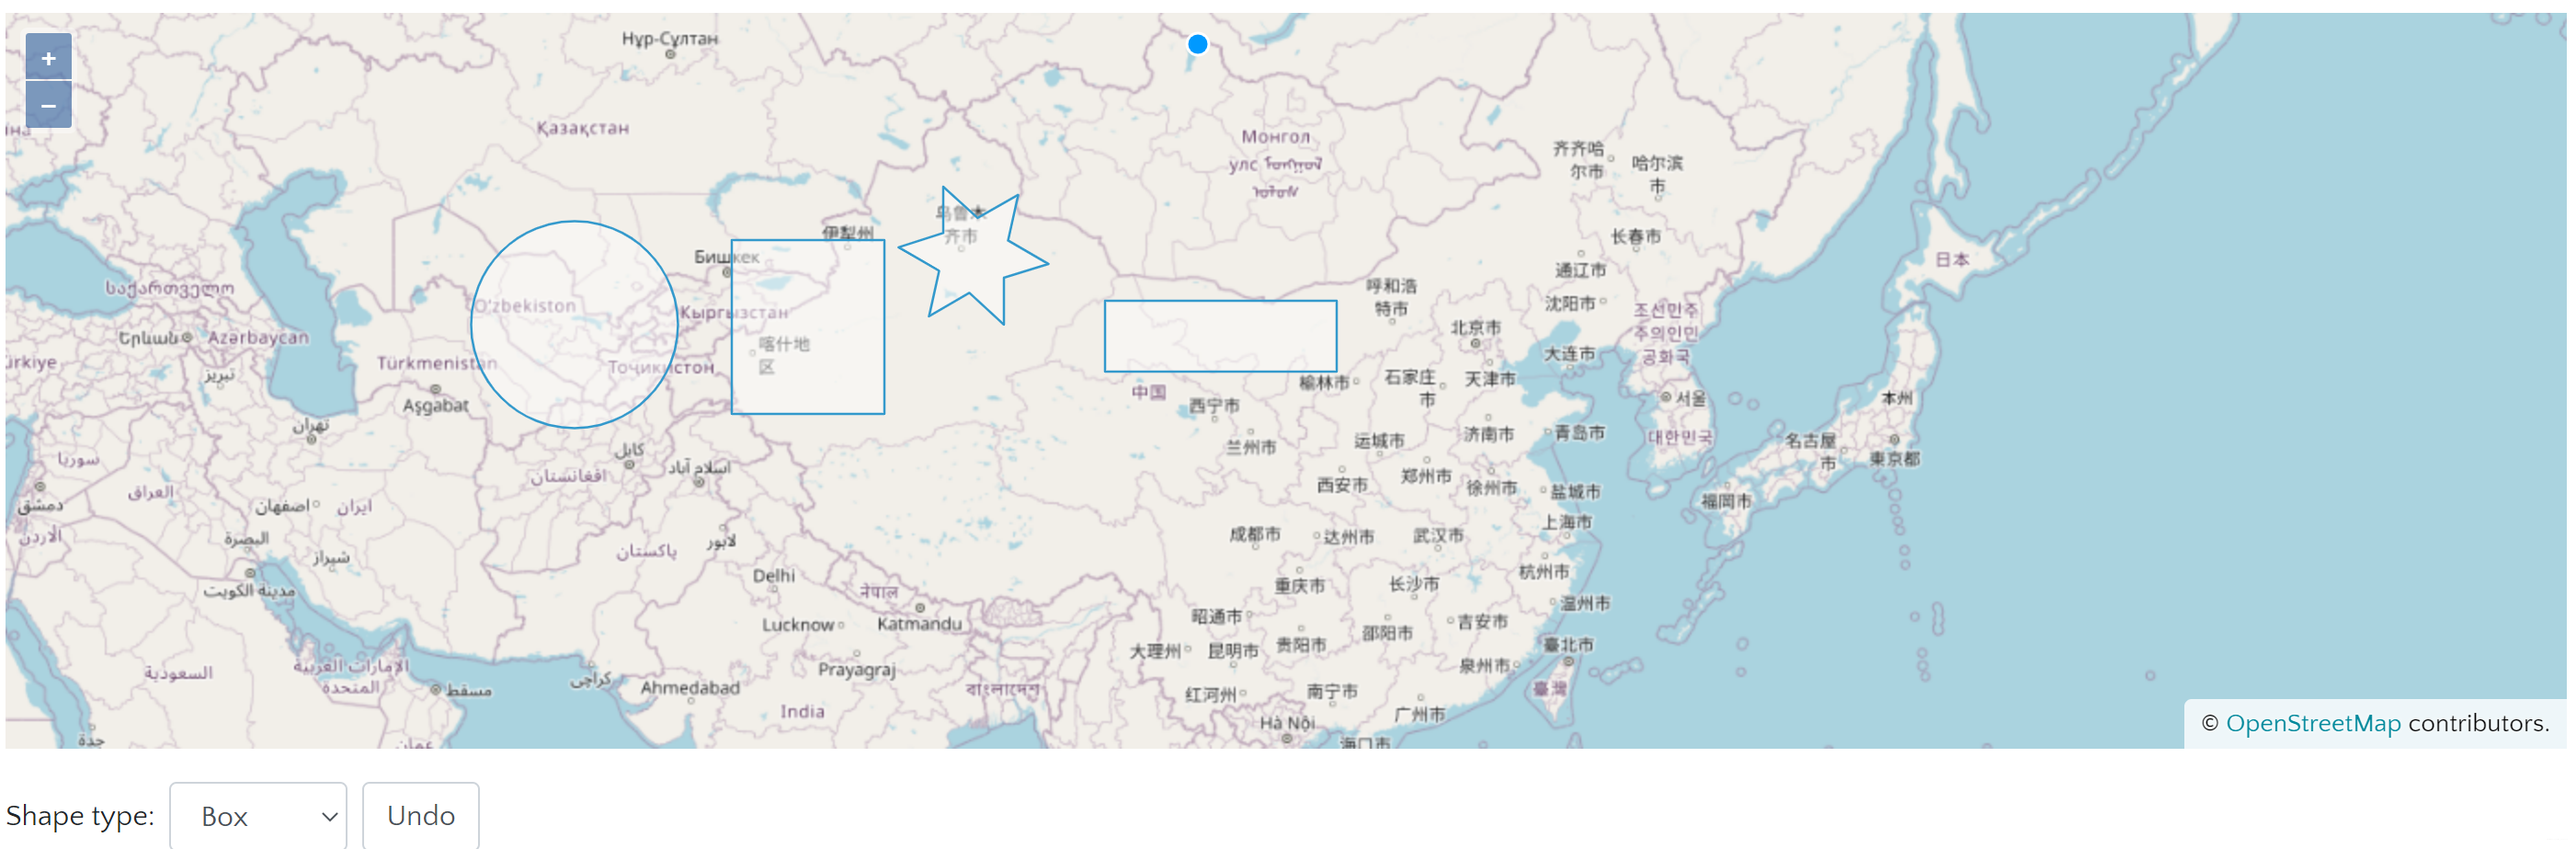
界面展示
界面代码
<!DOCTYPE html>
<html lang="en">
<head>
<meta charset="UTF-8">
<title>Draw Shapes</title>
<!-- Pointer events polyfill for old browsers, see https://caniuse.com/#feat=pointer -->
<script src="https://unpkg.com/elm-pep"></script>
<!-- The line below is only needed for old environments like Internet Explorer and Android 4.x -->
<script src="https://cdn.polyfill.io/v3/polyfill.min.js?features=fetch,requestAnimationFrame,Element.prototype.classList,URL,TextDecoder,Number.isInteger"></script>
<style>
.map {
width: 100%;
height:400px;
}
</style>
</head>
<body>
<div id="map" class="map"></div>
<form class="form-inline">
<label for="type">Shape type: </label>
<select class="form-control mr-2 mb-2 mt-2" id="type">
<option value="Circle">Circle</option>
<option value="Square">Square</option>
<option value="Box">Box</option>
<option value="Star">Star</option>
<option value="None">None</option>
</select>
<input class="form-control mr-2 mb-2 mt-2" type="button" value="Undo" id="undo">
</form>
<script src="main.js"></script>
</body>
</html>
脚本代码
import 'ol/ol.css';
import Draw, {
  createBox,
  createRegularPolygon,
} from 'ol/interaction/Draw';
import Map from 'ol/Map';
import Polygon from 'ol/geom/Polygon';
import View from 'ol/View';
import {OSM, Vector as VectorSource} from 'ol/source';
import {Tile as TileLayer, Vector as VectorLayer} from 'ol/layer';

const raster = new TileLayer({
  source: new OSM(),
});

const source = new VectorSource({wrapX: false});

const vector = new VectorLayer({
  source: source,
});

const map = new Map({
  layers: [raster, vector],
  target: 'map',
  view: new View({
    center: [-11000000, 4600000],
    zoom: 4,
  }),
});

const typeSelect = document.getElementById('type');

let draw; // global so we can remove it later
function addInteraction() {
  let value = typeSelect.value;
  if (value !== 'None') {
    let geometryFunction;
    if (value === 'Square') {
      value = 'Circle';
      geometryFunction = createRegularPolygon(4);
    } else if (value === 'Box') {
      value = 'Circle';
      geometryFunction = createBox();
    } else if (value === 'Star') {
      value = 'Circle';
      geometryFunction = function (coordinates, geometry) {
        const center = coordinates[0];
        const last = coordinates[coordinates.length - 1];
        const dx = center[0] - last[0];
        const dy = center[1] - last[1];
        const radius = Math.sqrt(dx * dx + dy * dy);
        const rotation = Math.atan2(dy, dx);
        const newCoordinates = [];
        const numPoints = 12;
        for (let i = 0; i < numPoints; ++i) {
          const angle = rotation + (i * 2 * Math.PI) / numPoints;
          const fraction = i % 2 === 0 ? 1 : 0.5;
          const offsetX = radius * fraction * Math.cos(angle);
          const offsetY = radius * fraction * Math.sin(angle);
          newCoordinates.push([center[0] + offsetX, center[1] + offsetY]);
        }
        newCoordinates.push(newCoordinates[0].slice());
        if (!geometry) {
          geometry = new Polygon([newCoordinates]);
        } else {
          geometry.setCoordinates([newCoordinates]);
        }
        return geometry;
      };
    }
    draw = new Draw({
      source: source,
      type: value,
      geometryFunction: geometryFunction,
    });
    map.addInteraction(draw);
  }
}

/**
 * Handle change event.
 */
typeSelect.onchange = function () {
  map.removeInteraction(draw);
  addInteraction();
};

document.getElementById('undo').addEventListener('click', function () {
  draw.removeLastPoint();
});

addInteraction();
在本示例中,加载一个矢量图层绘制vector,在实例化此图层对象时统一设置了绘制的几何图形样式,然后通过调用addInteraction()函数加载交互绘制图形控件(ol.interaction.Draw),实现基本几何图形的绘制功能。
交互绘制几何图形的关键是实例化ol.interaction.Draw控件,设置其关键参数,并将此控件添加到地图容器中。直接支持点、线、圆、多边形图形,在创建交互控件时,直接设置控件对象的type参数即可;除此之外,正方形和长方形图形作为规则多边形,需要通过geometryFunction参数单独处理。
ol.interaction.Draw的主要参数:
-
source: 绘制图层的数据源,即承载几何图形要素的数据源。
-
type:绘制的几何图形类型,即ol.geom.GeometryType,包括Point、LineString、Polygon、MultiPoint、MultiLineString、MultiPolygon、Circle。
-
geometryFunction:当几何坐标更新时调用此函数,在此当绘制类型为“正方形”和“长方形”时,需要通过此函数设置其几何对象。所以“正方形”时通过ol.interaction.Draw.createRegularPolygon(4)创建该函数,为“长方形”时则调用多边形(ol.geom.Polygon)的setCoordinates方法设置多边形的几何坐标串。
-
maxPoints:绘制图形结束前多边形或线的最大点数,线默认为2,多边形默认为3。


 1886
1886


 被折叠的 条评论
为什么被折叠?
被折叠的 条评论
为什么被折叠?
 到【灌水乐园】发言


