


1 datetime对象
1.1 获取创建时间
from datetime import datetime
#获取当前的日期和时间
t1 = datetime.now()
print(t1)
#时间类型是datetime
print(type(t1))
#手动创建datetime
t2 = datetime(1970,1,1,23,23)
print(t2)
print(type(t2))
tt = t1-t2
print(tt)
#运算结果的数据类型为timedelta
print(type(tt))
'''
2023-05-10 17:16:53.032930
<class 'datetime.datetime'>
1970-01-01 23:23:00
<class 'datetime.datetime'>
19486 days, 17:53:53.032930
<class 'datetime.timedelta'>

'''
1.2 转换成datetime类型
调用 to_datetime方法 把旧列转换为 datetime类型 赋给新列
参数 format='%m/%d/%Y' 手动指定日期格式
参数 dayfirst=True ,yearfirst=True 设置日期格式以 日或年 开始
import pandas as pd
df = pd.read_csv('.../country_timeseries.csv',encoding="utf-8",sep=',')
print(df)
print(df.info())
df['Dates'] = pd.to_datetime(df['Date'])  #format='%m/%d/%Y'  dayfirst=True  yearfirst=True,
print(df)
print(df.info())
'''
     Date  Day  Cases_Gu  Cases_Ni  Cases_Se  Deaths_Sp
0     1/5/2015  289    2776.0      20.0       1.0        0.0
1     1/4/2015  288    2775.0       NaN       NaN        6.0
0   Date       59 non-null     object

         Date  Day  Cases_Gu  Cases_Ni  Cases_Se  Deaths_Sp      Dates
0     1/5/2015  289    2776.0      20.0       1.0        0.0 2015-01-05
1     1/4/2015  288    2775.0       NaN       NaN        6.0 2015-01-04
 6   Dates      59 non-null     datetime64[ns]
'''
strftime 方法,以创建显示的格式时间字符串
参考整理文章链接:python-strftime:时间字符串的格式化输出_Mr_Vague的博客-CSDN博客
1.3 加载数据集时,直接转类型
使用read_csv加载数据集时,使用parse_dates参数指定需要解析为日期的列
df1 = pd.read_csv('.../country_timeseries.csv',encoding="utf-8",sep=',',parse_dates=[0])
print(df1)
print(df1.info())
'''
 0   Date       59 non-null     datetime64[ns]
'''
2 提取日期的各部分
借助year、month、day属性访问日期各个部分
d = pd.to_datetime('2000-05-15')
print(d)
print(type(d))     #传入字符串,会得到一个TimeStamp对象
print(d.year)      #借助year、month、day属性访问日期各个部分
'''
2000-05-15 00:00:00
<class 'pandas._libs.tslibs.timestamps.Timestamp'>
5
'''dt访问器,在数据集中使用属性建新列
df['hiyear'] = df['Dates'].dt.year
df['himonth'],df['hiday'] = (df['Dates'].dt.month, df['Dates'].dt.day)
print(df[['Dates','hiyear','himonth','hiday']])   #双重赋值语句
print(df.info())    #数据类型也变了
'''
        Dates  hiyear  himonth  hiday
0  2015-01-05    2015        1      5
1  2015-01-04    2015        1      4

   Dates      59 non-null     datetime64[ns]
 7   hiyear     59 non-null     int64
 8   himonth    59 non-null     int64
 9   hiday      59 non-null     int64
'''
3 日期运算
3.1 加减
#该数据集是记录 某日其疫情爆发的天数,该天数的计算可以从当日减去第一天的日期得到
print(df['Dates'].min())    #获取数据集中第一天的日期
df['days'] = df['Dates'] - df['Dates'].min()    #将该日 减去 第一天日期 得到天数
print(df[['Day','Dates','days']].head())        #因为数据集被我截取了,所以获取第一天的日期是错误的
print(df.info())                                #数据类型 得到一个timedelta对象
'''
   Day      Dates     days
0  289 2015-01-05    127 days
1  288 2015-01-04    126 days

10  days       59 non-null     timedelta64[ns]
'''
3.2 分块计算每块的数量
year、quarter(季度)属性;size()查看每组的数量
#换一个数据集
bank = pd.read_csv('/banklist.csv',encoding="utf-8",sep=',',parse_dates=[5,6]) #第5 6列
print(bank[['Closing Date','Updated Date']].head())
#添加两列,表示银行破产的季度和年份
bank['quarters'],bank['years'] = (bank['Closing Date'].dt.quarter,bank['Updated Date'].dt.year)
#查看一下,季度是分为四个季度,根据月份
print(bank[['Closing Date','Updated Date','quarters','years']].head())
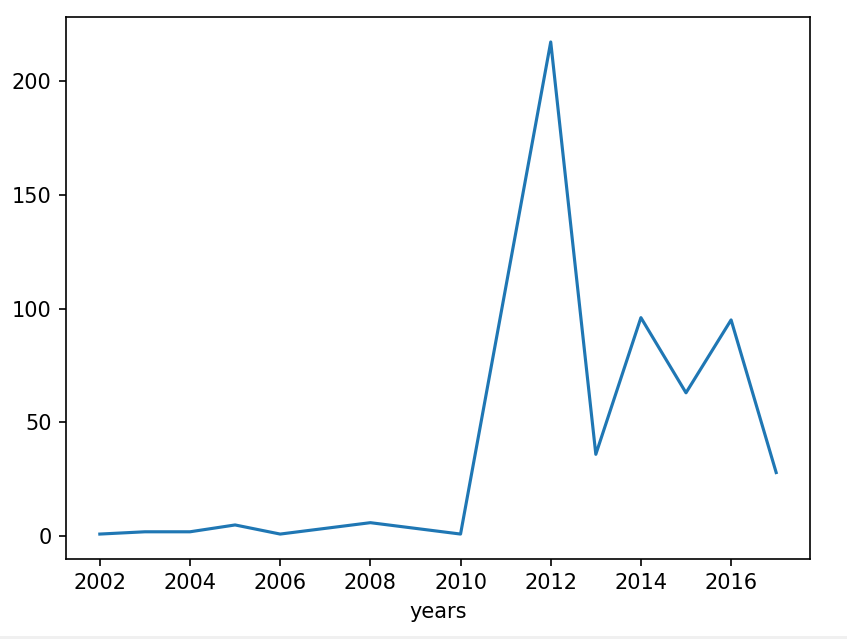
#计算每年破产银行数量
closing_year = bank.groupby(['years']).size()
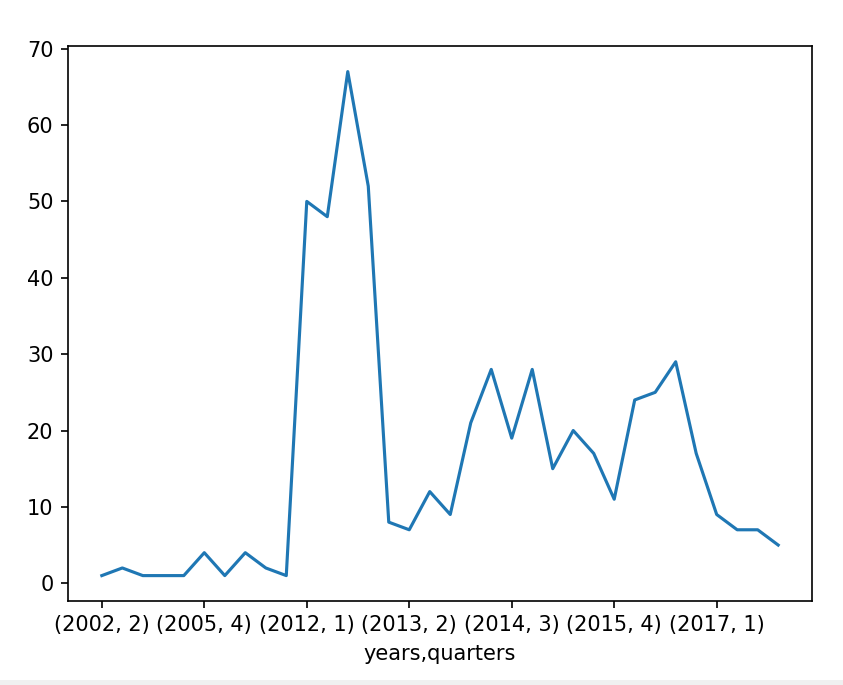
#计算每年每个季度的银行倒闭数量
closing_year_g = bank.groupby(['years','quarters']).size()
print(closing_year)
print(closing_year_g)
#绘图查看
import matplotlib.pyplot as plt
fig,ax = plt.subplots()
ax = closing_year.plot()
plt.show()
fig,ax = plt.subplots()
ax = closing_year_g.plot()
plt.show()
'''
Closing Date Updated Date
0 2017-05-26 2017-07-26
1 2017-05-05 2017-07-26
2 2017-04-28 2017-07-26
3 2017-03-03 2017-05-18
Closing Date Updated Date quarters years
0 2017-05-26 2017-07-26 2 2017
1 2017-05-05 2017-07-26 2 2017
years
2002 1
2016 95
2017 28
2017 1 9
2 7
3 7
4 5
'''
3 对日期取数据子集
#继续使用上上个数据集
#可以使用布尔子集获取2014年10月份的数据
print(df.loc[(df.Dates.dt.year == 2014) & (df.Dates.dt.month == 10)])
3.1 DatetimeIndex
把一个DataFrame的索引设置为 datetime,创建出 DatetimeIndex 对象
#把Dates列指定为索引
df.index = df['Dates']
print(df.index)
#把索引设置为日期对象之后,就可以直接使用日期来获取某些数据行了
print(df['2015'].iloc[:4, :3])       #根据年份获取
print(df['2014-09'].iloc[:2, :5])    #根据年月获取
'''
DatetimeIndex(['2015-01-05', '2015-01-04', '2015-01-03', '2015-01-02',
               '2014-12-31', '2014-12-28', '2014-12-27', '2014-12-24',
                Date  Day  Cases_Gu
..........
Dates
2015-01-05  1/5/2015  289    2776.0
2015-01-04  1/4/2015  288    2775.0
2015-01-03  1/3/2015  287    2769.0
2015-01-02  1/2/2015  286       NaN
                 Date  Day  Cases_Gu  Cases_Ni  Cases_Se
Dates
2014-09-28  9/28/2014  190    1157.0      20.0       1.0
2014-09-23  9/23/2014  185    1074.0      20.0       1.0
'''
3.2 TimedeltaIndex
同样可以使用 timedelta 来创建 TimedeltaIndex 对象
# #上上计算过疫情爆发日期  该数据列为TimedeltaIndex
# print(df['Dates'].min())
# df['days'] = df['Dates'] - df['Dates'].min()    #将该日 减去 第一天日期 得到天数
# print(df.info)
#把该列指派给index
print(df)
df.index = df['days']
print(df.iloc[:5,:4])
print(df['125 days': '119 days'].iloc[:50, :5])   #在前50个里面找从125到119之间的数量,注意顺序
'''
days
127 days    1/5/2015  289    2776.0      20.0
126 days    1/4/2015  288    2775.0       NaN
125 days    1/3/2015  287    2769.0      20.0
124 days    1/2/2015  286       NaN       NaN
122 days  12/31/2014  284    2730.0      20.0
                Date  Day  Cases_Gu  Cases_Ni  Cases_Se
days
125 days    1/3/2015  287    2769.0      20.0       1.0
124 days    1/2/2015  286       NaN       NaN       NaN
122 days  12/31/2014  284    2730.0      20.0       1.0
'''
4 日期范围重建索引
创建索引 data_range 函数实现,包含start和end参数
重建索引 reindex()
#并不是每个数据集中的日期都是完整的,有时会缺失
print(df.iloc[:5,:5])
#一般解决办法是创建一个日期范围重建索引,date_range函数实现
date_range = pd.date_range(start='2014-12-31',end='2015-01-05')
print(date_range)
#只取前五行的数据来举例
df_5 = df.head()
df_5.index = df_5['Dates']  #先把日期设置为索引
df_5 = df_5.reindex(date_range)    #再为数据重建索引
print(df_5.iloc[:,:])    #缺少的日期被补齐!NaN缺失值填充,注意:Dates列被NaT填充,表示日期缺失值
'''
                  Date    Day  Cases_Gu  ...  himonth  hiday     days
2014-12-31  12/31/2014  284.0    2730.0  ...     12.0   31.0 122 days
2015-01-01         NaN    NaN       NaN  ...      NaN    NaN      NaT
2015-01-02    1/2/2015  286.0       NaN  ...      1.0    2.0 124 days
2015-01-03    1/3/2015  287.0    2769.0  ...      1.0    3.0 125 days
2015-01-04    1/4/2015  288.0    2775.0  ...      1.0    4.0 126 days
2015-01-05    1/5/2015  289.0    2776.0  ...      1.0    5.0 127 days
DatetimeIndex(['2014-12-31', '2015-01-01', '2015-01-02', '2015-01-03',
               '2015-01-04', '2015-01-05'],
              dtype='datetime64[ns]', freq='D')
                  Date  Day  Cases_Gu
Dates
2015-01-05    1/5/2015  289    2776.0
2015-01-04    1/4/2015  288    2775.0
2015-01-03    1/3/2015  287    2769.0
2015-01-02    1/2/2015  286       NaN
2014-12-31  12/31/2014  284    2730.0
'''
频率 data_range 函数传入 freq参数
freq参数取值 :参考文章链接:pandas中的freq和inferred_freq等时间参数究竟有哪些_theskylife的博客-CSDN博客
#指定范围内所有的工作日 B
date_range = pd.date_range('2023-5-3','2023-05-08',freq='B')
print(date_range)
'''
DatetimeIndex(['2023-05-03', '2023-05-04', '2023-05-05', '2023-05-08'], dtype='datetime64[ns]', freq='B')
'''
增加偏移量
#指定范围内 隔一天取一天 2B
date_range = pd.date_range('2023-5-3','2023-05-08',freq='2B')
print(date_range)
#指定范围内 每个月的第2个星期四 'WOM-2THU'
date_range = pd.date_range('2023-5-3','2023-12-08',freq='WOM-2THU')
print(date_range)
'''
DatetimeIndex(['2023-05-03', '2023-05-05'], dtype='datetime64[ns]', freq='2B')

DatetimeIndex(['2023-05-11', '2023-06-08', '2023-07-13', '2023-08-10',
               '2023-09-14', '2023-10-12', '2023-11-09'],
              dtype='datetime64[ns]', freq='WOM-2THU')
'''


 4889
4889


 被折叠的 条评论
为什么被折叠?
被折叠的 条评论
为什么被折叠?
 到【灌水乐园】发言


