


Windows和Linux上使用Prometheus+Grafana监控Springboot
一、Springboot代码修改
1.引入maven依赖
   <dependency>
        <groupId>org.springframework.boot</groupId>
        <artifactId>spring-boot-starter-actuator</artifactId>
    </dependency>
    <dependency>
        <groupId>io.micrometer</groupId>
        <artifactId>micrometer-registry-prometheus</artifactId>
        <version>1.1.3</version>
    </dependency>
2. 启动类新增代码
    @Bean
    MeterRegistryCustomizer<MeterRegistry> configurer(
            @Value("${spring.application.name}") String applicationName) {
        return (registry) -> registry.config().commonTags("application", applicationName);
    }
3. application.properties文档配置
	spring.application.name=community
	# 打开所有 Actuator 服务
	management.endpoints.web.exposure.include=*
	# 将应用名称添加到计量器的 tag 中去,以便 Prometheus 根据应用名区分不同服务
	management.metrics.tags.application=${spring.application.name}
	# 暴露Tomcat
	server.tomcat.mbeanregistry.enabled=true
二、Windows中Prometheus和Grafana安装及配置
1.下载Prometheus压缩包
下载:Prometheus压缩包 解压并在安装目录下的prometheus.yml的最下方新增Job(要注意格式),代码如下:
- job_name: "community"
  # 这里我们springboot暴露出来的endpoint
  metrics_path: 'actuator/prometheus'
  # 信息收集时间是间隔5秒
  scrape_interval: 5s
  static_configs:
    - targets: ["localhost:后台端口号"]
2. 运行Prometheus及后台程序
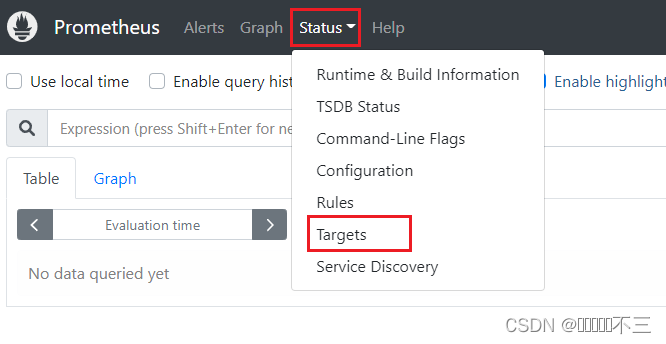
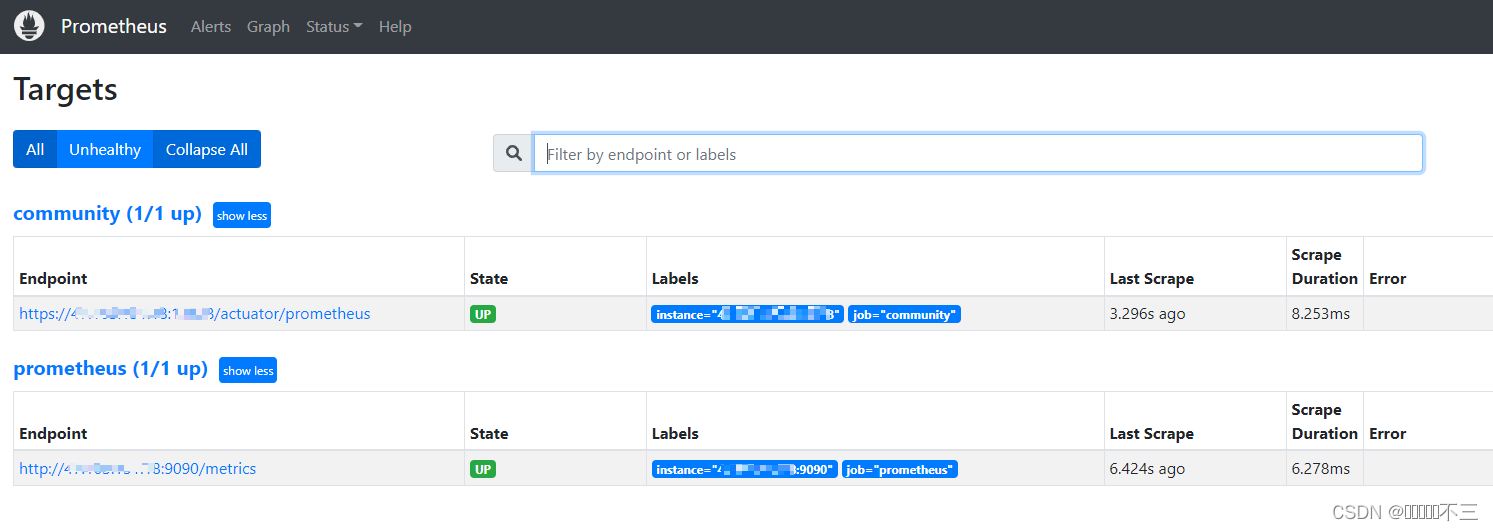
运行Prometheus及后台程序,访问【localhost:9090】,点击【Status-Targets】可以查看监控的端口列表
3. 下载Grafana压缩包并启动
下载:Grafana压缩包 解压后把conf/sample.ini复制一份然后重命名为conf/custom.ini,点击bin目录下的grafana-server.exe运行
4. Grafana页面配置
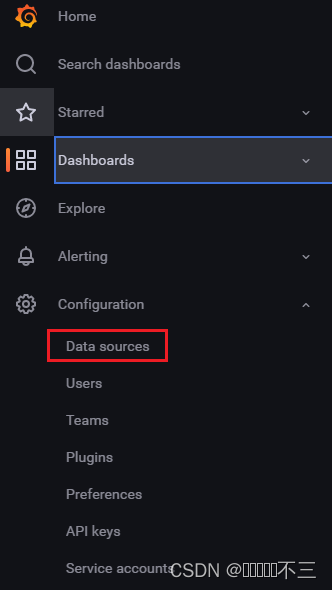
访问localhost:3000,添加Prometheus数据源
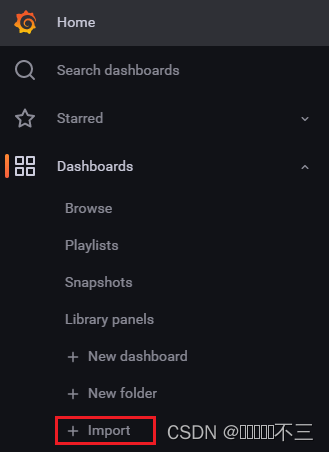
5.下载并导入模板
SpringBoot模板: https://grafana.com/grafana/dashboards/10280
JVM模板: https://grafana.com/grafana/dashboards/12856
三、Linux中Prometheus和Grafana安装及配置
注意:若是阿里云服务器需要在阿里云管理后台新增两个端口的访问规则(9090、3000)
1. 下载prometheus的Linux压缩包并解压
下载:Prometheus压缩包 并解压
tar -zxvf prometheus-2.39.1.linux-amd64.tar.gz -C /usr/local/
2. prometheus.yml新增Job
在安装目录下的prometheus.yml的最下方新增Job(要注意格式),代码如下:
- job_name: "community"
  scheme: https
  tls_config:
    insecure_skip_verify: true
  # 这里我们springboot暴露出来的endpoint
  metrics_path: 'actuator/prometheus'
  # 信息收集时间是间隔5秒
  scrape_interval: 5s
  static_configs:
    - targets: ["服务器IP:后台端口"]
3. 在安装目录下启动prometheus
	# 非后台启动(修改好配置文件后先运行此命令并访问【http://服务器IP:9090】,确定能访问后再用以下语句启动)
	sudo ./prometheus
	# 后台启动
	nohup ./prometheus --config.file=prometheus.yml --web.enable-admin-api --web.listen-address=:9090 >/dev/null 2>&1 &
	# 查看占用端口进程的PID
	netstat -tunlp|grep 9090
	# 杀死进程
	kill -9 {PID}
4. 下载Grafana压缩包
a. 下载:https://grafana.com/grafana/download 中的grafana-enterprise-2.1-1.x86_64.rpm并运行以下命令
   # 运行安装命令
   sudo rpm -i --nodeps grafana-enterprise-9.2.1-1.x86_64.rpm
   # 启动Grafana
   sudo /bin/systemctl start grafana-server.service
b. 访问【http://服务器IP:3000】,添加Prometheus数据源
c. 下载并导入模板:
SpringBoot模板: https://grafana.com/grafana/dashboards/10280
JVM模板: https://grafana.com/grafana/dashboards/12856


 4927
4927


 被折叠的 条评论
为什么被折叠?
被折叠的 条评论
为什么被折叠?
 到【灌水乐园】发言


