


1.MYSQL逻辑架构
1.1 简洁的架构
典型的C/S架构,服务器端程序使用mysqld
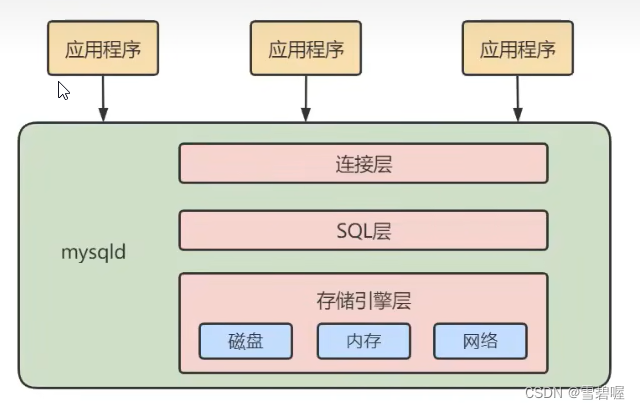
简化为三层架构:
- 连接层:客户端和服务端建立连接,客户端发送SQL至服务端;
- SQL层(服务端): 对SQL语句进行查询处理;与数据库文件的存储方式无关;
- 存储引擎层: 与数据库文件打交道,负责数据库文件的存储和读取。
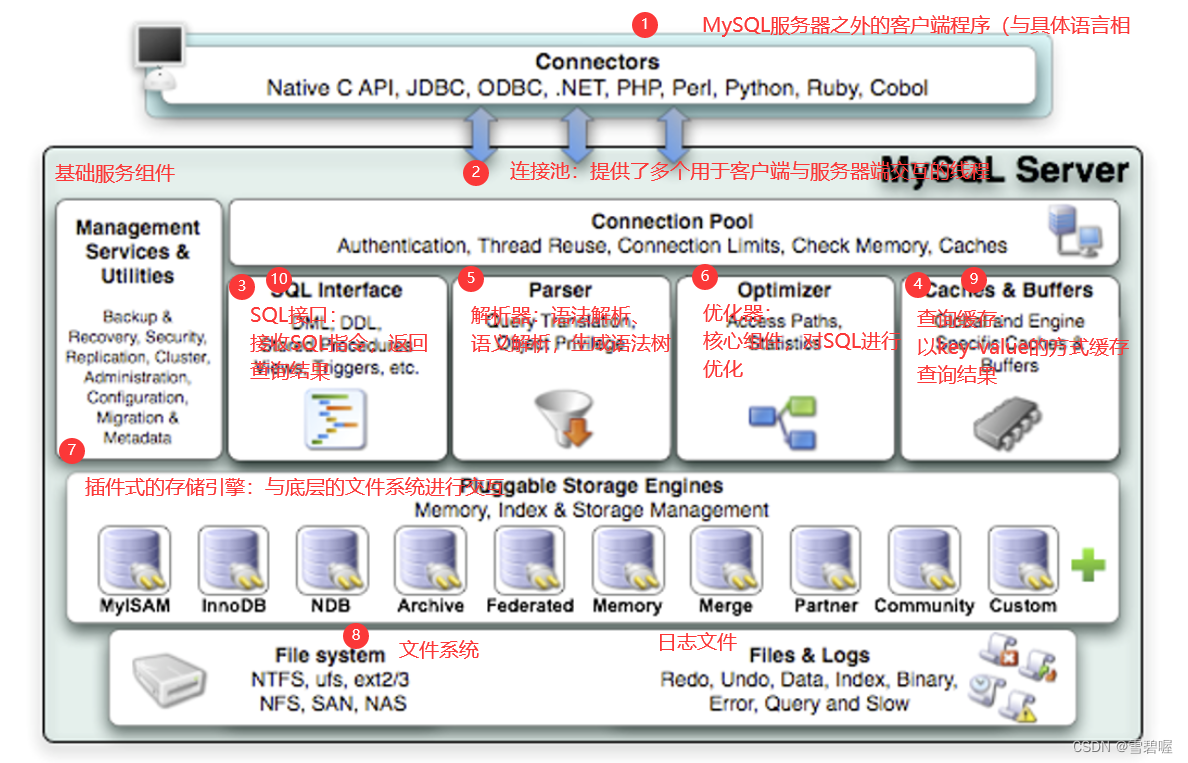
1.2 详细的架构
mysql 8.0之后删除了缓冲池,因为缓冲池的利用率很低但是需要占用空间,显得比较鸡肋。
2.SQL执行流程
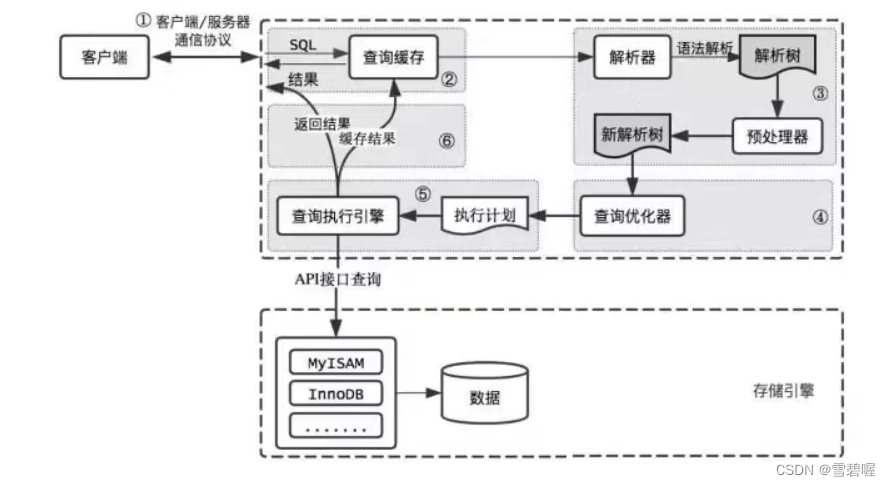
2.1 详细的执行流程
2.2 简洁的执行流程
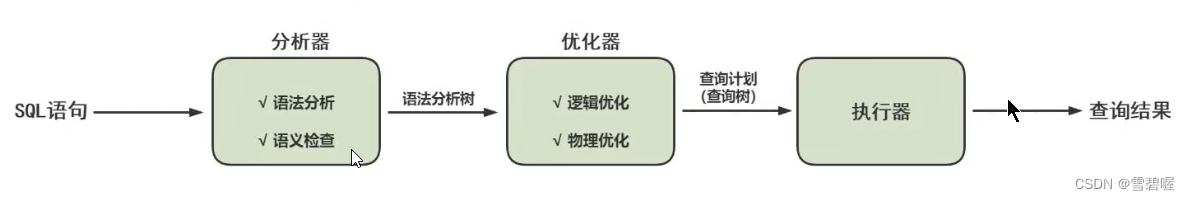
执行流程:
- 先查询缓存【8.0之前】,如果缓存中存在直接返回结果;
- 解析器:解析成解析树;
- 优化器:对语法进行优化;
- 执行引擎执行SQL语句并返回结果。
2.3 在控制台查看执行流程
2.3.1 打开流程记录设置
mysql中有一个系统变量@@profiling,默认是不记录SQL执行流程,设置成1时系统才会记录MySQL的执行过程。
查看@@profiling
// 查询方式一
mysql> select @@profiling;
+-------------+
| @@profiling |
+-------------+
|           0 |
+-------------+
1 row in set, 1 warning (0.00 sec)
// 查询方式二
mysql> show variables like 'profiling';
+---------------+-------+
| Variable_name | Value |
+---------------+-------+
| profiling     | OFF   |
+---------------+-------+
1 row in set (0.00 sec)
设置@@profiling
mysql> set profiling = 1;
Query OK, 0 rows affected, 1 warning (0.00 sec)

mysql> show variables like 'profiling';
+---------------+-------+
| Variable_name | Value |
+---------------+-------+
| profiling     | ON    |
+---------------+-------+
1 row in set (0.00 sec)
2.3.2 随意执行一条sql
mysql> select * from book1;
+----+-------------+--------------------+------+
| id | category_id | book_name          | num  |
+----+-------------+--------------------+------+
|  1 |           3 | 平凡的世界         |  450 |
|  2 |           1 | 刺杀小说家         |  660 |
|  3 |           2 | 鲁滨孙漂流记       |  330 |
|  4 |           4 | 活着               |  200 |
+----+-------------+--------------------+------+
4 rows in set (0.00 sec)
2.3.3 查看刚才SQL的执行流程
mysql> show profile;
+----------------------+----------+
| Status               | Duration |
+----------------------+----------+
| starting             | 0.000053 |
| checking permissions | 0.000006 |
| Opening tables       | 0.000017 |
| init                 | 0.000016 |
| System lock          | 0.000007 |
| optimizing           | 0.000004 |
| statistics           | 0.000011 |
| preparing            | 0.000010 |
| executing            | 0.000003 |
| Sending data         | 0.000040 |
| end                  | 0.000004 |
| query end            | 0.000006 |
| closing tables       | 0.000006 |
| freeing items        | 0.000015 |
| cleaning up          | 0.000012 |
+----------------------+----------+
15 rows in set, 1 warning (0.00 sec)
多执行几条sql
mysql> select * from book1;
+----+-------------+--------------------+------+
| id | category_id | book_name          | num  |
+----+-------------+--------------------+------+
|  1 |           3 | 平凡的世界         |  450 |
|  2 |           1 | 刺杀小说家         |  660 |
|  3 |           2 | 鲁滨孙漂流记       |  330 |
|  4 |           4 | 活着               |  200 |
+----+-------------+--------------------+------+
4 rows in set (0.00 sec)
2.3.4 查看所有的sql执行过程
mysql> show profiles;
+----------+------------+---------------------------------+
| Query_ID | Duration   | Query                           |
+----------+------------+---------------------------------+
|        1 | 0.00140925 | show variables like 'profiling' |
|        2 | 0.00023625 | show tables                     |
|        3 | 0.00020700 | select * from book1             |
|        4 | 0.00025750 | select * from book1             |
|        5 | 0.00022700 | select * from book1             |
+----------+------------+---------------------------------+
5 rows in set, 1 warning (0.00 sec)
2.3.5 查看某条sql执行过程
mysql> show profile for query 2;
+----------------------+----------+
| Status               | Duration |
+----------------------+----------+
| starting             | 0.000047 |
| checking permissions | 0.000006 |
| checking permissions | 0.000003 |
| Opening tables       | 0.000035 |
| init                 | 0.000009 |
| System lock          | 0.000005 |
| optimizing           | 0.000004 |
| statistics           | 0.000010 |
| preparing            | 0.000009 |
| executing            | 0.000004 |
| checking permissions | 0.000051 |
| Sending data         | 0.000012 |
| end                  | 0.000003 |
| query end            | 0.000005 |
| closing tables       | 0.000003 |
| removing tmp table   | 0.000005 |
| closing tables       | 0.000003 |
| freeing items        | 0.000011 |
| cleaning up          | 0.000015 |
+----------------------+----------+
19 rows in set, 1 warning (0.00 sec)
2.3.6 查询sql的cup,io占用情况
mysql> show profile cpu,block io for query 5;
+----------------------+----------+----------+------------+--------------+---------------+
| Status               | Duration | CPU_user | CPU_system | Block_ops_in | Block_ops_out |
+----------------------+----------+----------+------------+--------------+---------------+
| starting             | 0.000067 | 0.000000 |   0.000062 |            0 |             0 |
| checking permissions | 0.000009 | 0.000000 |   0.000007 |            0 |             0 |
| Opening tables       | 0.000019 | 0.000000 |   0.000019 |            0 |             0 |
| init                 | 0.000016 | 0.000000 |   0.000015 |            0 |             0 |
| System lock          | 0.000007 | 0.000000 |   0.000007 |            0 |             0 |
| optimizing           | 0.000003 | 0.000000 |   0.000004 |            0 |             0 |
| statistics           | 0.000011 | 0.000000 |   0.000010 |            0 |             0 |
| preparing            | 0.000010 | 0.000000 |   0.000010 |            0 |             0 |
| executing            | 0.000003 | 0.000000 |   0.000003 |            0 |             0 |
| Sending data         | 0.000041 | 0.000000 |   0.000041 |            0 |             0 |
| end                  | 0.000003 | 0.000000 |   0.000003 |            0 |             0 |
| query end            | 0.000007 | 0.000000 |   0.000007 |            0 |             0 |
| closing tables       | 0.000006 | 0.000000 |   0.000006 |            0 |             0 |
| freeing items        | 0.000016 | 0.000000 |   0.000015 |            0 |             0 |
| cleaning up          | 0.000011 | 0.000000 |   0.000011 |            0 |             0 |
+----------------------+----------+----------+------------+--------------+---------------+
15 rows in set, 1 warning (0.00 sec)


 482
482


 被折叠的 条评论
为什么被折叠?
被折叠的 条评论
为什么被折叠?
 到【灌水乐园】发言


