


错误写法:
100%继承了父元素的宽度,刷新值会改变
正确写法:
100vw是浏览器窗口的宽度,相当于一个固定值,浏览器刷新也不会改变
vue使用echarts:
- 通过命令行下载echarts
npm install echarts -S - 在
main.ts文件中全局引用import * as echarts from 'echarts'; const app = createApp(App).use(store) .use(router) .use(Antd) .use(Form); // 将echarts挂载到全局 app.config.globalProperties.$echarts = echarts; - 在需要的地方使用
<template>
<a-card>
<a-tabs default-active-key="1">
<a-tab-pane key="1" tab="访客数(UV)">
<div id="myChart" style="width: 100%;height: 500px"></div>
</a-tab-pane>
<a-tab-pane key="2" tab="访问页面数(PV)">
Tab 2
</a-tab-pane>
<a-tab-pane key="3" tab="下单金额">
Tab 3
</a-tab-pane>
<a-tab-pane key="4" tab="下单次数">
Tab 3
</a-tab-pane>
<a-tab-pane key="5" tab="下单人数">
Tab 3
</a-tab-pane>
<template #tabBarExtraContent>
<a-date-picker placeholder="请选择日期" slot="tabBarExtraContent" />
</template>
</a-tabs>
</a-card>
</template>
<script>
import {Vue} from "vue-class-component";
export default class Statistics extends Vue {
mounted() {
this.drawLine();
}
drawLine() {
// 基于准备好的dom,初始化echarts实例
let myChart = this.$echarts.init(document.getElementById('myChart'));
// 绘制图表
myChart.setOption({
grid: {
left: "7%"
},
legend: {
left: "50%",
top: "0%",
orient: "horizontal",
itemGap: 20,
itemHeight: 18,
selectedMode: true,
inactiveColor: "#8091d1",
textStyle: {
color: "#4b66c2",
fontStyle: "italic",
fontWeight: "bold",
padding: [3, 3, 3, 3]
},
pageTextStyle: {
color: null
},
animation: false,
selectorLabel: {
show: false
}
},
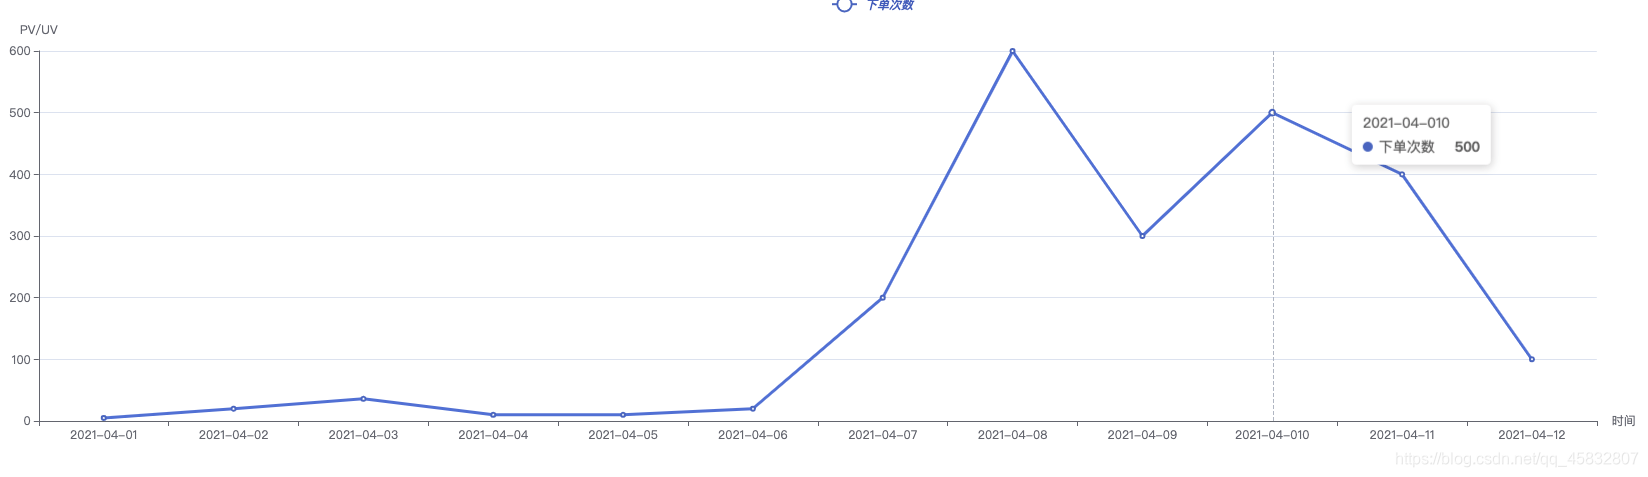
xAxis: {
name: "时间",
nameLocation: "end",
data: ["2021-04-01","2021-04-02","2021-04-03","2021-04-04","2021-04-05","2021-04-06","2021-04-07","2021-04-08","2021-04-09","2021-04-010","2021-04-11","2021-04-12"]
},
yAxis: {
name: "PV/UV",
axisLine: {
show: true
},
axisTick: {
show: true,
}
},
series: [{
name: '下单次数',
type: 'line',
data: [5, 20, 36, 10, 10, 20, 200, 600, 300, 500, 400, 100]
}]
});
}
}
</script>
<style lang="ts">
</style>
<template>
<div class="latitude-wrap">
<a-card title="浏览器纬度统计" class="width-fill mt-24">
<template #extra>
<a-range-picker/>
</template>
<!--注意:这里的画布宽度必须为固定宽度,不能使用100%, 使用100%当前页面浏览器刷新画布内容会溢出-->
<div id="latitudeData" class="canvas-wrap" style="width: calc(100vw - 256px);height: 640px;"></div>
</a-card>
</div>
</template>
<script lang="ts">
import {Options, Vue} from 'vue-class-component';
import * as echarts from "echarts";
import {PaginationComponent} from "@/utils/page/PaginationComponent";
import {BrowserLatitude} from '@/entity/BrowserLatitude';
import NoData from "@/components/no-data/no-data.vue";
@Options({
components: {
NoData
},
})
export default class BrowserLatitudeStatistics extends PaginationComponent<BrowserLatitude> {
mounted() {
this.drawBrowserLatitude();
}
drawBrowserLatitude() {
let latitudeData = echarts.init(document.getElementById('latitudeData'));
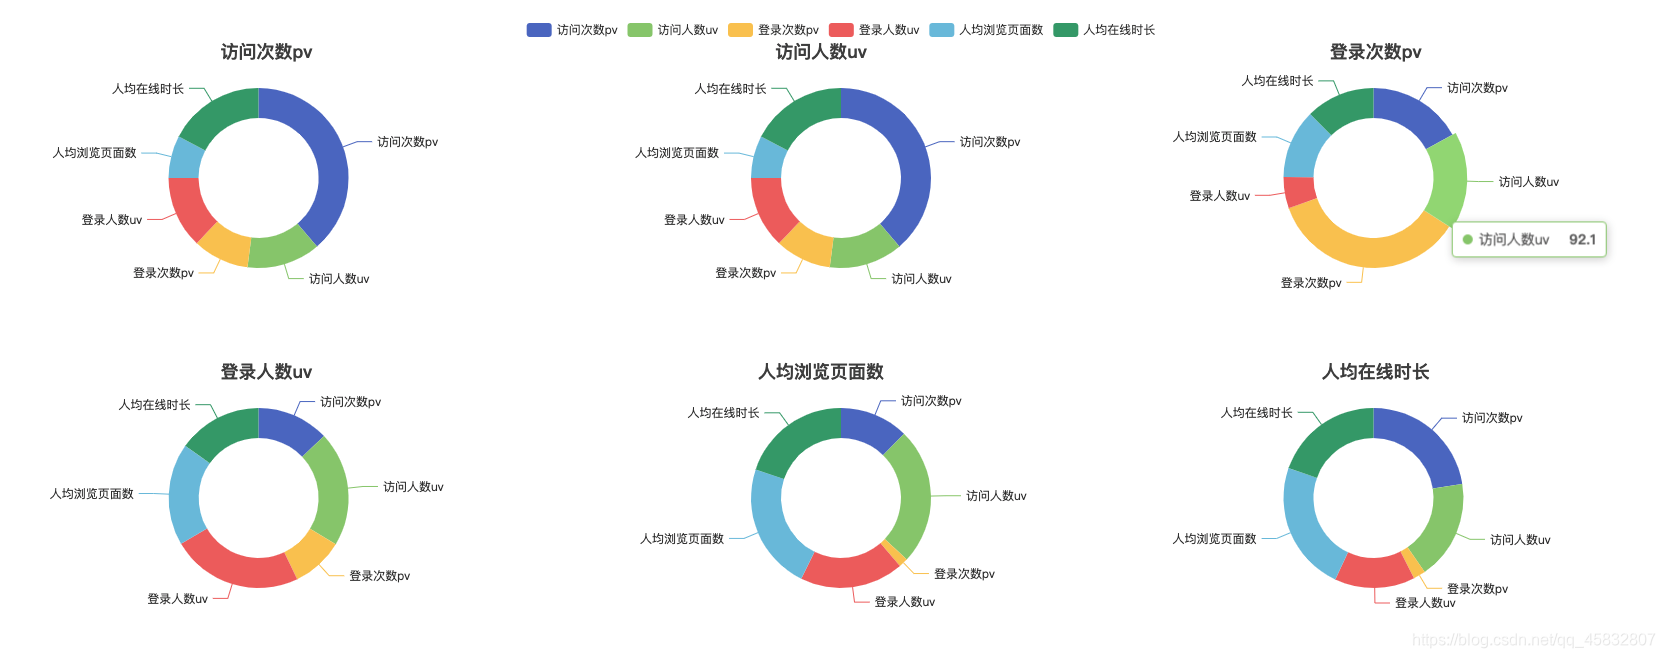
const titleNames = ['访问次数pv', '访问人数uv', '登录次数pv', '登录人数uv', '人均浏览页面数', '人均在线时长'];
let titleList = [];
let grids = [];
const rowNumber = Math.ceil(Math.sqrt(titleNames.length));
const colNumber = Math.ceil(titleNames.length/rowNumber);
titleNames.forEach(name => {
titleList.push({
textAlign: 'center',
text: name,
textStyle: {
fontSize: 18,
fontWeight: 600
}
});
grids.push({
show: true,
borderWidth: 0,
shadowColor: 'rgba(0, 0, 0, 0.3)',
shadowBlur: 2
});
});
grids.forEach(function (grid, idx) {
grid.left = ((idx % rowNumber) / rowNumber * 100 - 1) + '%';
grid.top = (Math.floor(idx / rowNumber) / colNumber * 100 + 3) + '%';
grid.width = (1 / rowNumber * 100 - 1) + '%';
grid.height = (1 / rowNumber * 100 - 1) + '%';
titleList[idx].left = parseFloat(grid.left) + parseFloat(grid.width) / 2 + '%';
titleList[idx].top = parseFloat(grid.top) + '%';
});
const option = {
legend: {},
tooltip: {},
title: titleList,
grid: grids,
dataset: {
source: [
['product', '电信', '联通', '移动', '网通', '长城', '其他'],
['访问次数pv', 123, 92.1, 43, 83.1, 46, 55.1],
['访问人数uv', 42, 92.1, 85.7, 66, 73.4, 96],
['登录次数pv', 32, 192.1, 5.7, 8.1, 33.4, 55.1],
['登录人数uv', 41.1, 30.4, 65.1, 53.3, 83.8, 98.7],
['人均浏览页面数', 24.1, 67.2, 79.5, 86.4, 65.2, 82.5],
['人均在线时长', 55.2, 67.1, 69.2, 72.4, 53.9, 39.1]
]
},
series: [{
type: 'pie',
// label: {
// normal: {
// show: true,
// position: 'center',
// formatter: function () {
// return '移动'
// },
// textStyle: {
// fontSize: 18,
// fontWeight: 600
// }
// }
// },
radius: ['60', '90'],
center: ['15%', '25%'],
}, {
type: 'pie',
radius: ['60', '90'],
center: ['50%', '25%'],
encode: {
itemName: 'product',
value: '电信'
}
}, {
type: 'pie',
radius: ['60', '90'],
center: ['82%', '25%'],
encode: {
itemName: 'product',
value: '联通'
}
}, {
type: 'pie',
radius: ['60', '90'],
center: ['15%', '75%'],
encode: {
itemName: 'product',
value: '长城'
}
}, {
type: 'pie',
radius: ['60', '90'],
center: ['50%', '75%'],
encode: {
itemName: 'product',
value: '移动'
}
}, {
type: 'pie',
radius: ['60', '90'],
center: ['82%', '75%'],
encode: {
itemName: 'product',
value: '网通'
}
}
]
};
this.drawEchart(option, 'latitudeData');
}
drawEchart(option: any, id: string) {
setTimeout(() => {
if (document.getElementById(id)) {
const echart = echarts.init(document.getElementById(id));
echart.setOption(option);
// 图表自适应
window.addEventListener('resize', () => {
echart.resize();
});
}
}, 100);
}
}
</script>
<style scoped>
</style>


 651
651


 被折叠的 条评论
为什么被折叠?
被折叠的 条评论
为什么被折叠?
 到【灌水乐园】发言


