


matplotlib绘制子图(设置间距,子图标签,设置标题,图例,调节标签字体大小)
设置子图行列间距:
默认为none,自定义间距可按百分比调节
subplots_adjust(left=None,bottom=None,right=None,top=None,wspace=None,hspace=None)
设置子图标签,标题,和图例:
ax1.set_title('train_loss', fontproperties='SimHei', fontsize=20)   # 为子图添加标题,设置标题的字体,字体的大小,字体的颜色
ax1.set_xlabel('number of batches')   # 为x轴添加标签
ax1.set_ylabel('loss')   # 为y轴添加标签
ax1.legend(loc='upper right')   # 设置图表图例在右上角
调整标签字体大小:
plt.xlabel('date',fontsize=20)
plt.ylabel('flow',fontsize=20)
完整代码:
from matplotlib.pylab import style
style.use('ggplot')
# oop方式
plt.rcParams['font.family'] = 'FangSong'   # 设置字体为仿宋
plt.rcParams['font.size'] = 10   # 设置字体的大小为10
plt.rcParams['axes.unicode_minus'] = False   # 显示正、负的问题
fig = plt.figure(figsize=(10,8))
# subplots_adjust(left=None,bottom=None,right=None,top=None,wspace=0.2,hspace=0.2)  # 调整子图间距按百分比
fig.subplots_adjust(wspace=0.2,hspace=0.5)
# type(fig)
x = np.linspace(0,len(train_log),len(train_log))
x_test= np.linspace(0,len(test_log),len(test_log))
test_log = np.array(test_log)
ax1 = fig.add_subplot(2,2,1)
ax1.plot(x,train_log,label="train_loss",linewidth=1.5)
ax2 = fig.add_subplot(2,2,2)
ax2.plot(x_test,test_log[:,0],label="test_rmse_loss",linewidth=1.5)
ax3 = fig.add_subplot(2,2,3)
ax3.plot(x_test,test_log[:,1],label="test_mae_loss",linewidth=1.5)
ax4 = fig.add_subplot(2,2,4)
ax4.plot(x_test,test_log[:,2],label="test_mape_loss",linewidth=1.5)
ax1.set_title('train_loss', fontproperties='SimHei', fontsize=20)   # 为子图添加标题,设置标题的字体,字体的大小,字体的颜色
ax1.set_xlabel('number of batches')   # 为x轴添加标签
ax1.set_ylabel('loss')   # 为y轴添加标签
ax1.legend(loc='upper right')   # 设置图表图例在右上角
# ax1.grid(True)   # 绘制网格
ax2.set_title('RMSE', fontproperties='SimHei', fontsize=20)   # 为子图添加标题,设置标题的字体,字体的大小,字体的颜色
ax2.set_xlabel('number of batches')   # 为x轴添加标签
ax2.set_ylabel('loss')   # 为y轴添加标签
ax2.legend(loc='upper right')   # 设置图表图例在右上角
# ax2.grid(True)   # 绘制网格
ax3.set_title('MAE', fontproperties='SimHei', fontsize=20)   # 为子图添加标题,设置标题的字体,字体的大小,字体的颜色
ax3.set_xlabel('number of batches')   # 为x轴添加标签
ax3.set_ylabel('loss')   # 为y轴添加标签
ax3.legend(loc='upper right')   # 设置图表图例在右上角
# ax3.grid(True)   # 绘制网格
ax4.set_title('MAPE', fontproperties='SimHei', fontsize=20)   # 为子图添加标题,设置标题的字体,字体的大小,字体的颜色
ax4.set_xlabel('number of batches')   # 为x轴添加标签
ax4.set_ylabel('loss')   # 为y轴添加标签
ax4.legend(loc='upper right')   # 设置图表图例在右上角
# ax4.grid(True)   # 绘制网格
plt.show()
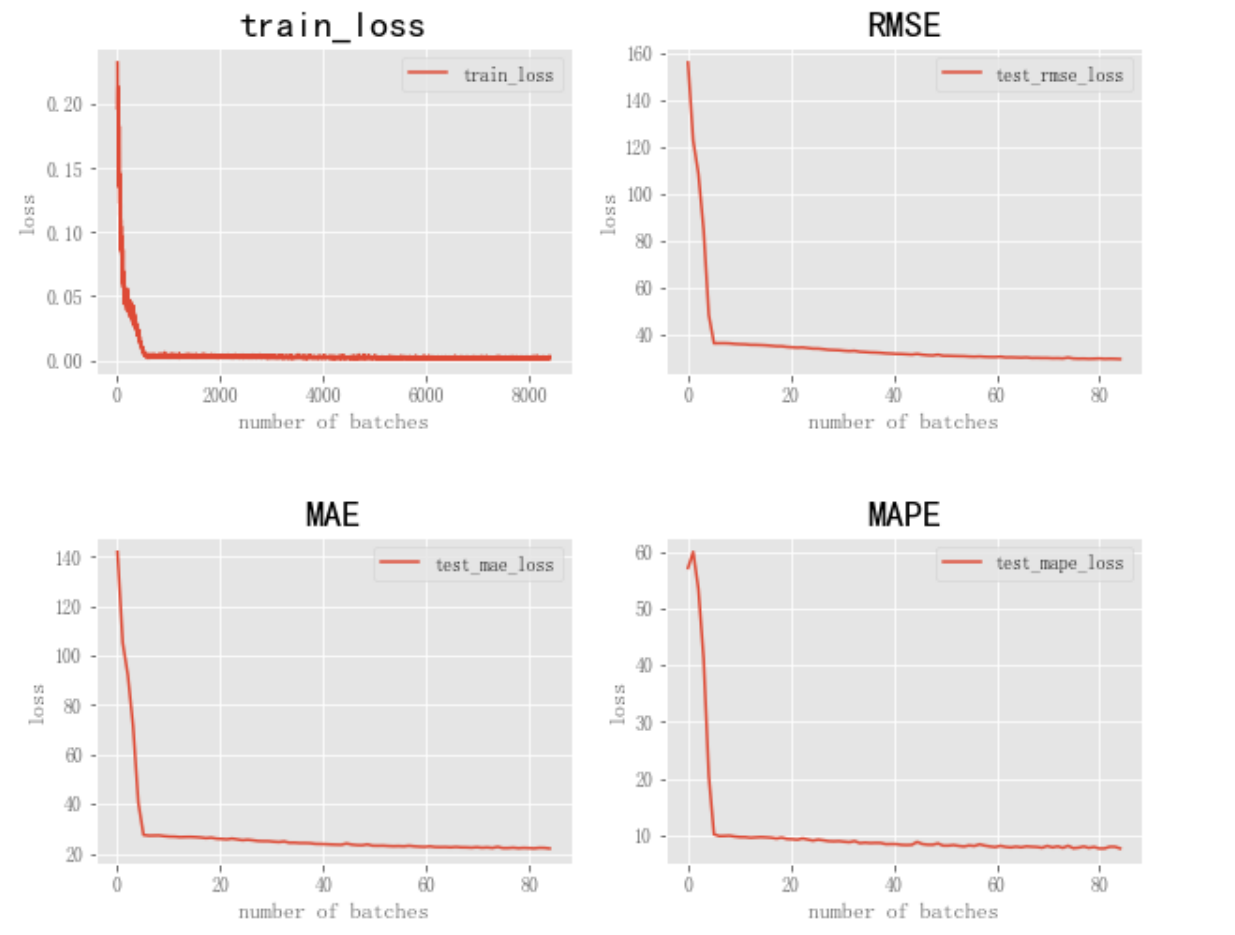
效果图:


 1610
1610


 被折叠的 条评论
为什么被折叠?
被折叠的 条评论
为什么被折叠?
 到【灌水乐园】发言


