


部署Prometheus(192.168.200.11)
环境准备工作
| 服务器类型 | IP地址 | 组件 |
|---|---|---|
| Prometheus服务器 | 192.168.200.11 | Prometheus、node_exporter |
| grafana服务器 | 192.168.200.13 | Grafana |
| agent服务器 | 192.168.200.14 | node_exporter |
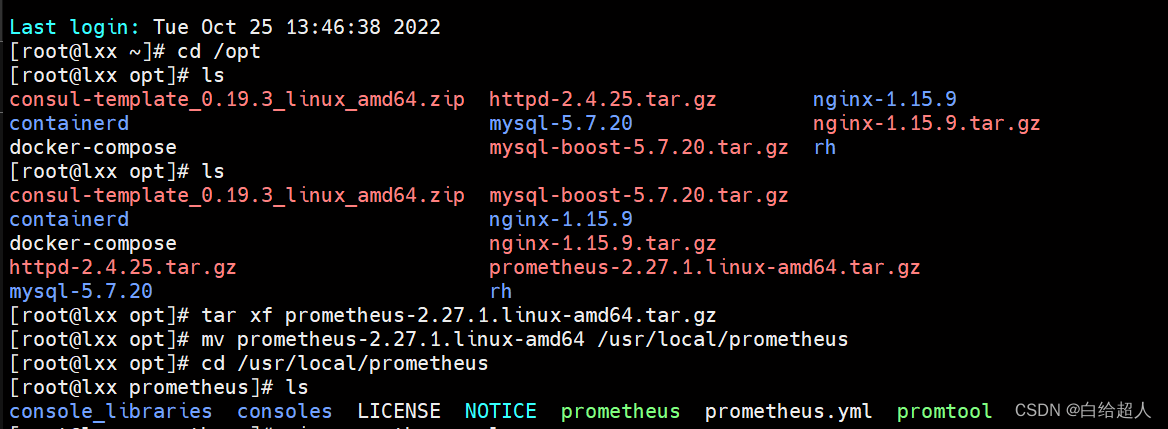
上传 prometheus-2.27.1.linux-amd64.tar.gz 到 /opt 目录中,并解压
cd /opt
ls
rz -E
tar xf prometheus-2.27.1.linux-amd64.tar.gz
mv prometheus-2.27.1.linux-amd64 /usr/local/prometheus
cd /usr/local/prometheus
修改配置文件
vim prometheus.yml
global:					#用于prometheus的全局配置,比如采集间隔,抓取超时时间等
  scrape_interval: 15s			#采集目标主机监控数据的时间间隔,默认为1m
  evaluation_interval: 15s 		#触发告警生成alert的时间间隔,默认是1m
  # scrape_timeout is set to the global default (10s).
  scrape_timeout: 10s			#数据采集超时时间,默认10s

alerting:				#用于alertmanager实例的配置,支持静态配置和动态服务发现的机制
  alertmanagers:
    - static_configs:
        - targets:
          # - alertmanager:9093

rule_files:				#用于加载告警规则相关的文件路径的配置,可以使用文件名通配机制
  # - "first_rules.yml"
  # - "second_rules.yml"

scrape_configs:			#用于采集时序数据源的配置
  # The job name is added as a label `job=<job_name>` to any timeseries scraped from this config.
  - job_name: "prometheus"		#每个被监控实例的集合用job_name命名,支持静态配置(static_configs)和动态服务发现的机制(*_sd_configs)

    # metrics_path defaults to '/metrics'
    # scheme defaults to 'http'.

    static_configs:				#静态目标配置,固定从某个target拉取数据
      - targets: ["192.168.200.11:9090"]
配置系统启动文件,设置开机自启
vim /usr/lib/systemd/system/prometheus.service

[Unit]
Description=Prometheus Server
Documentation=https://prometheus.io
After=network.target

[Service]
Type=simple
ExecStart=/usr/local/prometheus/prometheus \
--config.file=/usr/local/prometheus/prometheus.yml \
--storage.tsdb.path=/usr/local/prometheus/data/ \
--storage.tsdb.retention=15d \
--web.enable-lifecycle

ExecReload=/bin/kill -HUP $MAINPID
Restart=on-failure

[Install]
WantedBy=multi-user.target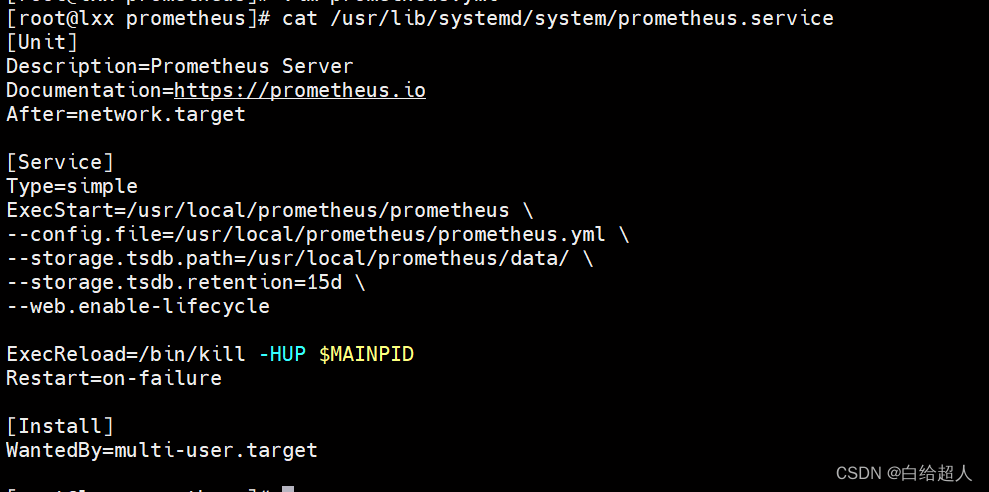
开启prometheus,并访问网页验证
systemctl start prometheus
systemctl enable prometheus
netstat -natp | grep :9090
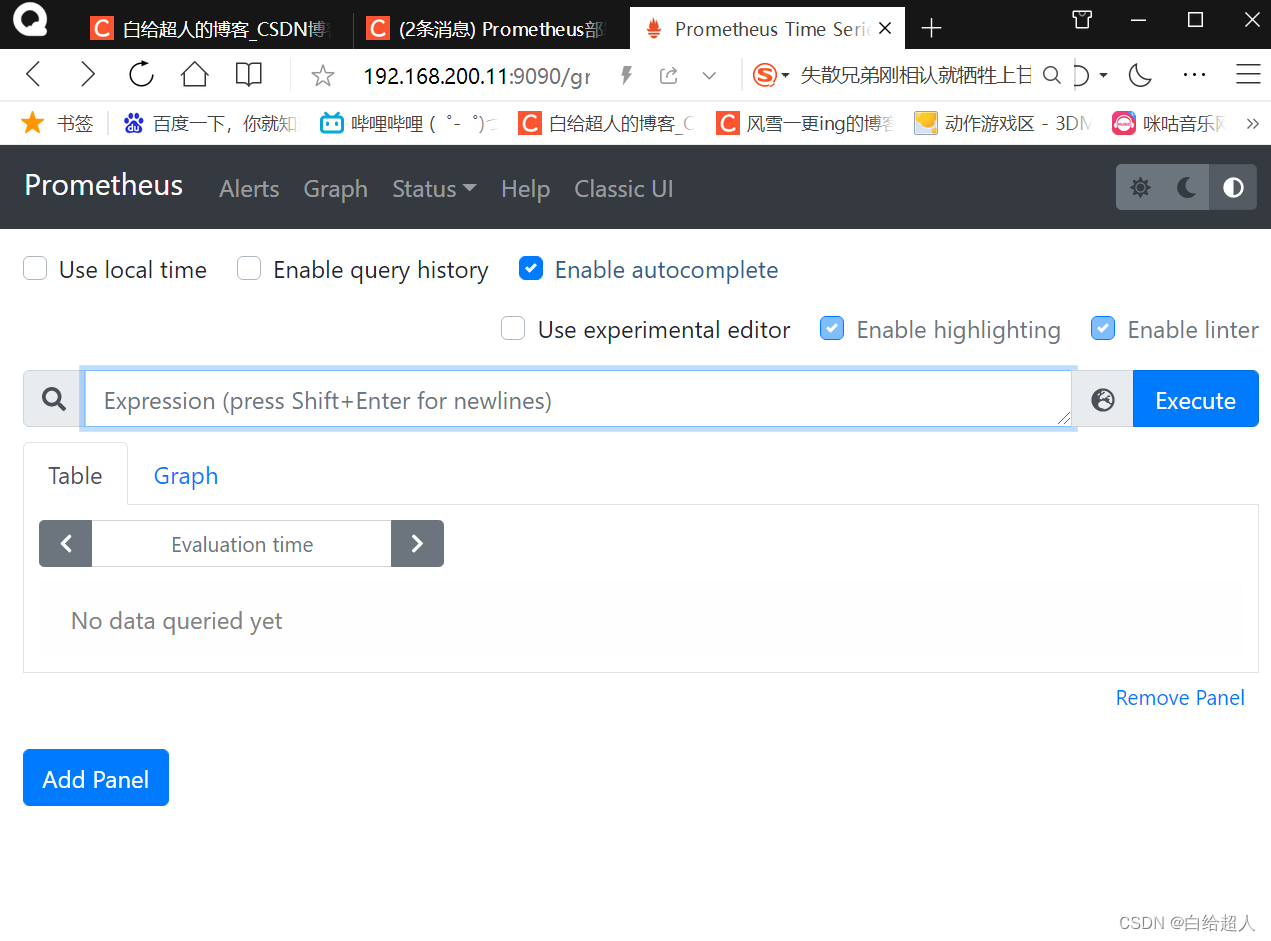
浏览器访问:http://192.168.200.11:9090 ,访问到 Prometheus 的 Web UI 界面
点击页面的 Status -> Targets,如看到 Target 状态都为 UP,说明 Prometheus 能正常采集到数据
http://192.168.200.11:9090/metrics ,可以看到 Prometheus 采集到自己的指标数据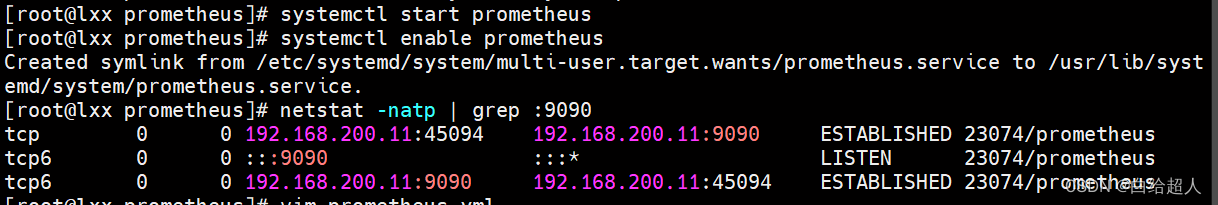

通过 http:// 服务器 IP:9090/metrics 可以查看到监控的数据: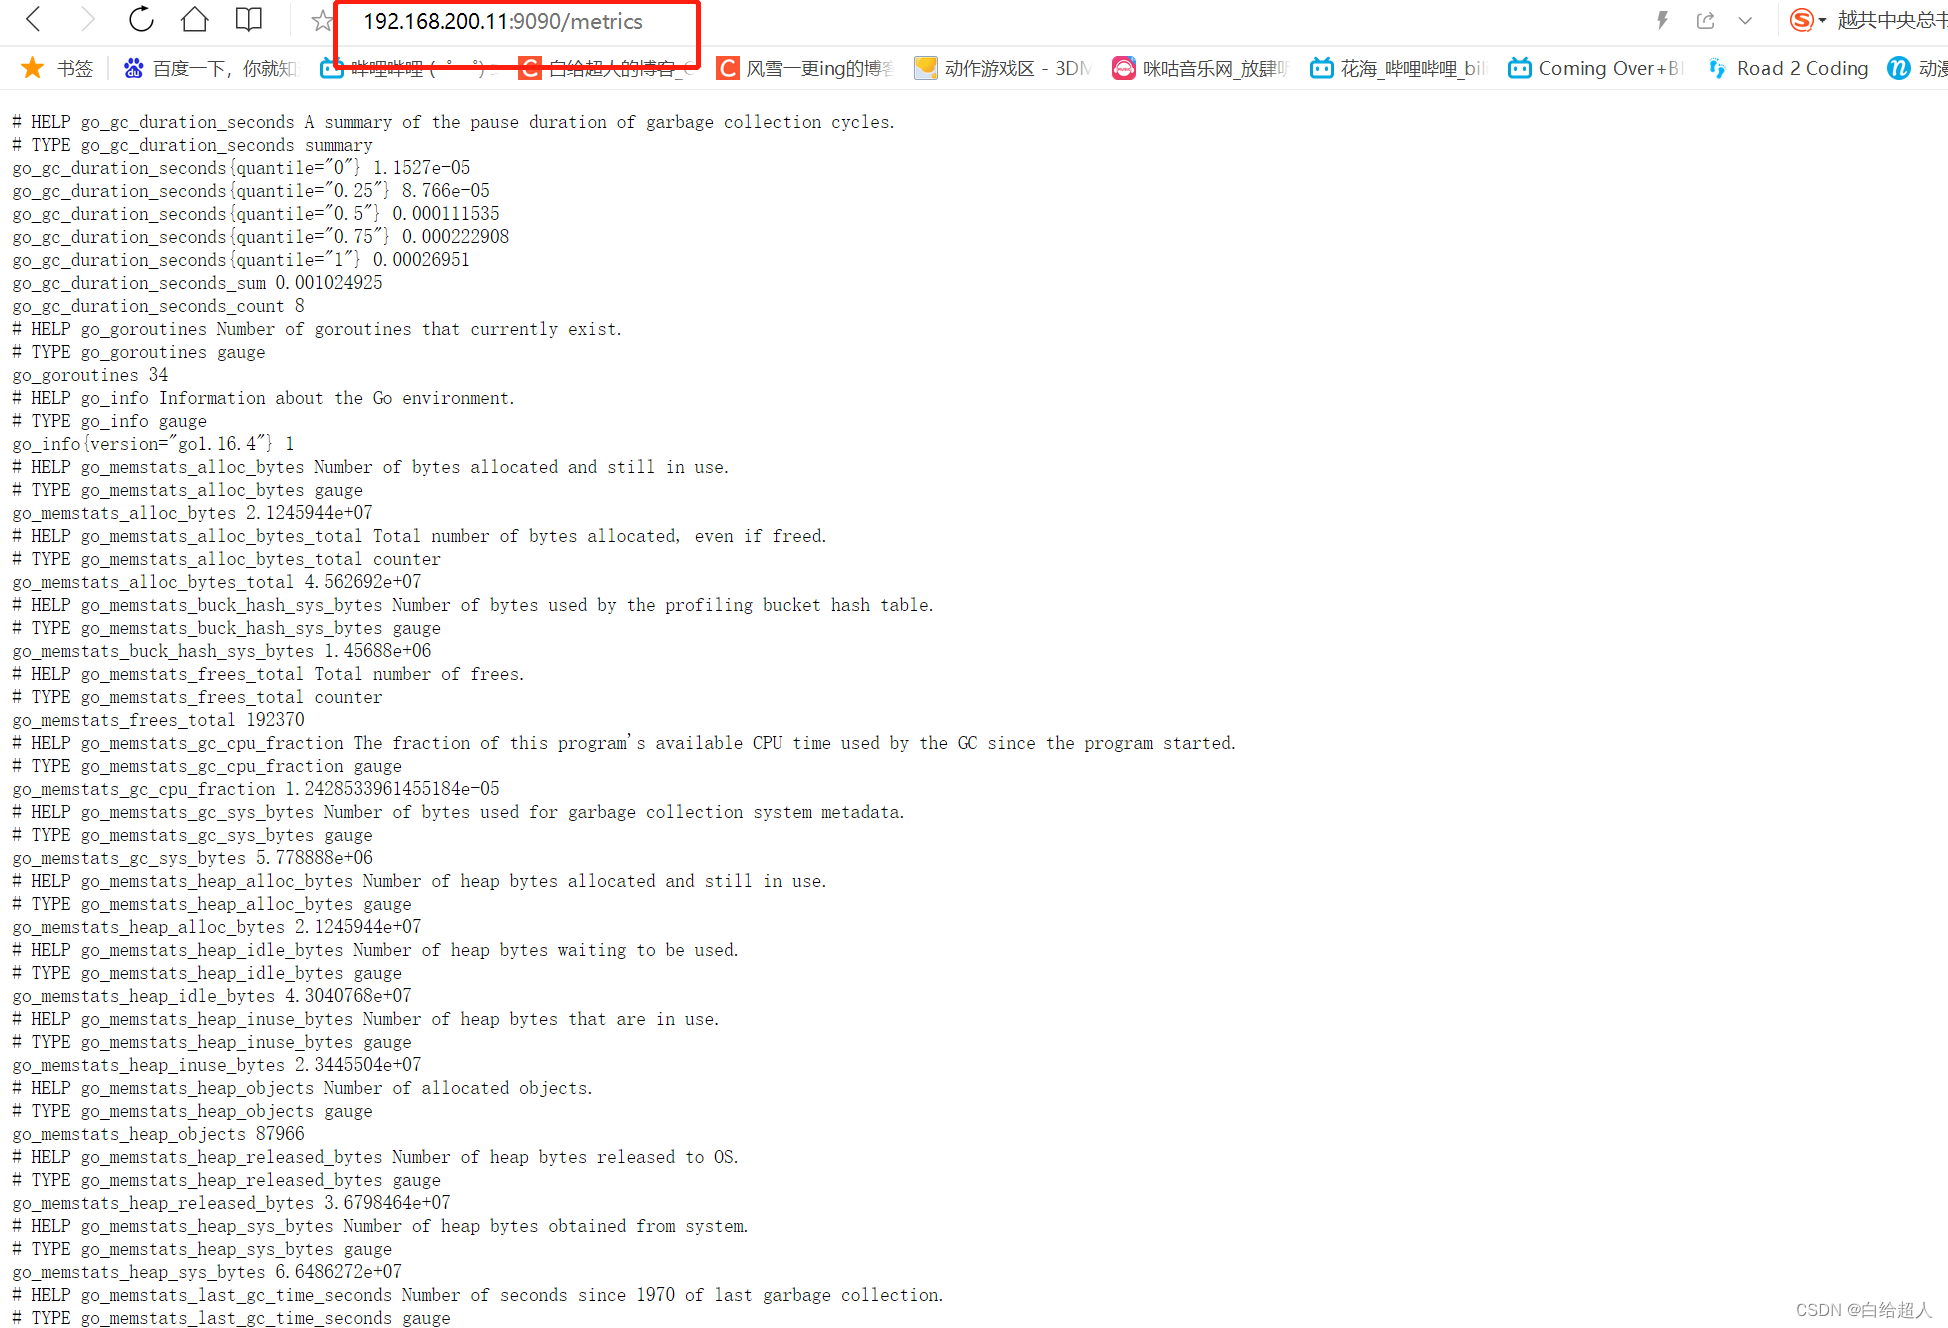
部署Exporters(192.168.200.12)
监控远程Linux主机(192.168.200.12)
在远程 linux 主机(被监控端 agent)上安装 node_exporter 组件。.
上传 node_exporter-1.1.2.linux-amd64.tar.gz 到 /opt 目录中,并解压
cd /opt/
tar xf node_exporter-1.1.2.linux-amd64.tar.gz
mv node_exporter-1.1.2.linux-amd64/node_exporter /usr/local/bin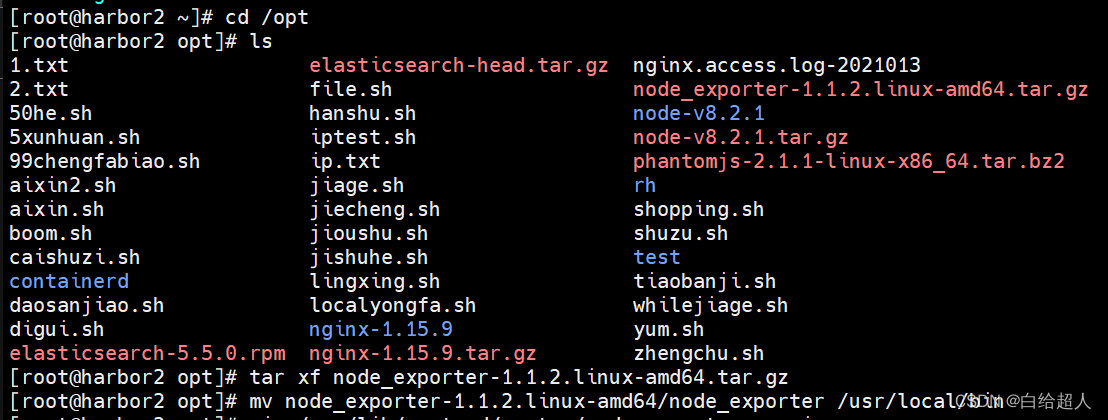
配置启动文件,设置开机自启
vim /usr/lib/systemd/system/node_exporter.service
[Unit]
Description=mysqld_exporter
Documentation=https://prometheus.io/
After=network.target

[Service]
Type=simple
ExecStart=/usr/local/bin/node_exporter \
--collector.ntp \
--collector.mountstats \
--collector.systemd \
--collector.tcpstat

ExecReload=/bin/kill -HUP $MAINPID
Restart=on-failure

[Install]
WantedBy=multi-user.target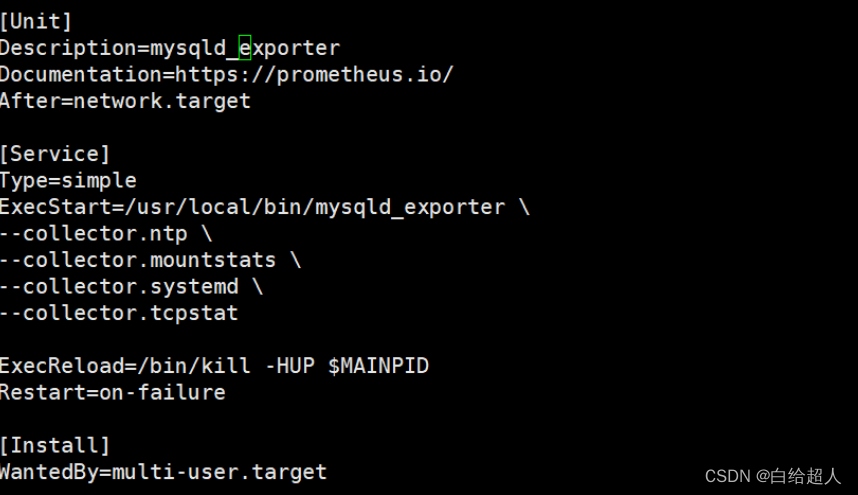
启动node_exporter
systemctl start node_exporter
systemctl enable node_exporter
netstat -natp | grep :9100
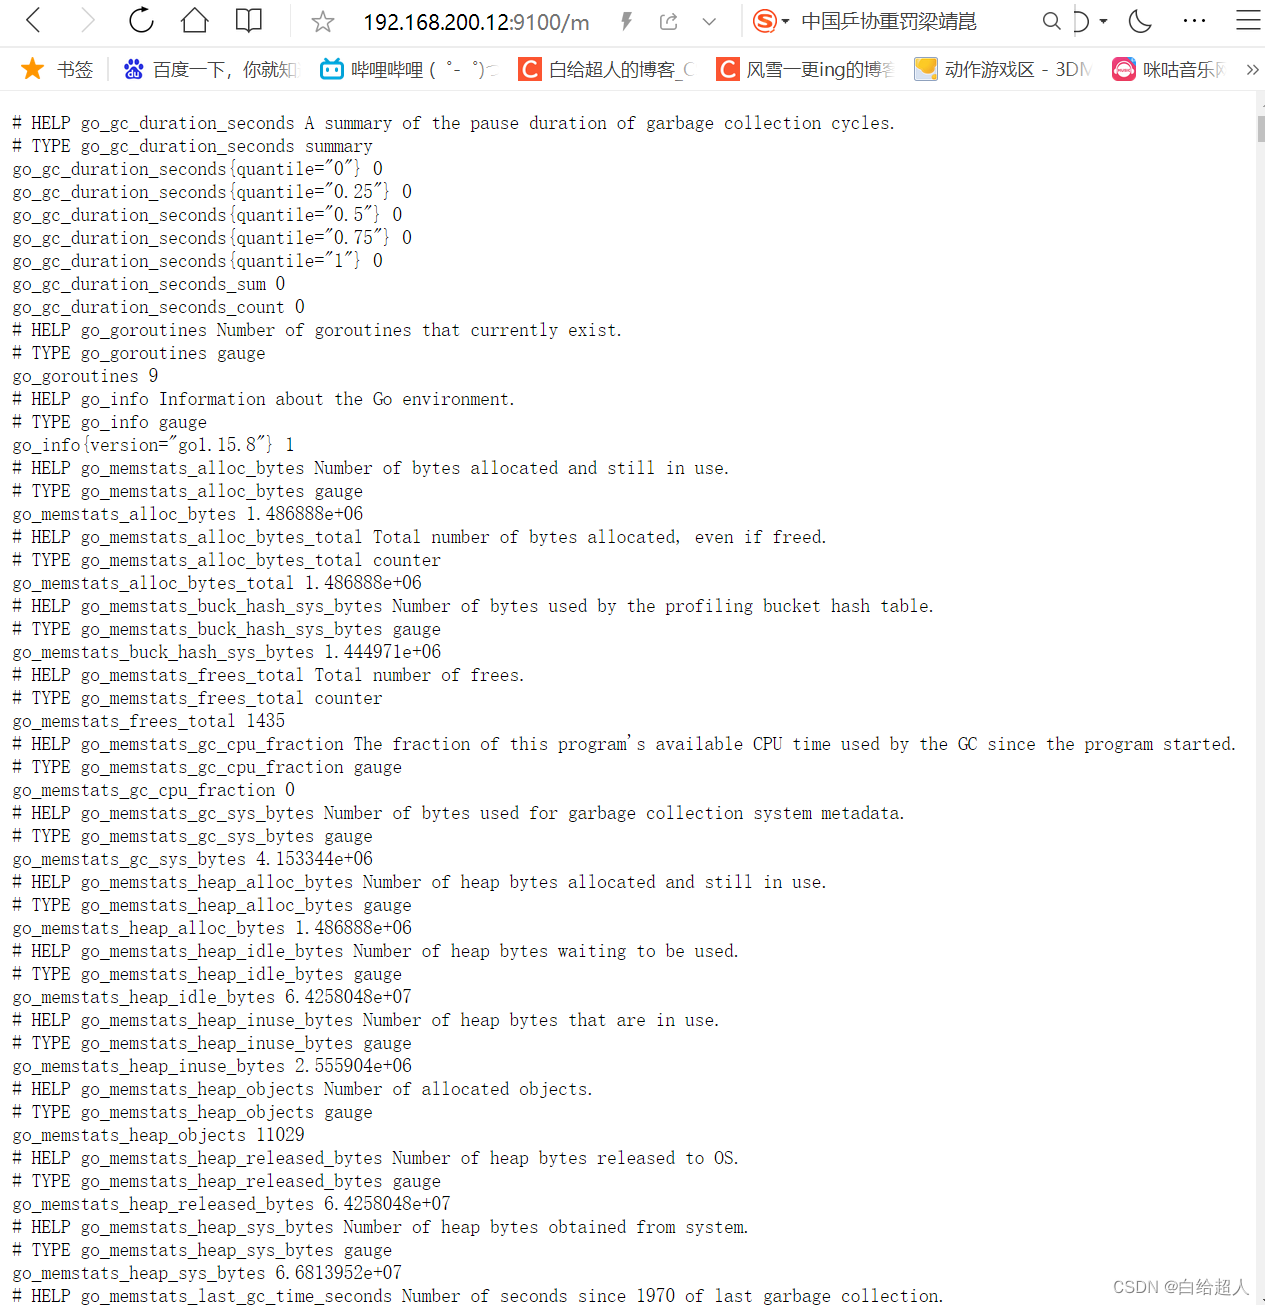
浏览器访问:http://192.168.109.20:9100/metrics ,可以看到 Node Exporter 采集到的指标数据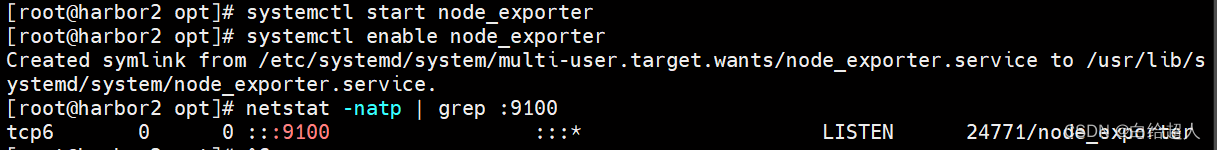
通过浏览器访问 http:// 被监控端 IP:9100/metrics 就可以查看到 node_exporter 在被监控端收集的监控信息:
修改Prometheus服务器的配置文件
回到 Prometheus 服务器(192.168.200.11)的配置文件里添加被监控机器的配置段
vim /usr/local/prometheus/prometheus.yml
  - job_name: 'agent'
    static_configs:
    - targets: ['192.168.200.12:9100']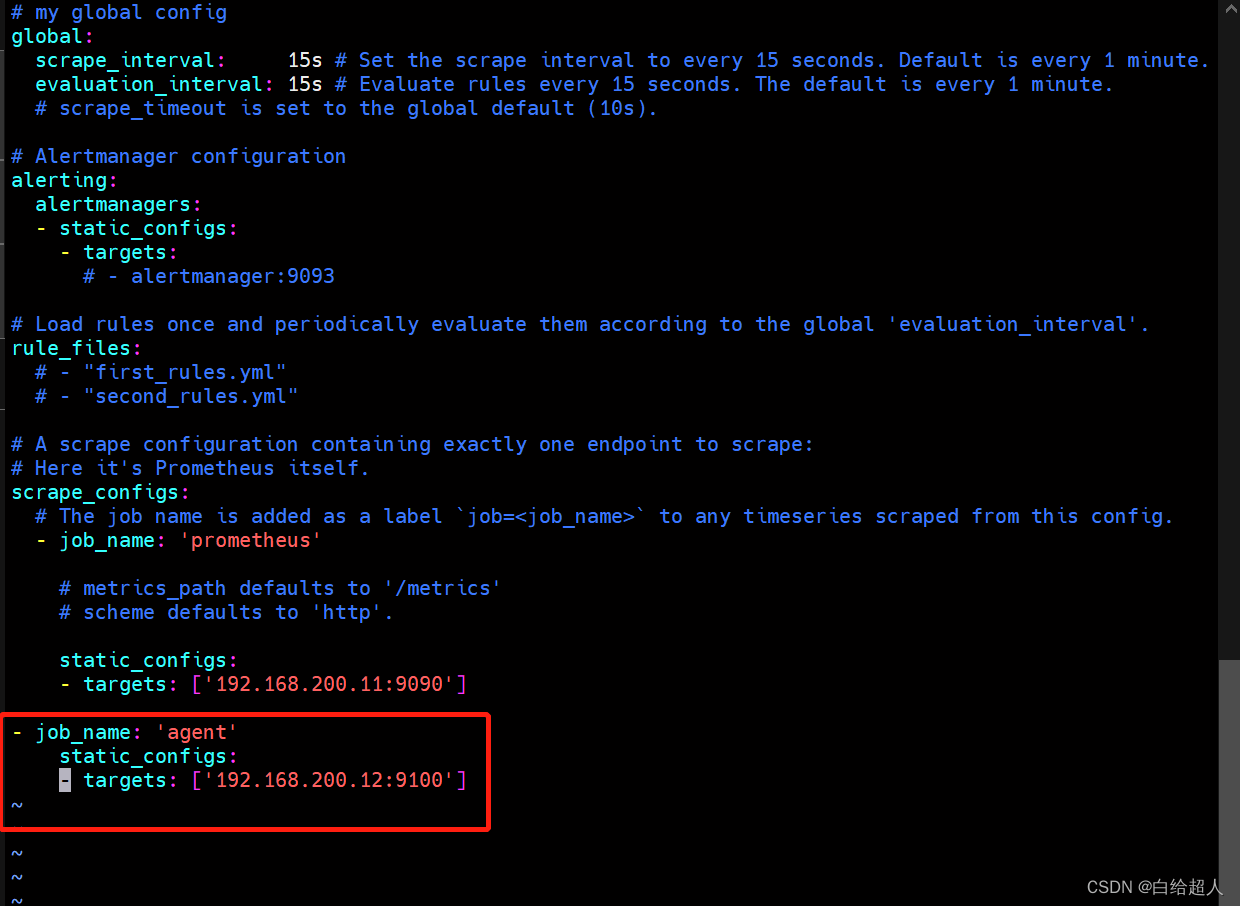
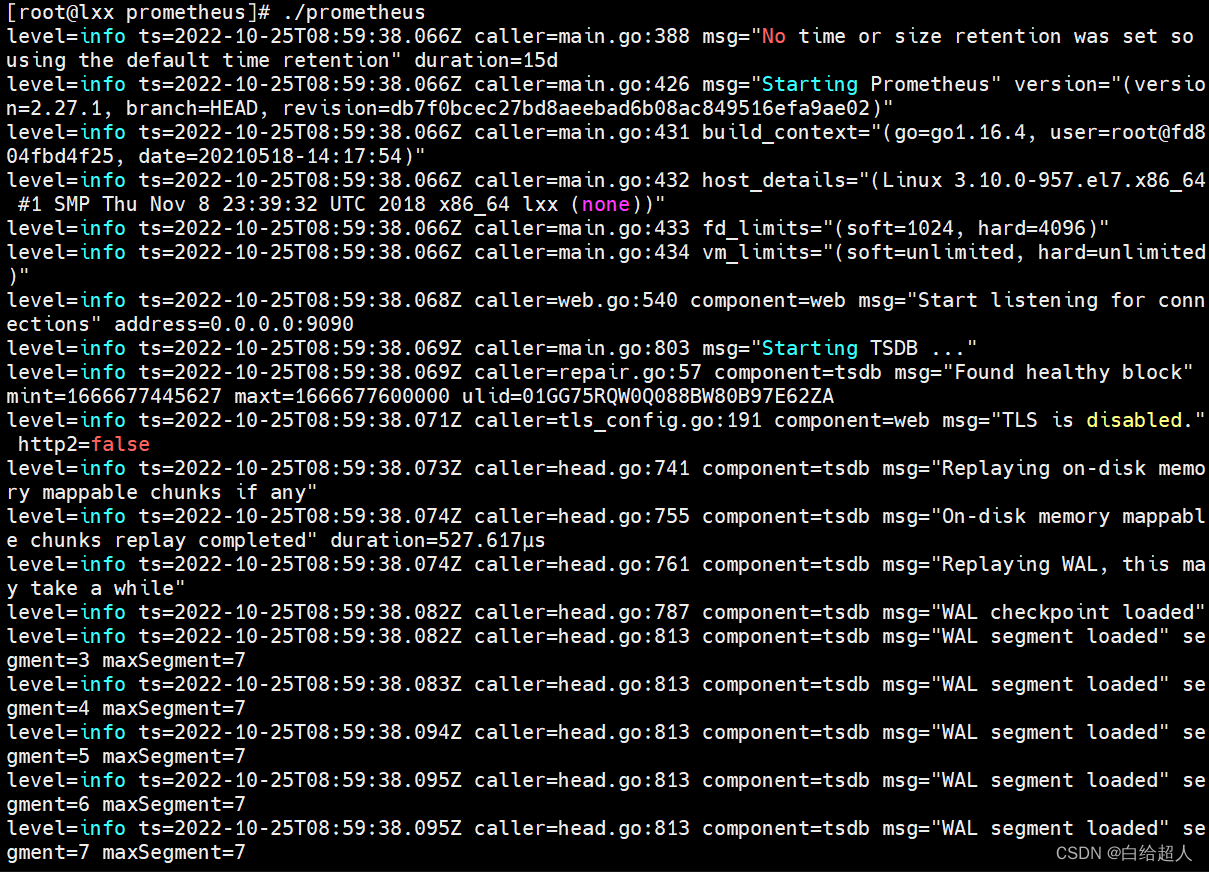
改完配置文件后,重启服务
./prometheus.service ##(启动服务)
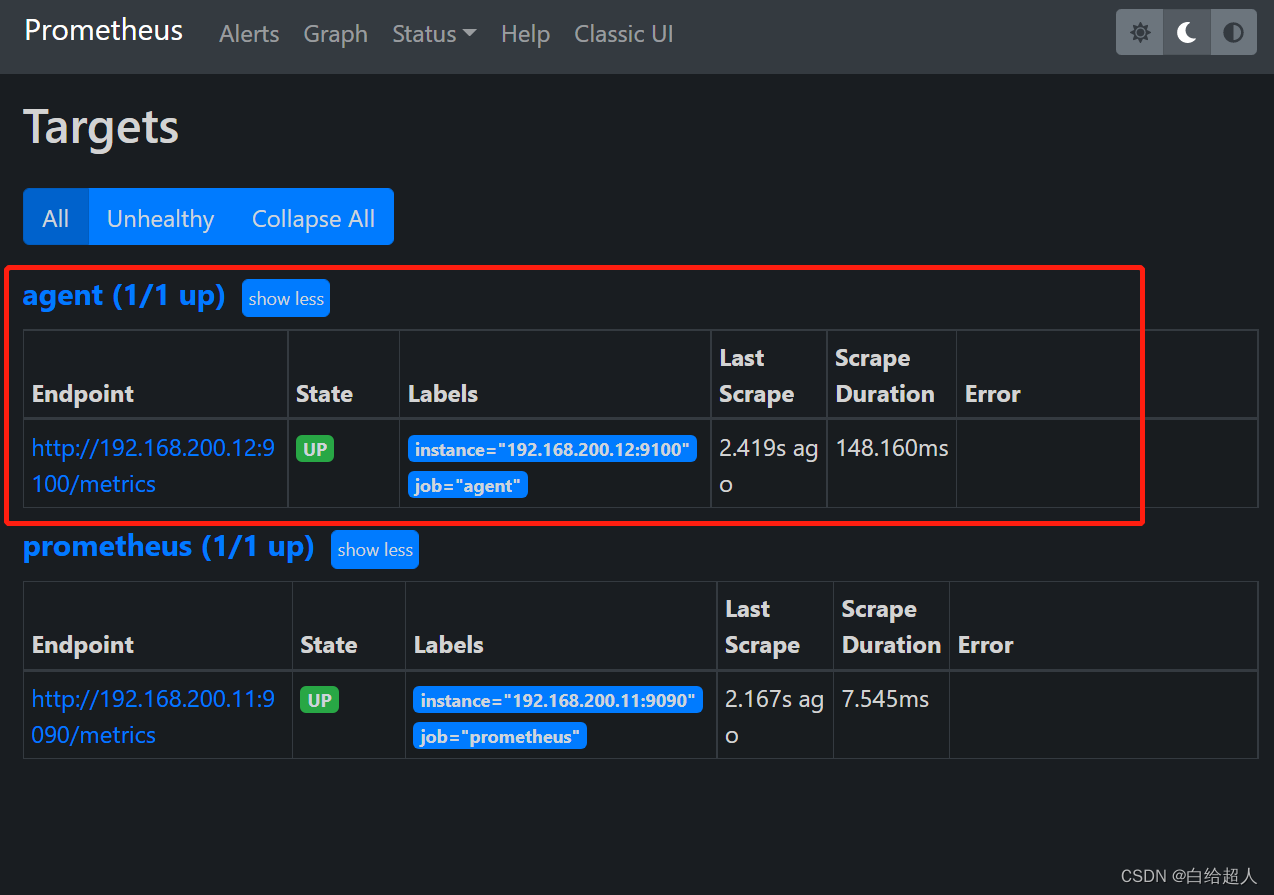
访问prometheus服务器
回到 web 管理界面→点 Status→点 Targets→可以看到多了一台监控目标
也可以在本机安装 node_exporter,使用上面的方式监控
部署Grafana进行展示
Grafana 是一个开源的度量分析和可视化工具,可以通过将采集的数据分析,查询,然后进行可视化的展示,并能实现报警。
下载安装Grafana(192.168.200.13)
#使用yum解决依赖关系  我这边直接上传软件包到opt
yum install -y grafana-7.4.0-1.x86_64.rpm
或
rpm -ivh /opt/grafana-7.3.6-1.x86_64.rpm

systemctl start grafana-server
systemctl enable grafana-server

netstat -natp | grep :3000

浏览器访问:http://192.168.200.13:3000 ,默认账号和密码为 admin/admin
通过浏览器访问 http:// grafana 服务器 IP:3000 就到了登录界面,使用默认的 admin 用户,admin 密码就可以登陆了。

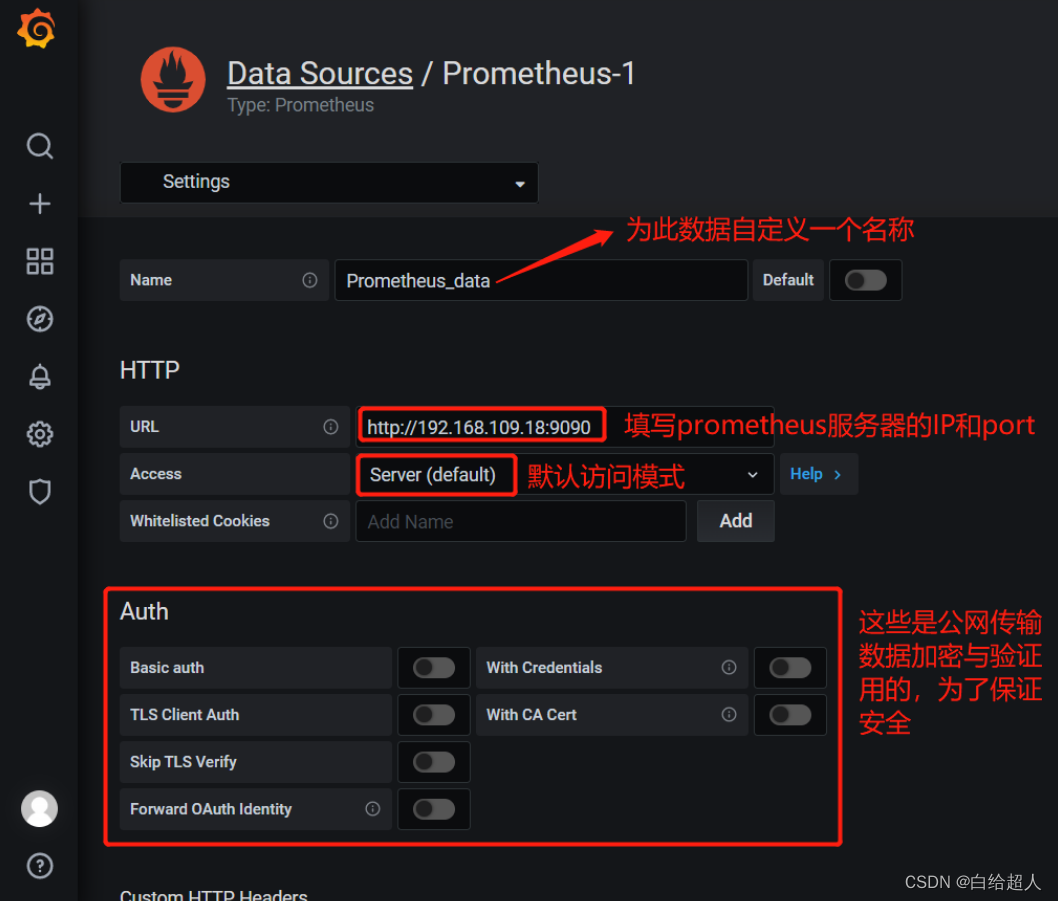
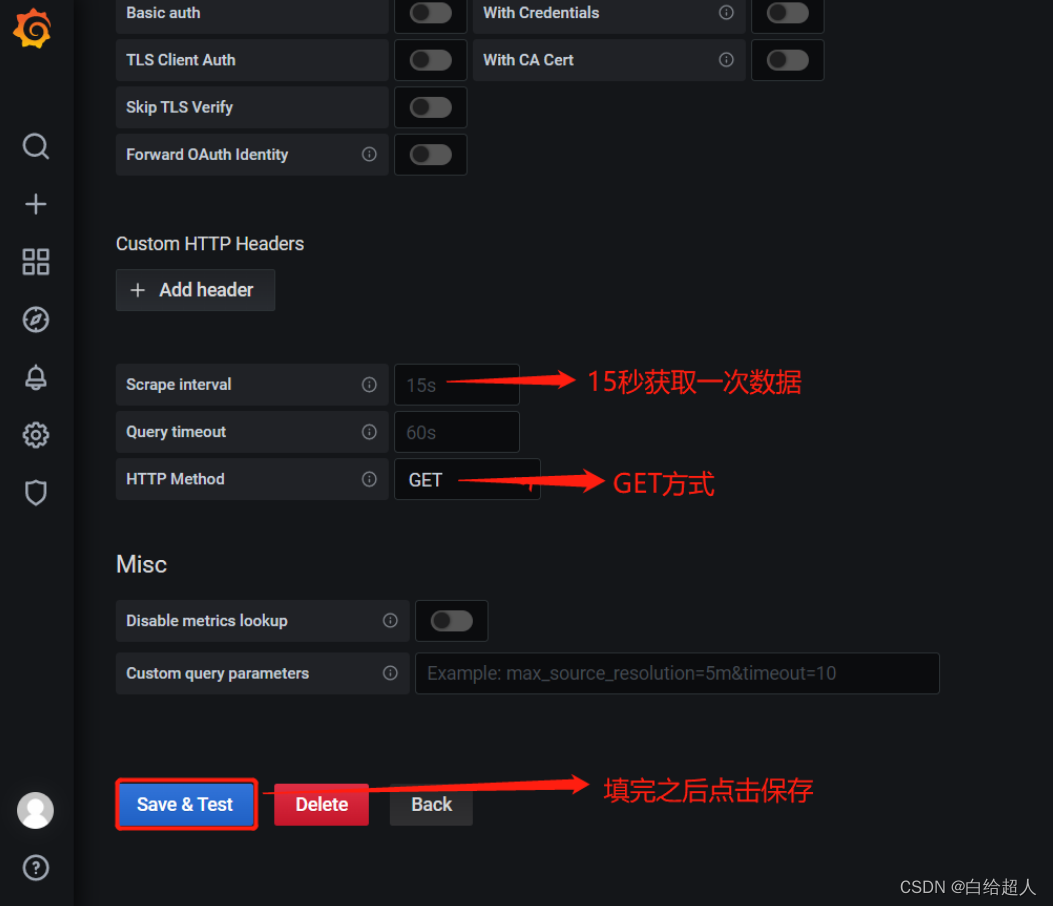
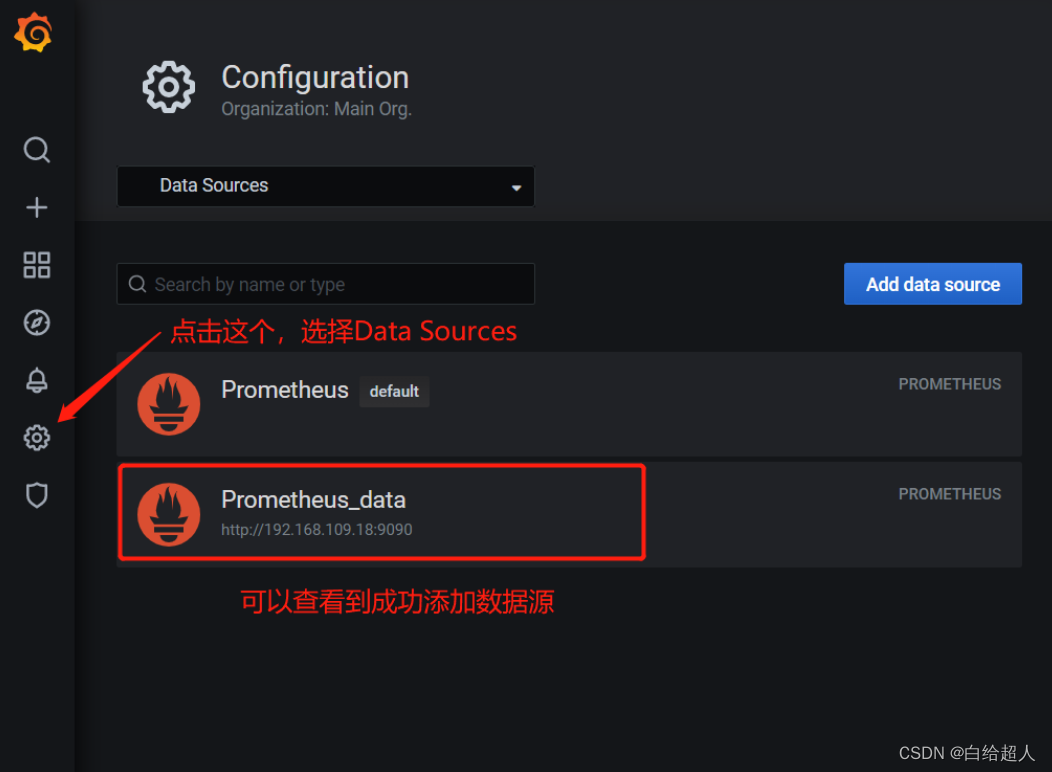
配置数据源
下面我们把 Prometheus 服务器收集的数据做为一个数据源添加到 grafana,让 grafana 可以得到 Prometheus 的数据。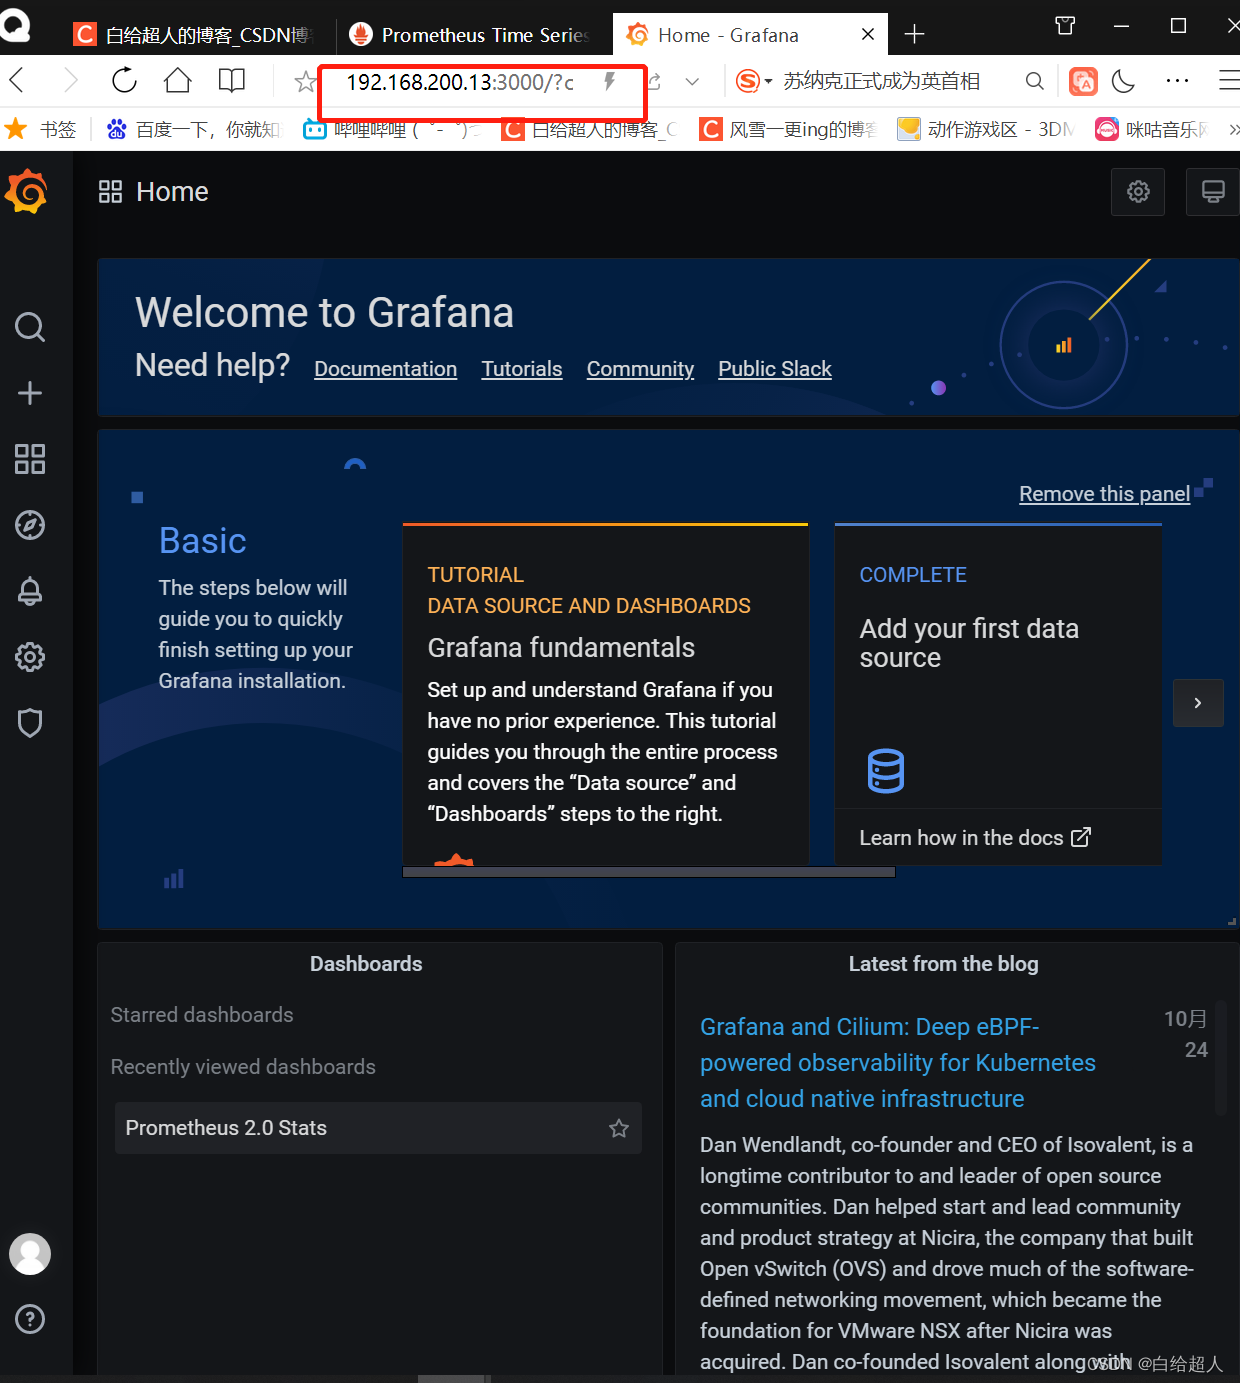
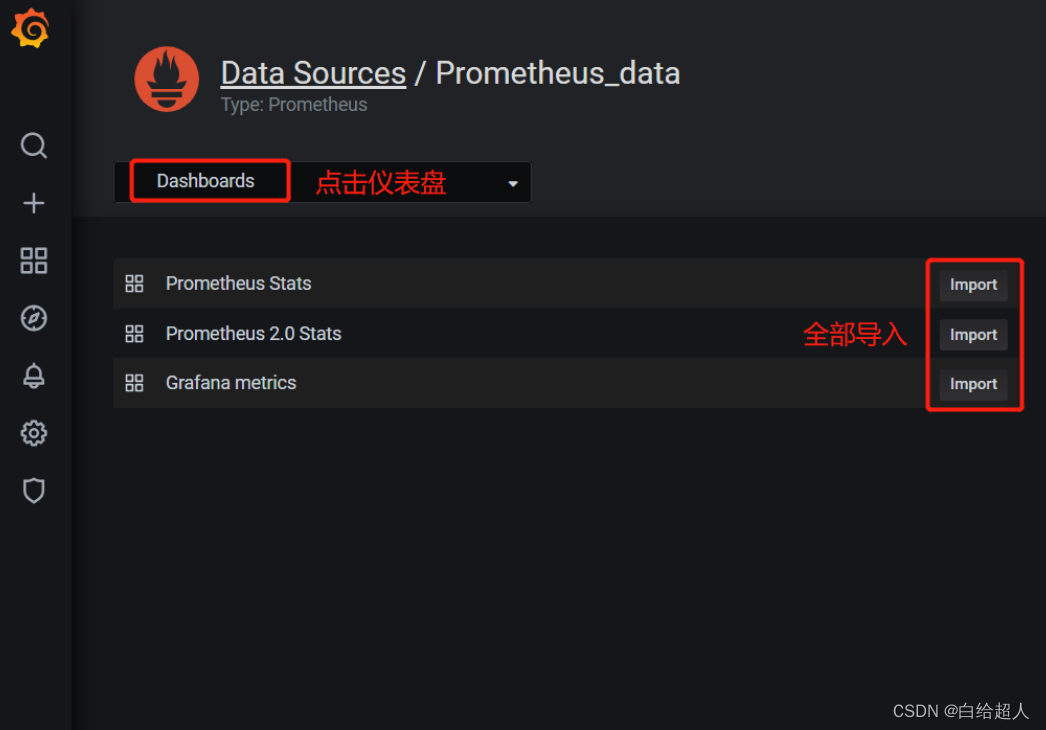
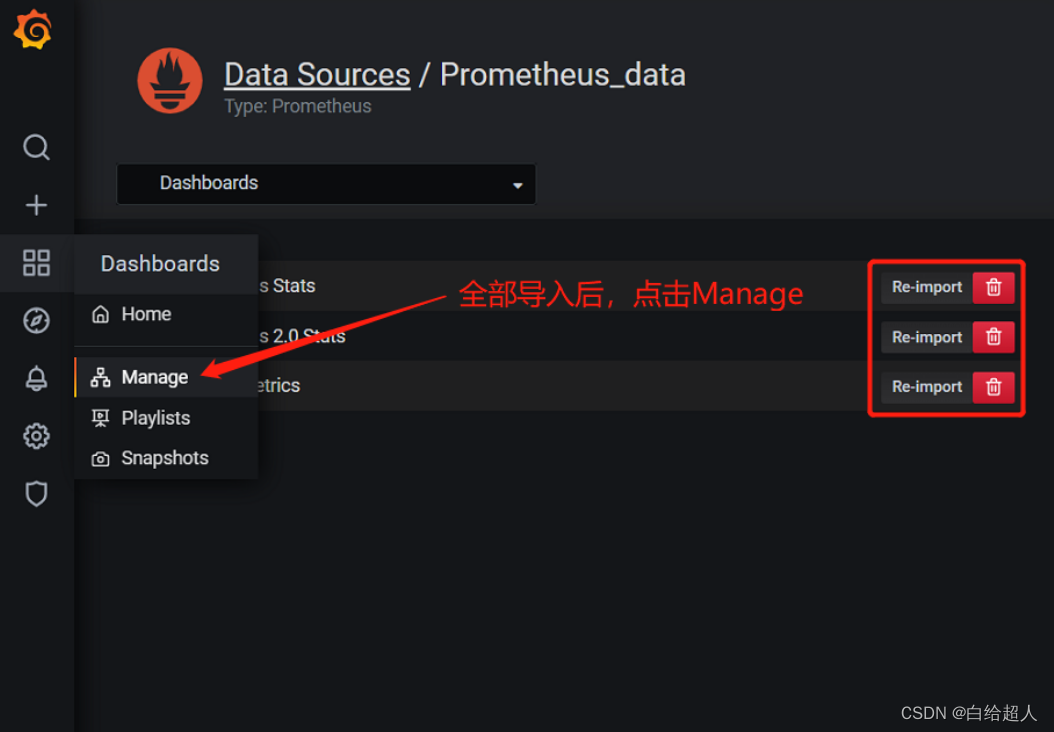
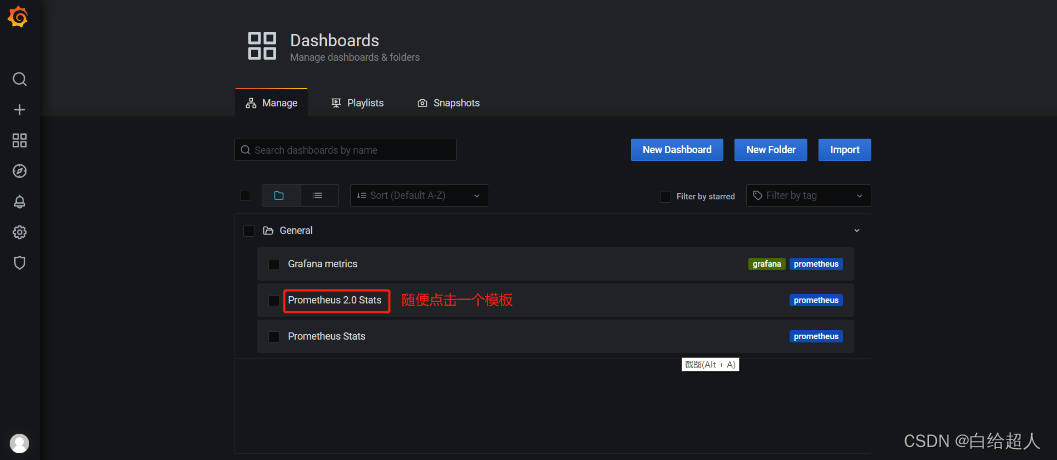
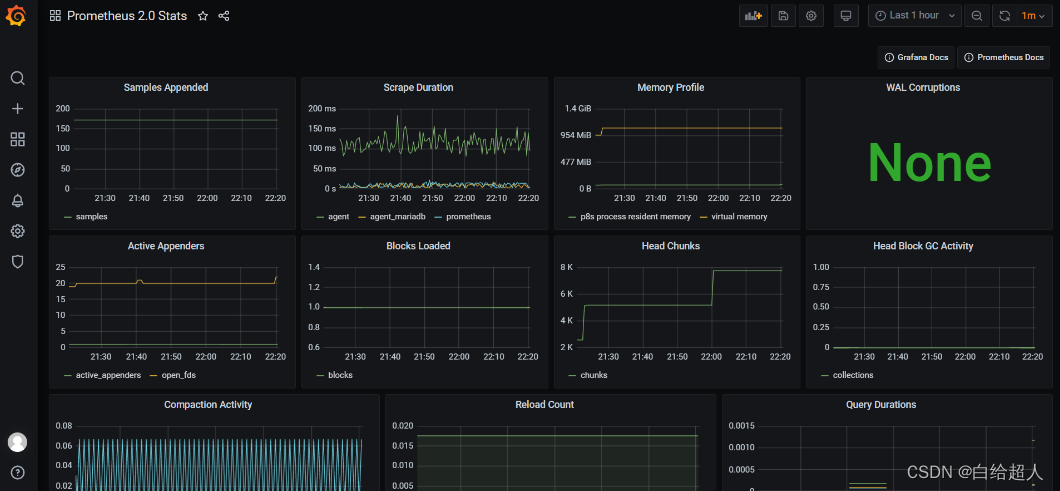
导入模板


 962
962


 被折叠的 条评论
为什么被折叠?
被折叠的 条评论
为什么被折叠?
 到【灌水乐园】发言


