


一、部署Prometheus
[root@prometheus ~]# wget https://github.com/prometheus/prometheus/releases/download/v2.27.1/prometheus-2.27.1.linux-amd64.tar.gz
[root@prometheus ~]# tar xf prometheus-2.27.1.linux-amd64.tar.gz
[root@prometheus ~]# mv prometheus-2.27.1.linux-amd64 /opt/
[root@prometheus ~]# cd /opt/prometheus-2.27.1.linux-amd64/
[root@prometheus prometheus-2.27.1.linux-amd64]# ls
console_libraries  consoles  LICENSE  NOTICE  prometheus  prometheus.yml  promtool
[root@prometheus prometheus-2.27.1.linux-amd64]#
[root@agent prometheus-2.27.1.linux-amd64]# ./prometheus --config.file=prometheus.yml >prometheus.log 2>&1 &
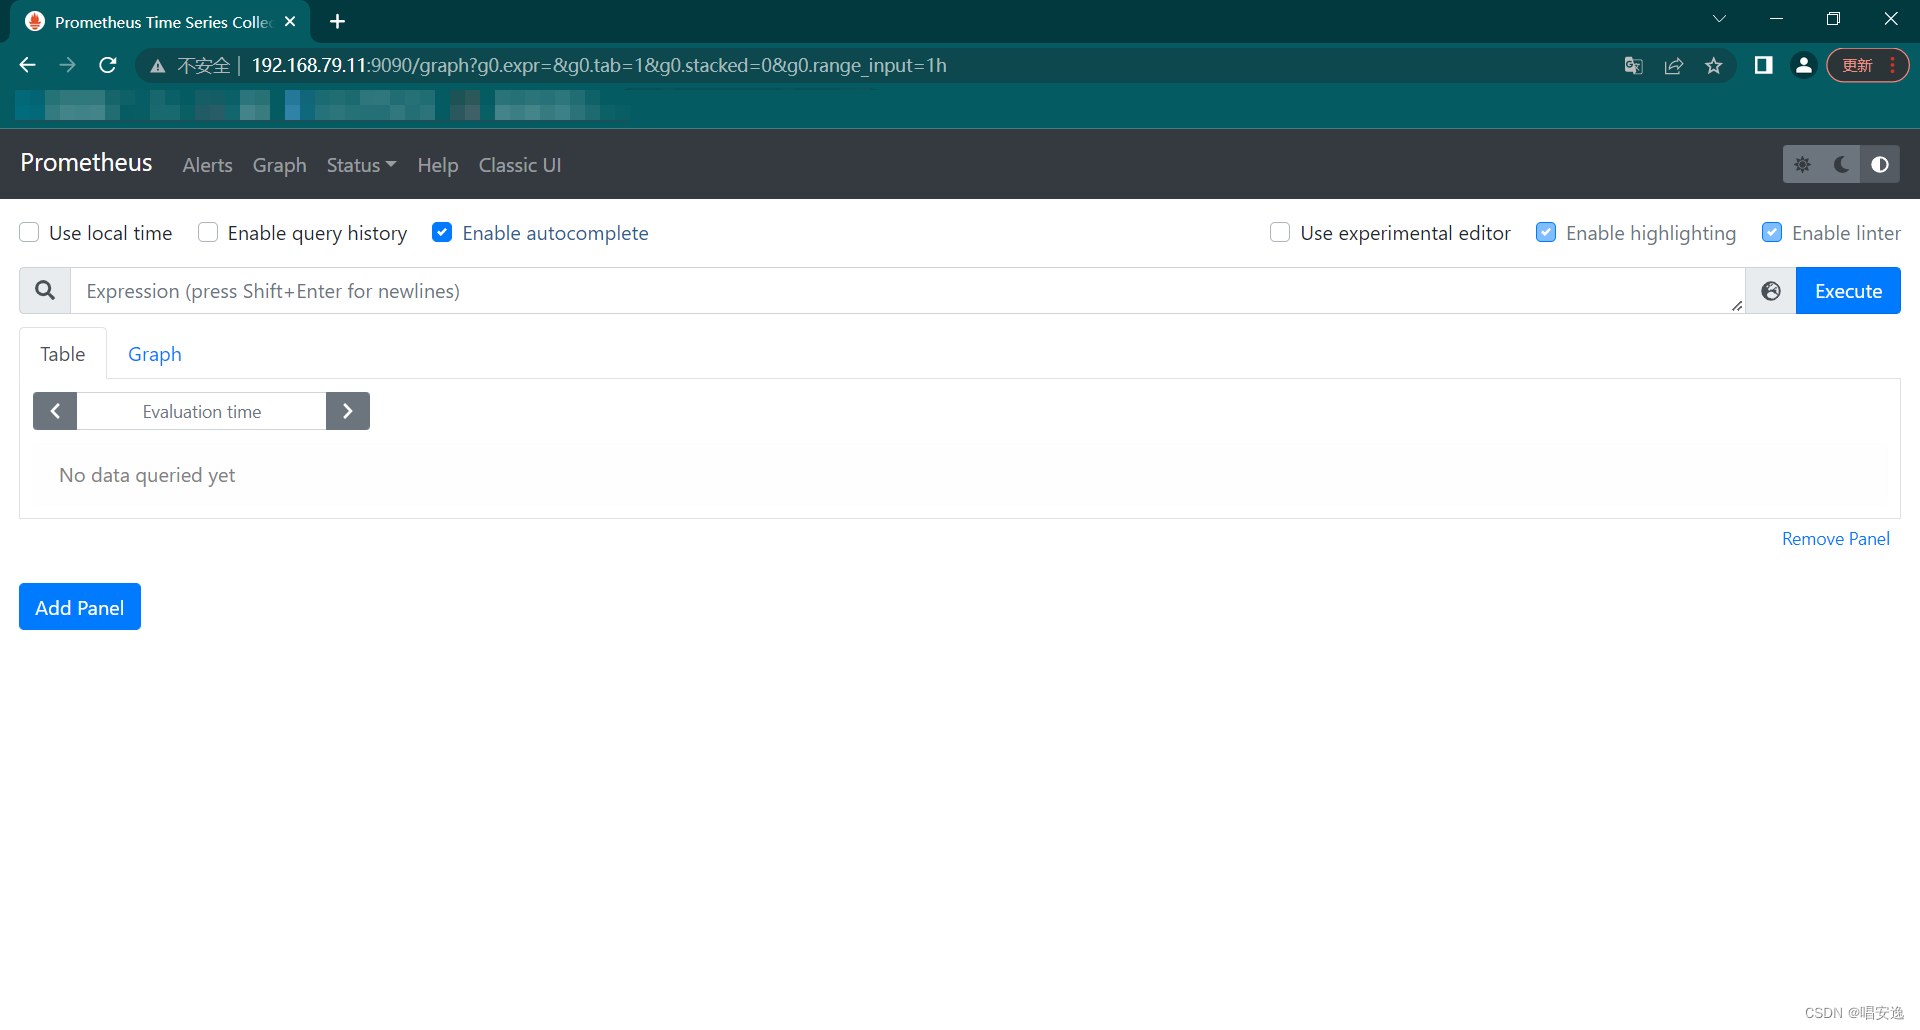
浏览器输入:服务IP:9090,展示以下页面为成功
二、node_exporter安装
[root@agent ~]# wget https://download.fastgit.org/prometheus/node_exporter/releases/download/v1.2.2/node_exporter-1.2.2.linux-amd64.tar.gz
[root@agent ~]# tar fx node_exporter-1.2.2.linux-amd64.tar.gz
[root@agent ~]# mv node_exporter-1.2.2.linux-amd64 /opt/
[root@agent ~]# cd /opt/node_exporter-1.2.2.linux-amd64/
[root@agent node_exporter-1.2.2.linux-amd64]# ls
LICENSE  node_exporter  NOTICE
[root@agent node_exporter-1.2.2.linux-amd64]# ./node_exporter >node.log 2>&1 &
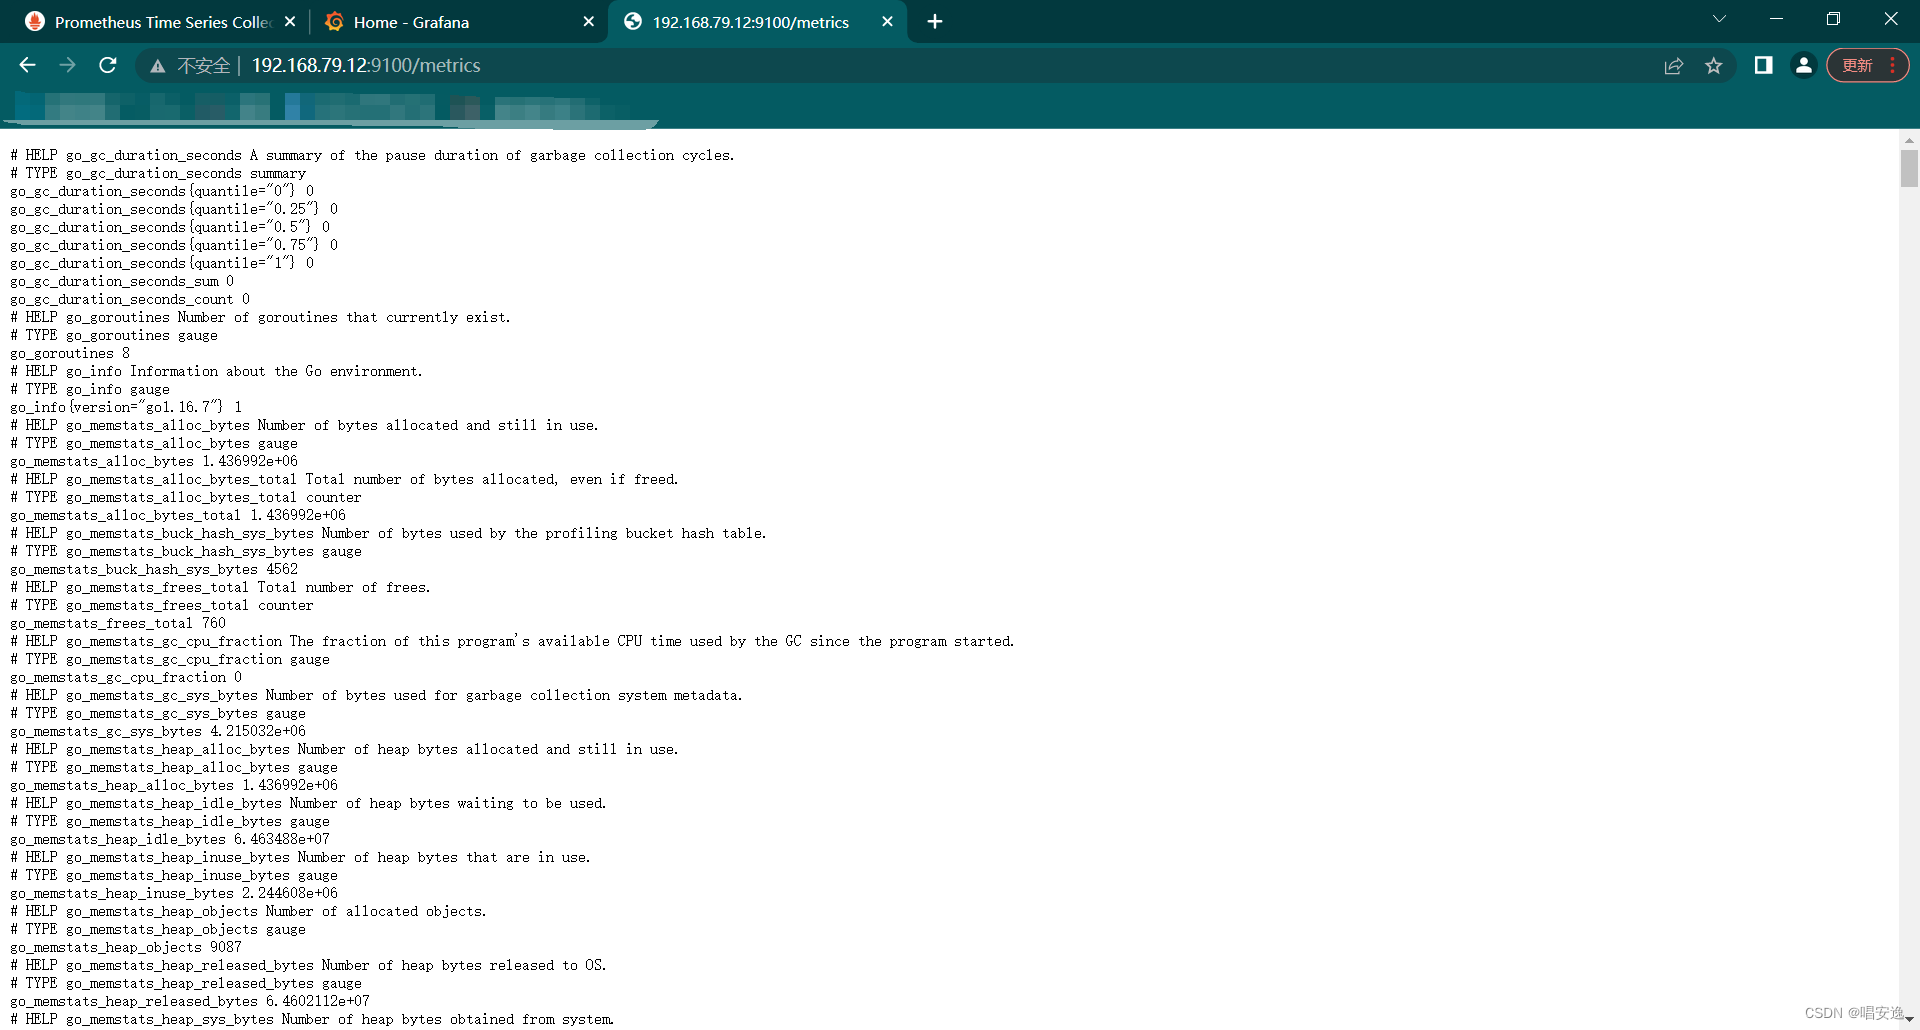
浏览器访问 服务器IP:9100/metrics,展示下面页面为启动成功
三、安装Grafana
[root@prometheus ~]# wget https://dl.grafana.com/enterprise/release/grafana-enterprise-8.5.0.linux-amd64.tar.gz
[root@prometheus ~]# tar xf grafana-enterprise-8.5.0.linux-amd64.tar.gz
[root@prometheus ~]# mv grafana-8.5.0 /opt/
[root@prometheus ~]# [root@prometheus ~]# cd /opt/grafana-8.5.0/
[root@prometheus grafana-8.5.0]# ls
bin  conf  LICENSE  NOTICE.md  plugins-bundled  public  README.md  scripts  VERSION
[root@prometheus grafana-8.5.0]# ./bin/grafana-server web >grafana.log 2>&1 &
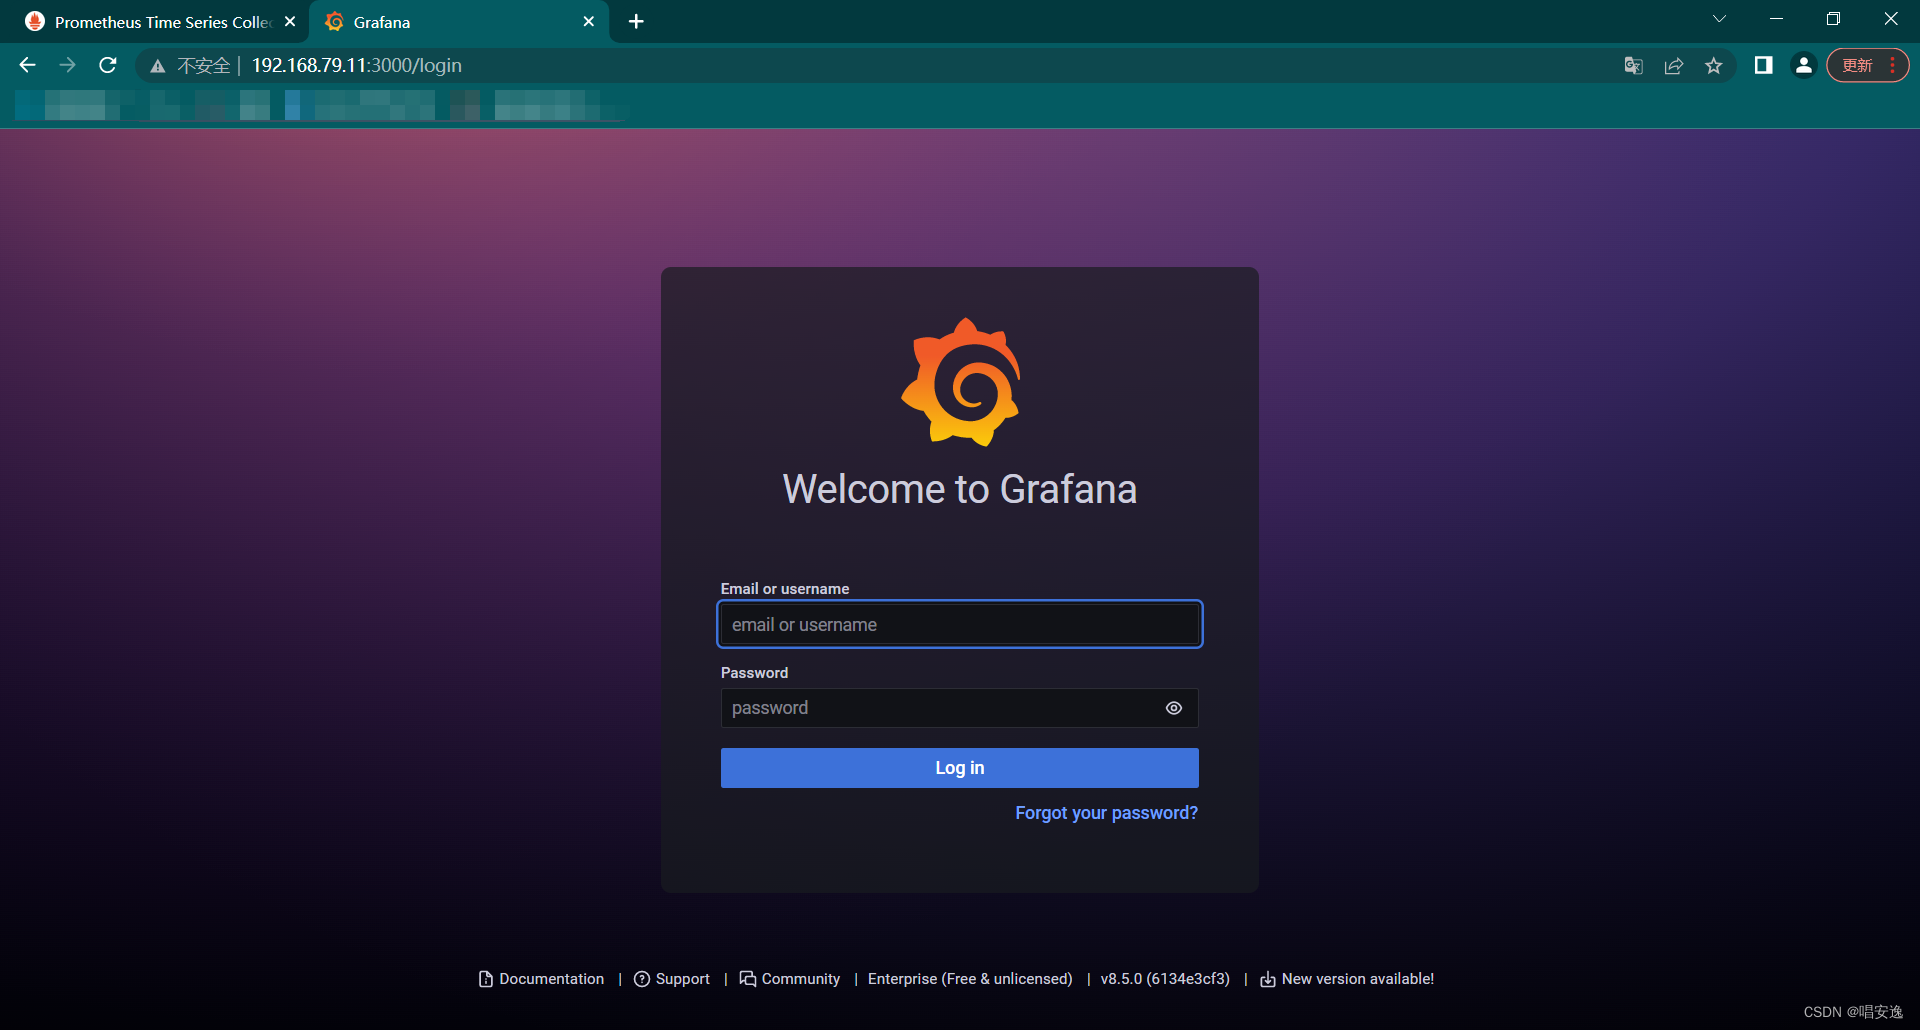
浏览器访问 服务器IP:3000,展示下面页面为启动成功
初始账户密码admin首次登录完成需要修改密码
四、配置
4.1 Prometheus配置
4.1.1 修改配置文件
编辑 prometheus.yml
[root@prometheus grafana-8.5.0]# cd /opt/prometheus-2.27.1.linux-amd64/
[root@prometheus prometheus-2.27.1.linux-amd64]# vim prometheus.yml

# my global config
global:
  scrape_interval:     15s # Set the scrape interval to every 15 seconds. Default is every 1 minute.
  evaluation_interval: 15s # Evaluate rules every 15 seconds. The default is every 1 minute.
  # scrape_timeout is set to the global default (10s).
# Alertmanager configuration
alerting:
  alertmanagers:
  - static_configs:
    - targets:
      # - alertmanager:9093
# Load rules once and periodically evaluate them according to the global 'evaluation_interval'.
rule_files:
  # - "first_rules.yml"
  # - "second_rules.yml"
# A scrape configuration containing exactly one endpoint to scrape:
# Here it's Prometheus itself.
scrape_configs:
  # The job name is added as a label `job=<job_name>` to any timeseries scraped from this config.
  - job_name: 'prometheus'
    # metrics_path defaults to '/metrics'
    # scheme defaults to 'http'.
    static_configs:
    - targets: ['localhost:9090']
# 在这里,把 node_exporter 的 ip 和端口号填上
  - job_name: 'linux_node'
    static_configs:
    - targets: ['192.168.79.12:9100']
      labels:
        nodename: node1
        role: node1
    - targets: ['192.168.79.12:9100']
      labels:
        nodename: node2
        role: node2
    - targets: ['192.168.79.12:9100']
      labels:
        nodename: node3
        role: node3
其大致可分为四部分:
global:
全局配置,其中scrape_interval表示抓取一次数据的间隔时间,evaluation_interval表示进行告警规则检测的间隔时间;
alerting:
告警管理器(Alertmanager)的配置,目前还没有安装Alertmanager;
rule_files:
告警规则有哪些;
scrape_configs:
抓取监控信息的目标。一个job_name就是一个目标,其targets就是采集信息的IP和端口。这里默认监控了Prometheus自己,可以通过修改这里来修改Prometheus的监控端口。Prometheus的每个exporter都会是一个目标,它们可以上报不同的监控信息,比如机器状态,或者mysql性能等等,不同语言sdk也会是一个目标,它们会上报你自定义的业务监控信息。
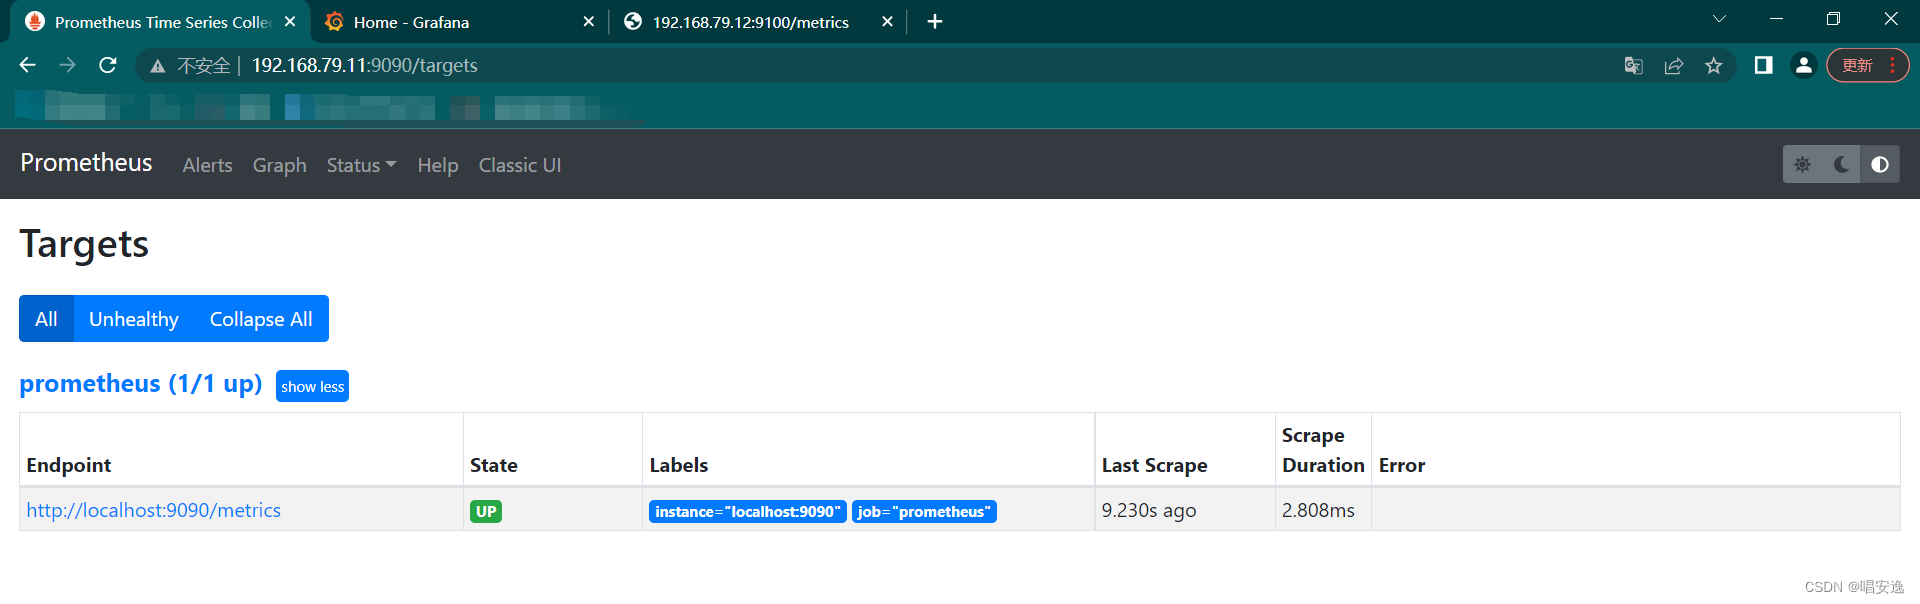
4.1.2 验证配置
浏览器访问http://IP:9090/targets ,node_exporter 信息展示且 state状态为UP
4.2 Grafana 配置
4.2.1 添加prometheus 插件
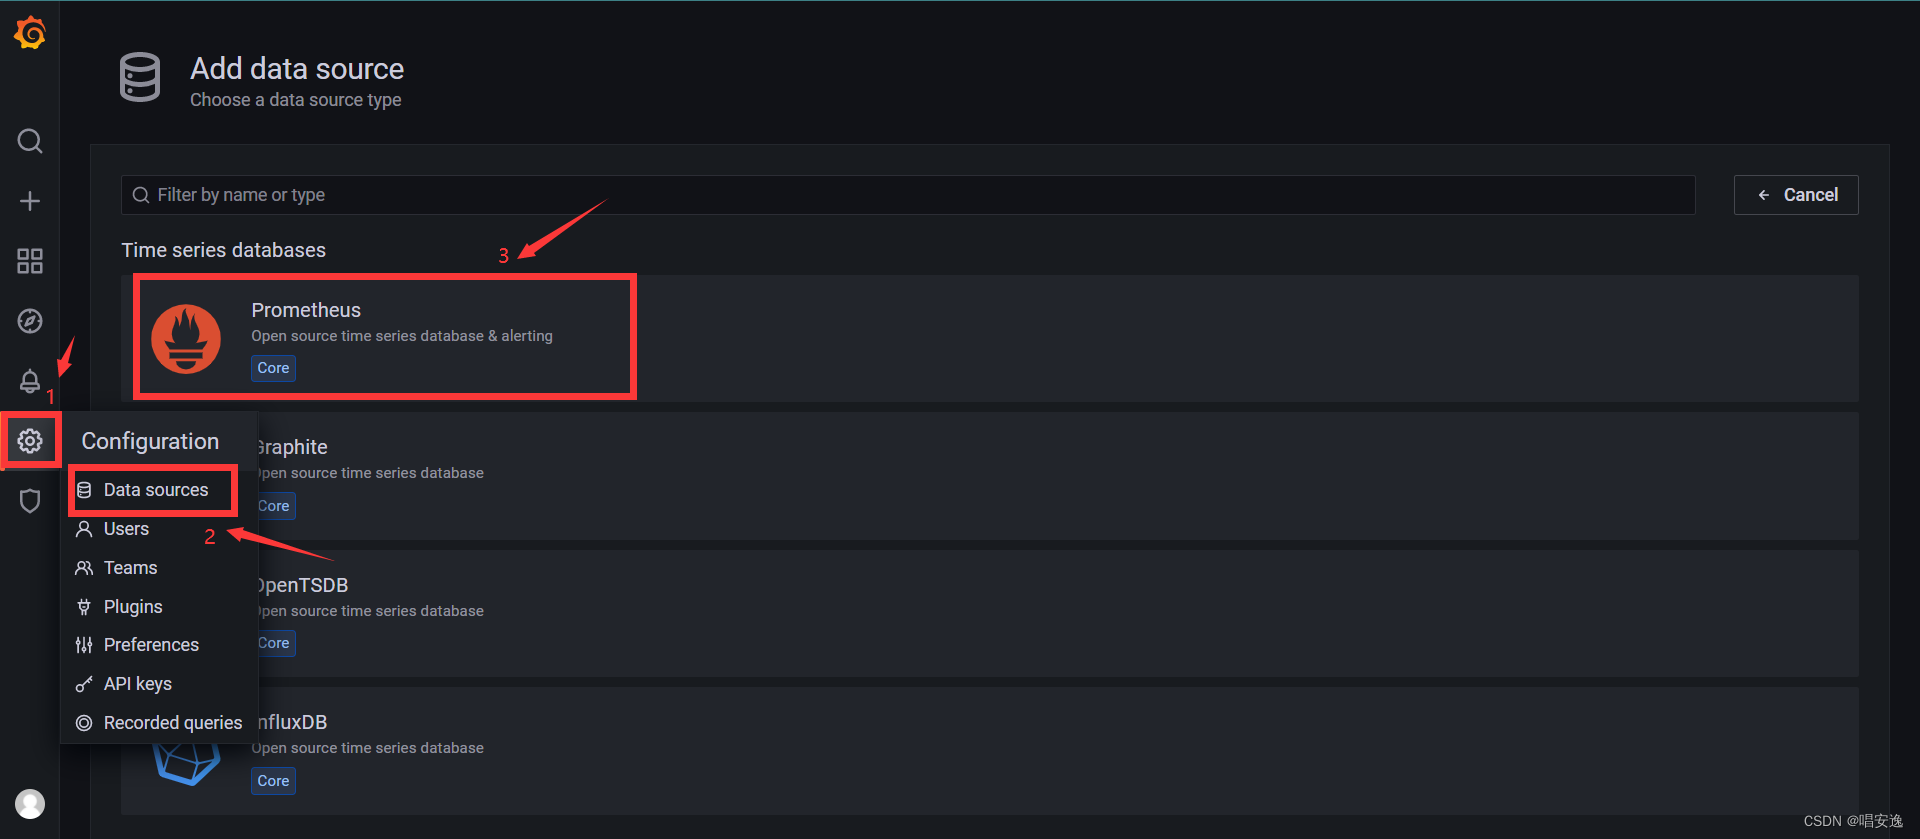
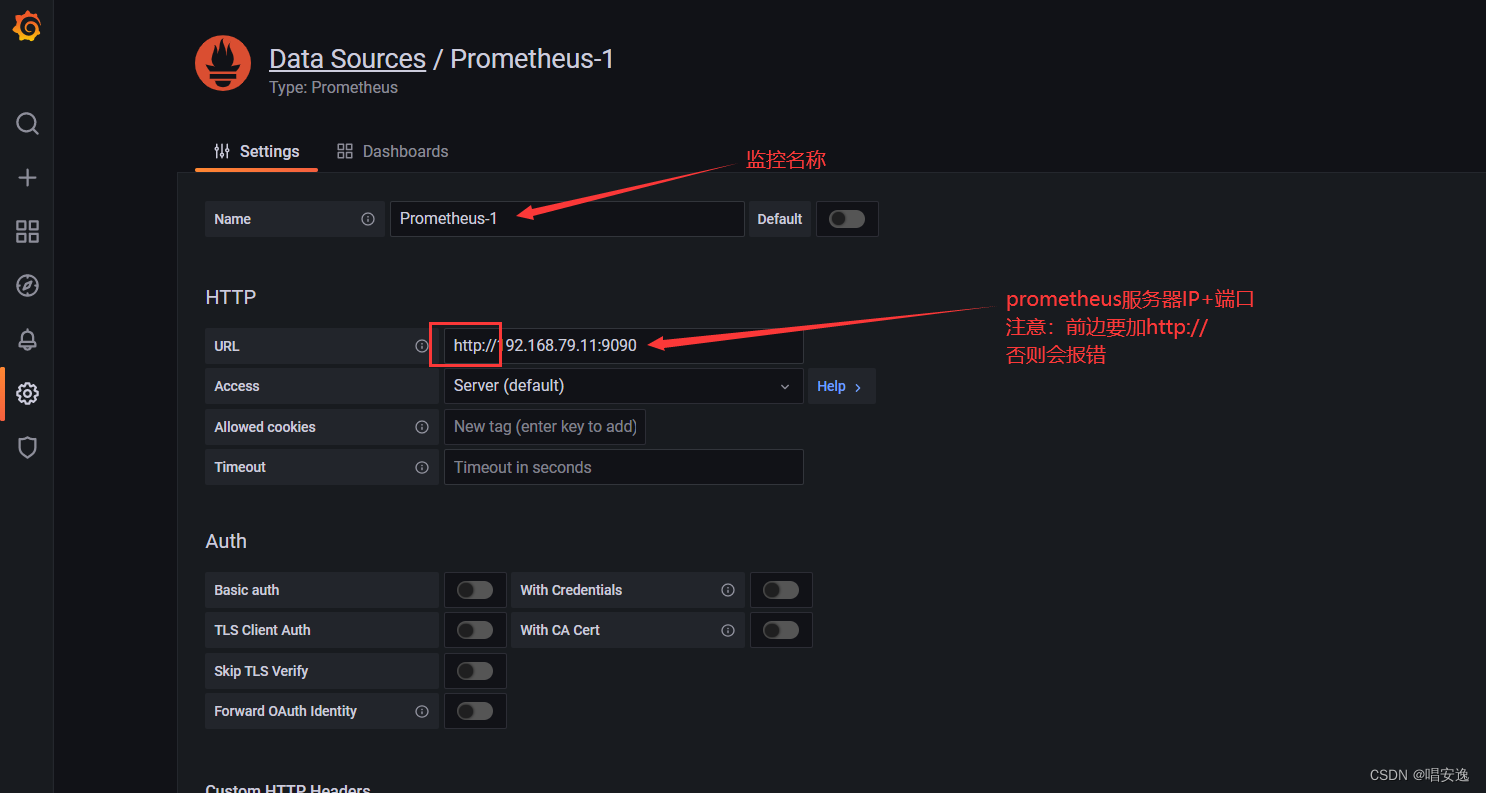
4.2.2 点击并添加 prometheus数据源


 2524
2524


 被折叠的 条评论
为什么被折叠?
被折叠的 条评论
为什么被折叠?
 到【灌水乐园】发言


