记录vue2+elementUI 1.3+echart开发时遇到的一些问题
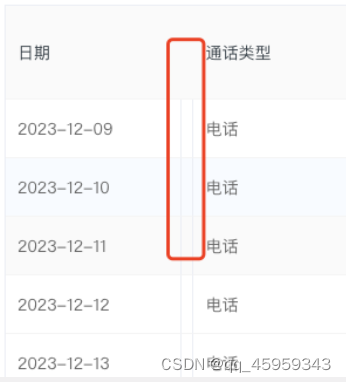
- 1、固定表头时,出现了垂直空隙,把columns配置中的
width换成minWidth就好了, 代码如下。
<el-table-column
	prop="day"
	label="日期"
	fixed
	:min-width="150"
>
- 2、下载语音文件,支持
mp3,wav格式。不会跳转到新页面
<el-button
     v-if="scope.row.url"
     type="text"
     @click="download(scope.row.url)"
>
      下载
</el-button>
download(url, fileName = '') {
if (fileName === '') {
const contentType = url.split('.').pop().toLowerCase()
if (contentType === 'mp3') {
fileName = 'audio.mp3'
} else if (contentType === 'wav') {
fileName = 'audio.wav'
} else {
fileName = 'audio'
}
}
url = url.replace(/^http:/, 'https:')
fetch(url)
.then(response => response.blob())
.then(blob => {
const url = window.URL.createObjectURL(blob)
const a = document.createElement('a')
a.style.display = 'none'
a.href = url
a.download = fileName
document.body.appendChild(a)
a.click()
document.body.removeChild(a)
window.URL.revokeObjectURL(url)
})
.catch(error => {
console.error('下载失败:', error)
})
}
<template>
<div>
<v-chart
autosize
style="width:100%;height:250px;"
ref="statisticsLine"
:options="options"
/>
</div>
</template>
<script lang="ts">
import { Vue, Component, Prop, Watch } from 'vue-property-decorator'
import ECharts from 'vue-echarts'
import 'echarts/lib/component/title'
import 'echarts/lib/component/legend'
import 'echarts/lib/component/tooltip'
import 'echarts/lib/chart/line'
import { callType } from './config'
import formatSeconds from '@/common/functions/formatSeconds'
@Component({
components: {
'v-chart': ECharts
}
})
class EchartsLine extends Vue {
@Prop({
type: Array,
default: () => []
})data
@Prop({
type: Number,
default: 1
})type
callType = callType
options: Object = {}
decs: String = '呼出总数'
initOptions: Object = {
renderer: 'svg'
}
@Watch('data')
changeData(val) {
this.setOptions()
}
@Watch('type')
changeType(val) {
this.decs = this.callType[this.type - 1].label
this.setOptions()
}
mounted() {
this.decs = this.callType[this.type - 1].label
this.$nextTick(() => {
this.setOptions()
})
}
descData() {
let arr: Array<any> = []
this.data.forEach((val: any) => {
arr.push(val.count)
})
if (arr?.length) {
if (String(arr[0]).indexOf('%') > -1) {
arr = arr.map((val: any) => {
return Number(val.replace('%', '')) / 100
})
}
}
return arr
}
setOptions() {
let count: Array<any> = []
let day: Array<any> = []
this.data.forEach((val: any) => {
count.push(val.count)
day.push(val.day)
})
const that = this
let tooltip = {
trigger: 'axis',
formatter: function (params) {
console.log(params)
let res = `<div style="display: flex;margin:0 6px">${params[0].seriesName}:<div style="margin-left: 6px;">${params[0].data}</div></div>`
console.log('this', this, that)
if (that.type > 9) {
res = `<div style="display: flex;margin:0 6px">${params[0].seriesName}:<div style="margin-left: 6px;">${formatSeconds(params[0].data)}</div></div>`
}
if (that.type === 3 || that.type === 6 || that.type === 9) {
res = `<div style="display: flex;margin:0 6px">${params[0].seriesName}:<div style="margin-left: 6px;">${params[0].data * 100}%</div></div>`
}
return res
}
}
let xAxis = {
type: 'category',
data: day,
boundaryGap: false,
axisTick: {
show: false,
alignWithLabel: true
},
splitLine: { show: false },
splitArea: { show: false },
axisPointer: {
handle: {
show: that.data.length === 1 ? true : false,
size: 0
},
type: 'line',
}
}
let series = [
{
name: this.decs,
data: this.descData(),
type: 'line',
lineStyle: {
color: '#3371FF'
},
showSymbol: false,
hoverAnimation: false,
showAllSymbol: true
},
]
this.options = {
xAxis,
series,
yAxis: {
type: 'value'
},
tooltip
}
let echarts: any = this.$refs.statisticsLine
echarts.mergeOptions(this.options)
}
}
export default EchartsLine
</script>


 7679
7679


 被折叠的 条评论
为什么被折叠?
被折叠的 条评论
为什么被折叠?
 到【灌水乐园】发言


