一个好看的echart折线统计图案例

function smartsecurity() {
    const ele = document.getElementById('secuchart')
    if (!ele) return
    ele.removeAttribute("_echarts_instance_")
    let lineChart = echarts.init(ele);
    lineChart.setOption({
        grid: {
            left: '30px',
            right: '10px',
            bottom: '5px',
            top: '35px',
            containLabel: true
        },
        xAxis: [
            {
                show: true,
                type: 'category',
                boundaryGap: ['10%', '10%'], // 设置第一个数和最后一个数距离轴边界的距离为轴刻度的 10%
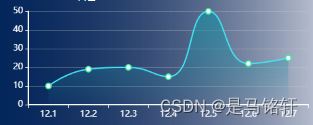
                data: ['12.1', '12.2', '12.3', '12.4', '12.5', '12.6', '12.7'],
                axisLabel: {
                    show: true,    //这行代码控制着坐标轴x轴的文字是否显示
                    textStyle: {
                        color: '#fff',   //x轴上的字体颜色
                        fontSize: '13px'    // x轴字体大小
                    }
                },
                axisLine: {
                    lineStyle: {
                        color: '#fff',
                        width: 2,
                    }
                },

            }
        ],
        yAxis: [
            {
                show: true,
                type: 'value',
                axisLabel: {
                    show: true,
                    textStyle: {
                        color: '#fff',   //x轴上的字体颜色
                        fontSize: '13px'    // x轴字体大小
                    }
                },
                splitLine: {
                    show: true,   // 网格线是否显示
                    lineStyle: {
                        type: 'dashed',
                        color: '#ccc',
                        width: 0.5,
                    } 
                },
                axisTick: { //y轴刻度线
                    show: true
                },
                axisLine: { //y轴 
                    show: true,
                    lineStyle: {
                        color: '#fff',
                        width: 2,
                    }
                },

            },

        ],
        series: [
            {
                name: '用电量',
                type: 'line',
                symbolSize: 8, // 设置点的大小
                itemStyle: {
                    color: '#47edabFF' // 设置点的颜色
                },
                stack: 'Total',
                label: {
                    show: false,
                },
                emphasis: {
                    focus: 'series'
                },
                data: [10, 19, 20, 15, 50, 22, 25],
                smooth: true,
                areaStyle: {
                    color: new echarts.graphic.LinearGradient(
                        0, 1, 0, 0,
                        [
                            { offset: 0, color: 'rgba(27, 143, 163, 0.048)' },
                            { offset: 1, color: '#1b8fa3FF' }
                        ]
                    ),
                },
                lineStyle: {
                    color: '#42e4f2'

                },

            }
        ]
    });
}

效果图:


评论 1
添加红包

请填写红包祝福语或标题

红包个数最小为10个

红包金额最低5元

当前余额3.43前往充值 >
需支付:10.00
成就一亿技术人!
领取后你会自动成为博主和红包主的粉丝 规则
hope_wisdom
发出的红包
实付
使用余额支付
点击重新获取
扫码支付
钱包余额 0

抵扣说明:

1.余额是钱包充值的虚拟货币,按照1:1的比例进行支付金额的抵扣。
2.余额无法直接购买下载,可以购买VIP、付费专栏及课程。

余额充值