


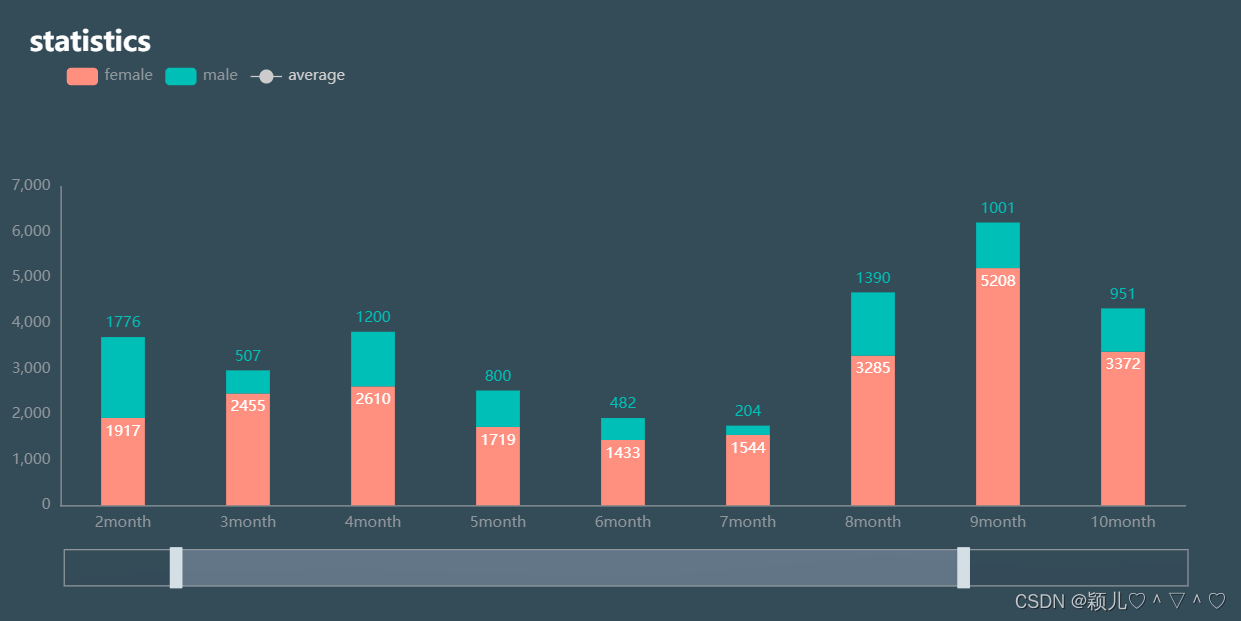
功能、效果图:
鼠标放到对应月份区域可看到数据
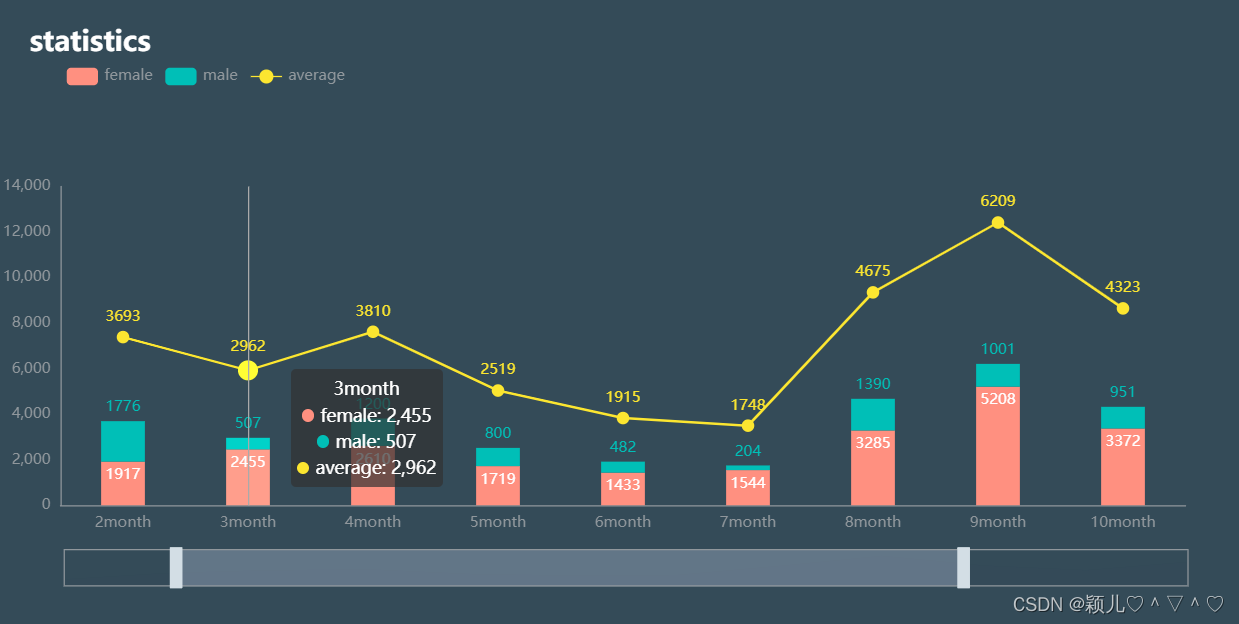
点击上方对应按钮,下方相应的数据图可隐藏/显示
可选择月份查看


代码:
components/HelloWorld.vue
<template>
  <div :id="id" :class="className" :style="{ height: height, width: width }" />
</template>

<script>
import echarts from "echarts";
import resize from "./minxins/resize";

export default {
  mixins: [resize],
  props: {
    className: {
      type: String,
      default: "chart",
    },
    id: {
      type: String,
      default: "chart",
    },
    width: {
      type: String,
      default: "1000px",
    },
    height: {
      type: String,
      default: "500px",
    },
  },
  data() {
    return {
      chart: null,
    };
  },
  mounted() {
    this.initChart();
  },
  beforeDestroy() {
    if (!this.chart) {
      return;
    }
    this.chart.dispose();
    this.chart = null;
  },
  methods: {
    // 月
    initChart() {
      this.chart = echarts.init(document.getElementById(this.id));
      const xData = (function () {
        const data = [];
        for (let i = 1; i < 13; i++) {
          data.push(i + "month");
        }
        return data;
      })();
      this.chart.setOption({
        backgroundColor: "#344b58",
        title: {
          text: "statistics",
          x: "20",
          top: "20",
          textStyle: {
            color: "#fff",
            fontSize: "22",
          },
          subtextStyle: {
            color: "#90979c",
            fontSize: "16",
          },
        },
        tooltip: {
          trigger: "axis",
          axisPointer: {
            textStyle: {
              color: "#fff",
            },
          },
        },
        grid: {
          left: "5%",
          right: "5%",
          borderWidth: 0,
          top: 150,
          bottom: 95,
          textStyle: {
            color: "#fff",
          },
        },
        legend: {
          x: "5%",
          top: "10%",
          textStyle: {
            color: "#90979c",
          },
          data: ["female", "male", "average"],
        },
        calculable: true,
        // x轴
        xAxis: [
          {
            type: "category",
            axisLine: {
              lineStyle: {
                color: "#90979c",
              },
            },
            splitLine: {
              show: false,
            },
            axisTick: {
              show: false,
            },
            splitArea: {
              show: false,
            },
            axisLabel: {
              interval: 0,
            },
            data: xData,
          },
        ],
        // y轴
        yAxis: [
          {
            type: "value",
            splitLine: {
              show: false,
            },
            axisLine: {
              lineStyle: {
                color: "#90979c",
              },
            },
            axisTick: {
              show: false,
            },
            axisLabel: {
              interval: 0,
            },
            splitArea: {
              show: false,
            },
          },
        ],
        dataZoom: [
          {
            show: true,
            height: 30,
            xAxisIndex: [0],
            bottom: 30,
            start: 10,
            end: 80,
            handleIcon:
              "path://M306.1,413c0,2.2-1.8,4-4,4h-59.8c-2.2,0-4-1.8-4-4V200.8c0-2.2,1.8-4,4-4h59.8c2.2,0,4,1.8,4,4V413z",
            handleSize: "110%",
            handleStyle: {
              color: "#d3dee5",
            },
            textStyle: {
              color: "#fff",
            },
            borderColor: "#90979c",
          },
          {
            type: "inside",
            show: true,
            height: 15,
            start: 1,
            end: 35,
          },
        ],
        // 数据
        series: [
          {
            // 女性数据
            name: "female",
            type: "bar",
            stack: "total",
            barMaxWidth: 35,
            barGap: "10%",
            itemStyle: {
              normal: {
                color: "rgba(255,144,128,1)",
                label: {
                  show: true,
                  textStyle: {
                    color: "#fff",
                  },
                  position: "insideTop",
                  formatter(p) {
                    return p.value > 0 ? p.value : "";
                  },
                },
              },
            },
            data: [
              709, 1917, 2455, 2610, 1719, 1433, 1544, 3285, 5208, 3372, 2484,
              4078,
            ],
          },
          // 男性数据
          {
            name: "male",
            type: "bar",
            stack: "total",
            itemStyle: {
              normal: {
                color: "rgba(0,191,183,1)",
                barBorderRadius: 0,
                label: {
                  show: true,
                  position: "top",
                  formatter(p) {
                    return p.value > 0 ? p.value : "";
                  },
                },
              },
            },
            data: [
              327, 1776, 507, 1200, 800, 482, 204, 1390, 1001, 951, 381, 220,
            ],
          },
          {
            // 平均数据
            name: "average",
            type: "line",
            stack: "total",
            symbolSize: 10,
            symbol: "circle",
            itemStyle: {
              normal: {
                color: "rgba(252,230,48,1)",
                barBorderRadius: 0,
                label: {
                  show: true,
                  position: "top",
                  formatter(p) {
                    return p.value > 0 ? p.value : "";
                  },
                },
              },
            },
            data: [
              1036, 3693, 2962, 3810, 2519, 1915, 1748, 4675, 6209, 4323, 2865,
              4298,
            ],
          },
        ],
      });
    },
  },
};
</script>
在 components文件夹里新建minxins文件夹——>minxins文件夹里新建resize.js文件,代码如下:
import { debounce } from '@/utils/index.js'

export default {
  data() {
    return {
      $_sidebarElm: null,
      $_resizeHandler: null
    }
  },
  mounted() {
    this.initListener()
  },
  activated() {
    if (!this.$_resizeHandler) {
      // avoid duplication init
      this.initListener()
    }

    // when keep-alive chart activated, auto resize
    this.resize()
  },
  beforeDestroy() {
    this.destroyListener()
  },
  deactivated() {
    this.destroyListener()
  },
  methods: {
    // use $_ for mixins properties
    // https://vuejs.org/v2/style-guide/index.html#Private-property-names-essential
    $_sidebarResizeHandler(e) {
      if (e.propertyName === 'width') {
        this.$_resizeHandler()
      }
    },
    initListener() {
      this.$_resizeHandler = debounce(() => {
        this.resize()
      }, 100)
      window.addEventListener('resize', this.$_resizeHandler)

      this.$_sidebarElm = document.getElementsByClassName('sidebar-container')[0]
      this.$_sidebarElm && this.$_sidebarElm.addEventListener('transitionend', this.$_sidebarResizeHandler)
    },
    destroyListener() {
      window.removeEventListener('resize', this.$_resizeHandler)
      this.$_resizeHandler = null

      this.$_sidebarElm && this.$_sidebarElm.removeEventListener('transitionend', this.$_sidebarResizeHandler)
    },
    resize() {
      const { chart } = this
      chart && chart.resize()
    }
  }
}
与components同级新建utils文件夹——>utils文件夹里新建index.js文件,代码如下:
/**
 * @param {Function} func
 * @param {number} wait
 * @param {boolean} immediate
 * @return {*}
 */
export function debounce(func, wait, immediate) {
  let timeout, args, context, timestamp, result

  const later = function () {
    // 据上一次触发时间间隔
    const last = +new Date() - timestamp

    // 上次被包装函数被调用时间间隔 last 小于设定时间间隔 wait
    if (last < wait && last > 0) {
      timeout = setTimeout(later, wait - last)
    } else {
      timeout = null
      // 如果设定为immediate===true,因为开始边界已经调用过了此处无需调用
      if (!immediate) {
        result = func.apply(context, args)
        if (!timeout) context = args = null
      }
    }
  }

  return function (...args) {
    context = this
    timestamp = +new Date()
    const callNow = immediate && !timeout
    // 如果延时不存在,重新设定延时
    if (!timeout) timeout = setTimeout(later, wait)
    if (callNow) {
      result = func.apply(context, args)
      context = args = null
    }

    return result
  }
}
下载echarts包:终端运行
npm install echarts遇到的错误:“export ‘default‘ (imported as ‘echarts‘) was not found in ‘echarts‘...
运行项目:终端运行
npm run dev源代码:https://gitee.com/liuhuiying/echarts.git
(把里面的node_modules文件夹删除,终端重新下载包 npm install才可运行)
具体样式和数据可根据实际情况更改
注:
1、本案例可直接使用,本人是在HelloWorld.vue中写的应用代码,新加页面运行记得配置路由,其他文件位置放在与之相对应的位置
2、HelloWorld.vue文件里面的数据、样式可根据自己的要求改动,其余文件里的内容无需改动


 2万+
2万+


 被折叠的 条评论
为什么被折叠?
被折叠的 条评论
为什么被折叠?
 到【灌水乐园】发言


