


提示:文章写完后,目录可以自动生成,如何生成可参考右边的帮助文档
文章目录
- 一、Fuzzy logic for plant-wide control of biological wastewater treatment process including greenhouse gas emissions -- 模糊逻辑用于全厂生物废水处理过程控制,包括温室气体排放
- 二、内容
- Acknowledgment --
- 总结
提示:以下是本篇文章正文内容
一、Fuzzy logic for plant-wide control of biological wastewater treatment process including greenhouse gas emissions – 模糊逻辑用于全厂生物废水处理过程控制,包括温室气体排放
二、内容
Abstract – 摘要
The application of control strategies is increasingly used in wastewater treatment plants with the aim of improving effluent quality and reducing operating costs. Due to concerns about the progressive growth of greenhouse gas emissions (GHG), these are also currently being evaluated in wastewater treatment plants. The present article proposes a fuzzy controller for plant-wide control of the biological wastewater treatment process. Its design is based on 14 inputs and 6 outputs in order to reduce GHG emissions, nutrient concentration in the effluent and operational costs. The article explains and shows the effect of each one of the inputs and outputs of the fuzzy controller, as well as the relationship between them. Benchmark Simulation Model no 2 Gas is used for testing the proposed control strategy. The results of simulation results show that the fuzzy controller is able to reduce GHG emissions while improving, at the same time, the common criteria of effluent quality and operational costs. – 废水处理厂越来越多地采用控制策略,以提高出水质量和降低运营成本。由于人们对温室气体排放(GHG)逐渐增加的担忧,目前也在对污水处理厂的温室气体排放进行评估。本文提出了一种用于全厂生物废水处理过程控制的模糊控制器。其设计基于 14 个输入和 6 个输出,目的是减少温室气体排放、污水中的营养浓度和运营成本。文章解释并展示了模糊控制器每个输入和输出的效果以及它们之间的关系。2 号气体基准模拟模型(BSM2)用于测试所提出的控制策略。模拟结果表明,模糊控制器能够减少温室气体排放,同时改善出水质量和运营成本这两项通用标准。
1.Introduction – 介绍
The application of control strategies is increasingly used in wastewater treatment plants with the aim of improving effluent quality and reducing operating costs. Due to concerns about the progressive growth of greenhouse gas emissions (GHG), these are also currently being evaluated in wastewater treatment plants. The present article proposes a fuzzy controller for plant-wide control of the biological wastewater treatment process. Its design is based on 14 inputs and 6 outputs in order to reduce GHG emissions, nutrient concentration in the effluent and operational costs. The article explains and shows the effect of each one of the inputs and outputs of the fuzzy controller, as well as the relationship between them. Benchmark Simulation Model no 2 Gas is used for testing the proposed control strategy. The results of simulation results show that the fuzzy controller is able to reduce GHG emissions while improving, at the same time, the common criteria of effluent quality and operational costs. – 废水处理厂越来越多地采用控制策略,以提高出水质量和降低运营成本。由于人们对温室气体排放(GHG)逐渐增加的担忧,目前也在对污水处理厂的温室气体排放进行评估。本文提出了一种用于全厂生物废水处理过程控制的模糊控制器。其设计基于 14 个输入和 6 个输出,目的是减少温室气体排放、污水中的营养浓度和运营成本。文章解释并展示了模糊控制器每个输入和输出的效果以及它们之间的关系。2 号气体基准模拟模型(BSM2)用于测试所提出的控制策略。模拟结果表明,模糊控制器能够减少温室气体排放,同时改善出水质量和运营成本这两项通用标准。
Among the GHG emitted in the wastewater treatment process, the present paper focus on the nitrous oxide (N 2O ) emissions during the nitrification process, on the carbon dioxide (CO2 ) emissions due to endogenous respiration of biomass, on CO 2 generated from external carbon source production and on CO 2 due to electric consumption. There are previous works in the literature as Kimochi et al. [3], Kampschreur et al. [4], Foley et al. [5], Law et al. [6], Flores-Alsina et al. [7,8], Aboobakar et al. [9] or Wang et al. [10], which show that N2O is an intermediate in the nitrification of WWTPs and that it has a high impact in the GHG emissions. Incomplete nitrification or denitrification can lead to an accumulation of nitrite concentration (SNO 2 ) that triggers the production of N2O emissions. The endogenous respiration of the biomass is a process of autoxidation that takes place after the depletion of food reserves. In this process, the microorganisms metabolize their own cellular material until its own destruction generating CO 2 emissions, as explained in Monteith et al. [11]. In the case of the electric consumption, it is related to the fact that the electricity is mostly generated by burning fossil fuels, which generates CO 2 emissions. – 在废水处理过程中排放的温室气体中,本文主要关注硝化过程中的一氧化二氮 (N 2O) 排放、生物质内源呼吸产生的二氧化碳 (CO2) 排放、外部碳源生产产生的 CO 2 以及电力消耗产生的 CO 2。Kimochi 等人[3]、Kampschreur 等人[4]、Foley 等人[5]、Law 等人[6]、Flores-Alsina 等人[7,8]、Aboobakar 等人[9]或 Wang 等人[10]等文献中的研究表明,N2O 是污水处理厂硝化过程中的中间产物,对温室气体排放有很大影响。不完全硝化或反硝化会导致亚硝酸盐浓度(SNO 2 )的积累,从而引发 N2O 排放。生物质的内源呼吸是食物储备耗尽后发生的自氧化过程。在这一过程中,微生物代谢自身的细胞物质,直至将其破坏,产生 CO 2 排放,Monteith 等人[11]对此进行了解释。就电力消耗而言,这与电力主要通过燃烧化石燃料产生这一事实有关,燃烧化石燃料会产生二氧化碳排放。In this article, the control strategies applied to cope with effluent quality, costs and GHG emissions have been tested using the Benchmark Simulation Model no 2 Gas (BSM2G), which was introduced by Flores-Alsina et al. [7]. This benchmark has been modified over the last years by the same authors, who added ammonia oxidizing bacteria (AOB) denitrification pathway for N2O emissions based on Guo and Vanrolleghem [12]. In addition, BSM2G is the result of the evolution of previous benchmarks. First, the Benchmark Simulation Model no 1 (BSM1) was developed in Copp [13], which includes the biological treatment and a secondary clarifier, using one-week period to evaluate results. Next, the Benchmark Simulation Model no 2 (BSM2) (Gernaey et al. [14]) included the whole cycle of a WWTP, adding the sludge treatment and a primary clarifier, applying a more complete influent with a one-year period for evaluation. – 本文使用 Flores-Alsina 等人[7]提出的基准模拟模型 No 2 Gas (BSM2G),测试了应对污水质量、成本和温室气体排放的控制策略。在过去几年中,同一作者对该基准进行了修改,根据 Guo 和 Vanrolleghem [12],增加了氨氧化细菌(AOB)反硝化途径,以减少一氧化二氮的排放。此外,BSM2G 是以前基准演变的结果。首先,Copp[13]开发了基准模拟模型 1(BSM1),其中包括生物处理和二级澄清池,使用一周时间评估结果。接着,基准模拟模型 2(BSM2)(Gernaey 等人[14])包含了污水处理厂的整个周期,增加了污泥处理和一级澄清池,采用更完整的进水,评估周期为一年。BSM2G differs from BSM2 mainly in the inclusion of GHG emissions assessment. It should be noted that the use of models for the evaluation of GHG emissions is currently restricted to the research domain, due to the incomplete knowledge regarding the SNO 2 production pathways (Mannina et al. [15], Ni and Yuan [16]). Although the present work uses Proportional-Integral (PI) controllers, the main contribution is based on a fuzzy controller to cope with the mentioned problems in WWTPs. There are already many works in the literature that have applied fuzzy control strategies in WWTPs. For example, the fuzzy controller was applied for the basic control loop of the dissolved oxygen concentration (SO ) in the fifth reactor (SO,5 ) by using BSM1 in Belchior et al. [17] and Nasr et al. [18] or in a pilot plant in Traore et al. [19]. In the case of Santín et al. [20] and Meyer and Pöpel [21], the fuzzy controller is used for ammonium and ammonia nitrogen concentration (SNH ) in the fifth tank (SNH,5 ) cascade control by manipulating the SO,5 setpoint, also by using BSM1 as testing plant. The fuzzy inference system is employed in Pai et al. [22] to improve artificial neural network to predict the total suspended solids (TSS) and the chemical oxygen demand (COD) in the effluent from a hospital WWTP. – BSM2G 与 BSM2 的不同之处主要在于纳入了温室气体排放评估。应该指出的是,由于对二氧化氮生产途径的了解不全面,目前对温室气体排放评估模型的使用仅限于研究领域(Mannina 等人 [15],Ni 和 Yuan [16])。虽然目前的工作使用了比例-积分(PI)控制器,但主要贡献是基于模糊控制器来应对污水处理厂中的上述问题。已有许多文献将模糊控制策略应用于污水处理厂。例如,Belchior 等人[17]和 Nasr 等人[18]通过使用 BSM1 将模糊控制器应用于第五反应器(SO,5)中溶解氧浓度(SO )的基本控制回路,Traore 等人[19]则将模糊控制器应用于试点工厂。在 Santín 等人[20]以及 Meyer 和 Pöpel [21]的案例中,模糊控制器通过操纵 SO,5 设定点,用于第五水箱(SNH,5)中氨氮和氨氮浓度(SNH)的级联控制,同样使用 BSM1 作为试验装置。Pai 等人[22]采用模糊推理系统改进人工神经网络,以预测医院污水处理厂出水中的总悬浮固体(TSS)和化学需氧量(COD)。 By using BSM2 as a working scenario, Santín et al. [23] Santín et al. [24] apply fuzzy control to deal with pollutants limits violations. Fuzzy logic has also been applied for evaluation (Kalavrouziotis et al. [25]) or management (Hirsch et al. [26]) of real WWTPs. However, none of the referred papers have taken into account GHG emissions. Although there is a large number of works that apply control strategies in WWTPs, the evaluation of GHG emissions has emerged in recent years. Some works that analyze GHG emissions in WWTPs by applying control strategies are Flores-Alsina et al. [7,8] and Barbu et al. [27]. They use BSM2G, but with different model versions. Flores-Alsina et al. [7] tests the effect of traditional control strategies in GHG emissions, but without considering those produced by nitrification. Flores-Alsina et al. [8] shows the effect on GHG emissions of the different areas of a WWTP. Barbu et al. [27] presents the effects of other traditional control strategies on water quality, operational costs and, especially, on GHG emissions, by an integral indicator for performance evaluation. – Santín 等人[23] Santín 等人[24] 以 BSM2 为工作场景,应用模糊控制来处理违反污染物限值的问题。模糊逻辑也被应用于实际污水处理厂的评估(Kalavrouziotis 等人[25])或管理(Hirsch 等人[26])。不过,这些论文都没有考虑到温室气体排放。尽管有大量工作将控制策略应用于污水处理厂,但温室气体排放的评估近几年才兴起。Flores-Alsina 等人[7,8] 和 Barbu 等人[27] 通过应用控制策略分析了污水处理厂的温室气体排放。他们使用 BSM2G,但模型版本不同。Flores-Alsina 等人[7]测试了传统控制策略对温室气体排放的影响,但没有考虑硝化产生的温室气体。Flores-Alsina 等人[8] 显示了污水处理厂不同区域对温室气体排放的影响。Barbu 等人[27]介绍了其他传统控制策略对水质、运营成本,尤其是对温室气体排放的影响,采用的是绩效评估综合指标。However, it was not the goal of these works to implement specific control strategies in order to reduce N2O emission in the nitrification process. On the other hand, Santín et al. [28] reduce N2O emissions combining cascade SNO 2 control and cascade SNH,5 control. Boiocchi et al. [29] reduce N2O emissions with a fuzzy controller that manipulates the oxygen transfer coefficient (KL a) of the aerobic reactors based on SNH and the nitrate concentration (SNO3 ) in the input and in the output of the nitrification process. In addition, Boiocchi et al. [29] take into account the effect that the oxygen aeration can produce on effluent costs and quality. Santín et al. [28] combine two control strategies with PI controllers to also reduce costs and improve the effluent quality, but without attempting to eliminate nutrient violations. Both articles only manipulateKL a of the aerobic reactors and only reduce SNO 2 as GHG emissions. The present article reduces the SNO 2 emissions using a different control strategy than the two referred articles, by means of only SNH sensors, which are commonly used in real plants. – 不过,这些研究的目标并不是实施特定的控制策略,以减少硝化过程中的 N2O 排放。另一方面,Santín 等人[28] 结合级联 SNO 2 控制和级联 SNH,5 控制减少了 N2O 排放。Boiocchi 等人[29] 利用模糊控制器减少了 N2O 排放,该控制器根据 SNH 和硝化过程输入和输出中的硝酸盐浓度(SNO3)来控制好氧反应器的氧传递系数(KL a)。此外,Boiocchi 等人[29] 还考虑了氧气曝气对污水成本和质量的影响。Santín 等人[28] 将两种控制策略与 PI 控制器相结合,同样可以降低成本并改善出水水质,但并不试图消除营养物违规现象。这两篇文章都只对好氧反应器的 KL a 进行了控制,只减少了作为温室气体排放的 SNO 2。本文采用与上述两篇文章不同的控制策略,仅通过 SNH 传感器来减少 SNO 2 的排放,而 SNH 传感器通常用于实际工厂。 The proposed controller not only manipulates SO in the third reactor (SO,3 ), SO in the fourth reactor (SO,4 ) and the SO,5 set-points, but also the internal recirculation flow rate (Qa ), the external carbon flow rate (qEC ) in the first reactor (qEC,1 ) and the flow rate from the storage tank (Qst ). This fact also allows the proposed paper to differentiate itself from the mentioned referenced articles, by reducing the CO2 emissions due to the endogenous respiration of biomass, CO 2 generated from the external carbon source production and CO 2 due to the electric consumption, and by removing the limit violations of the nutrients. The proposed control strategies also differ from the literature, achieving these objectives (together with the reduction of costs) by the implementation of a single fuzzy controller, which to the best of the authors knowledge has not been previously proposed. Also, it has to be emphasized the addition of the derivatives of some variables with respect to time as fuzzy controller inputs, in order to act in advance. – 本文所提出的控制器不仅可以控制第三个反应器中的 SO(SO,3)、第四个反应器中的 SO(SO,4)和 SO,5 的设定值,还可以控制内部循环流量(Qa)、第一个反应器中的外部碳流量(qEC)(qEC,1)和来自储罐的流量(Qst)。通过减少生物质内源呼吸产生的 CO2 排放量、外部碳源生产产生的 CO2 排放量和电力消耗产生的 CO2 排放量,并消除违反营养物质限值的情况,这也使本文有别于上述参考文献。所提出的控制策略也与文献不同,它通过实施单一的模糊控制器来实现这些目标(同时降低成本),而据作者所知,以前还没有人提出过这样的控制策略。此外,必须强调的是,为了提前采取行动,增加了一些变量相对于时间的导数作为模糊控制器的输入。In addition, the temperature is also considered as a fuzzy controller input, since higher temperature means higher GHG emissions (Boiocchi et al. [29]) and lower temperature means more total nitrogen concentration (SN tot ) and SNH are generated. The article explains the contribution of each manipulated variable in the proposed objectives, as well as the effects of each of the fuzzy controller input. It should be noted that the proposed fuzzy control looks for a trade-off between the aforementioned objectives, achieving satisfactory results and without meaningfully worsening any of them. The paper is organized as follows. First, BSM2G working scenario is presented. Next, the default and the proposed control strategies are explained. Afterwards, simulations results are shown, together with the discussion about them. Finally, the most important conclusions are drawn. – 此外,温度也被视为模糊控制器的输入变量,因为温度越高,温室气体排放量越高(Boiocchi 等人[29]),温度越低,产生的总氮浓度(SN tot )和 SNH 越多。文章解释了拟议目标中每个受控变量的贡献,以及每个模糊控制器输入的影响。值得注意的是,所提出的模糊控制方案在上述目标之间进行了权衡,既取得了令人满意的结果,又没有使其中任何一个目标明显恶化。本文的组织结构如下。首先,介绍 BSM2G 的工作场景。接着,解释了默认控制策略和建议的控制策略。然后,展示模拟结果并进行讨论。最后,得出最重要的结论。
2. Materials and methods – 材料和方法
A benchmark is used for the evaluation of the proposed control strategy, as it is a common practice in wastewater treatment research. This is BSM2G, which is an extension of BSM2 (Gernaey etal. [14]) that includes GHG emissions. The model was presented in Flores-Alsina et al. [7] and an updated version provided by the same authors has been used for the present article. Within these modifications, it is included the incorporation of the AOB denitrification pathway for N2O emissions based on Guo and Vanrolleghem [12]. Therefore, the present BSM2G includes two pathways for N2O emissions (heterotrophic denitrification and AOB denitrification).
2.1. Layout
The BSM2G layout (Fig. 1) is designed for an influent with an average flow rate of 20,648.36 m 3 /d and an average biodegradable COD of 592.53 mg/l. In the same way as in the case of BSM2, BSM2G is made up of a primary clarifier, a secondary treatment and a sludge treatment. The secondary treatment includes the biological reactors and a secondary settler. For the biological treatment, BSM2G includes, as in BSM1 (Copp [13]) and BSM2, five biological reactors, two of which are anoxic and three are aerobic. The biological reactions inside the reactors are modeled by the Activated Sludge Model no 1 (ASM1) (Henze et al. [30]). In BSM2G, ASM1 is extended on the basis of Hiatt and Grady [31] and Mampaey et al. [32] in order to include, besides SNO3 , the other compounds that are present in the nitrification and denitrification processes: SNO2 , nitric oxide (SNO ), N2O and dinitrogen (N2 ). There is an internal recirculation from the last aerobic reactor to feed the first anoxic reactor with SNO 3 . The secondary clarifier is modeled as a 10 layers non-reactive unit. At lower levels the sludge is deposited by gravity. Some of this sludge is recirculated to the first anoxic reactor (external recirculation) and the other part is led to be treated. The hydraulic retention time of the primary clarifier and the secondary treatment is 22 h. – BSM2G 的布局(图 1)是针对平均流量为 20 648.36 立方米/日、平均可生物降解 COD 为 592.53 毫克/升的进水设计的。与 BSM2 相同,BSM2G 也由一级澄清池、二级处理池和污泥处理池组成。二级处理包括生物反应器和二级沉淀器。在生物处理方面,与 BSM1(Copp [13])和 BSM2 一样,BSM2G 包括五个生物反应器,其中两个为缺氧反应器,三个为好氧反应器。反应器内的生物反应由活性污泥模型 1 号(ASM1)(Henze 等人[30])模拟。在 BSM2G 中,ASM1 以 Hiatt 和 Grady [31] 以及 Mampaey 等人[32]的研究为基础进行了扩展,以便将硝化和反硝化过程中存在的 SNO3 和其他化合物包括在内: SNO2 、一氧化氮 (SNO)、一氧化二氮 (N2O) 和氮气 (N2)。最后一个好氧反应器的内部循环为第一个缺氧反应器提供 SNO 3。二级澄清池被模拟为一个 10 层的非反应单元。在较低层,污泥在重力作用下沉淀。其中一部分污泥会再循环到第一缺氧反应器(外部再循环),另一部分污泥则会被引出进行处理。一级澄清池和二级处理池的水力停留时间为 22 小时。 It is based on the average dry weather flow rate and the volume of the primary clarifier (900 m 3 ), the biological reactors (12,000 m 3 ) and the secondary settler (6000 m 3 ). The volume of each of the two anoxic tanks is 1500 m 3 and the volume of each of the three aerobic tanks is 3000 m3 . – 它是根据平均旱季流量以及初级澄清池(900 立方米)、生物反应器(12000 立方米)和二级沉淀池(6000 立方米)的容积计算得出的。两个缺氧池的容积各为 1500 立方米,三个好氧池的容积各为 3000 立方米。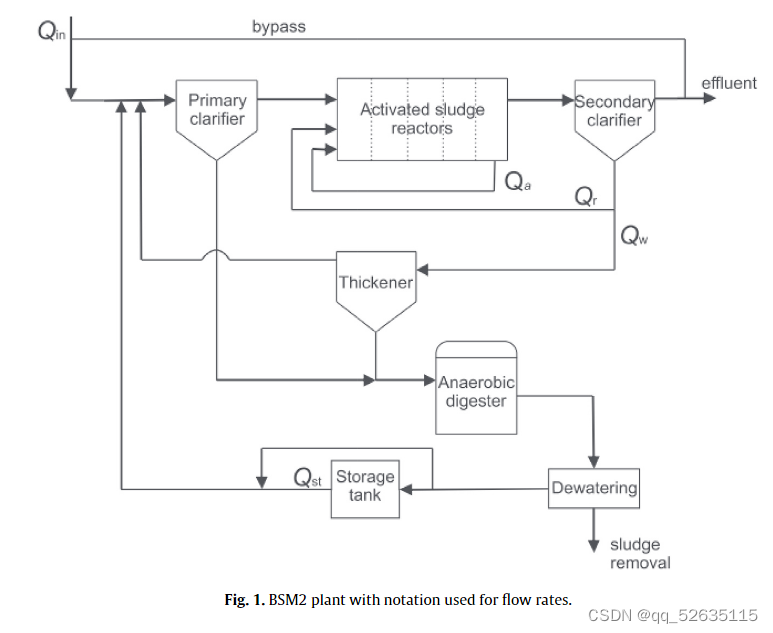](https://i-blog.csdnimg.cn/blog_migrate/8d3e6215da85b2313e57aa9e0fa8595e.png)
For the sludge treatment, BSM2G makes use of a thickener, an anaerobic digester and a dewatering unit. The water extracted from the sludge by the dewatering process is recirculated to the primary clarifier through the storage tank to regulate its flow rate. The influent data in BSM2G includes rainfall and storm events, as well as variations in temperature. It is defined for 609 days, but only the results of the period from day 245 to day 609 are considered for evaluation. With the aim to stabilize the plant, a constant influent is applied to the plant for 200 days, before any simulation. – 在污泥处理方面,BSM2G 利用浓缩池、厌氧消化池和脱水装置。脱水过程中从污泥中提取的水通过储水池再循环到初沉池,以调节其流速。BSM2G 中的进水数据包括降雨和暴雨事件以及温度变化。该数据定义为 609 天,但只考虑从第 245 天到第 609 天的评估结果。为了稳定污水处理厂,在进行任何模拟之前,先对污水处理厂进行 200 天的恒定进水。
2.2 Evaluation criteria – 评估标准
The performance of the control strategies is evaluated by considering the effluent quality, the operational costs and the GHG emissions. The evaluation criteria for the effluent quality are the percentage of time for which the values of the effluent pollutants are over the established limits and the Effluent Quality Index (EQI). Table 1 shows the limits established for the effluent concentrations of SNtot , totalCOD (CODt ), SNH , TSS and 5-day Biological Oxygen Demand (BOD5 ) In BSM2G, SN tot is the sum of SNO 3 , SNO 2 , SNO , SN 2O and Kjeldahl nitrogen (SNKj), which includes the organic nitrogen and SNH . Within these concentrations, this article only evaluates the violations of SN tot in the effluent (SNtot,e ) and SNH in the effluent (SNH,e ). This is due to the fact that the rest of the concentrations are commonly kept under the established limits and they only exceed the limits in exceptional days when the high increase of the influent flow makes the wastewater be bypassed to the effluent without being treated. EQI is expressed in Kg of pollutants per day and is calculated weighting the effluent concentration of the different pollutants, according to the following expression: – 评估控制策略的性能时,要考虑污水质量、运行成本和温室气体排放量。出水水质的评估标准是出水污染物值超过规定限值的时间百分比和出水水质指数(EQI)。表 1 列出了 SNtot、总 COD (CODt)、SNH、TSS 和 5 天生物需氧量 (BOD5) 的出水浓度限值。在 BSM2G 中,SN tot 是 SNO 3、SNO 2、SNO、SN 2O 和凯氏氮 (SNKj) 的总和,其中包括有机氮和 SNH。在这些浓度范围内,本文仅评估污水中 SN tot(SNtot,e)和 SNH(SNH,e)的违规情况。这是因为其余浓度通常都保持在规定限值以下,只有在特殊情况下,进水流量大幅增加导致废水未经处理而旁流至出水口时,这些浓度才会超过限值。EQI 以每天千克污染物为单位,根据以下表达式计算出不同污染物的出水浓度加权值:


where T is the evaluation period and Q is the flow rate. The operational costs are evaluated by the Operational Cost Index (OCI). It is calculated weighting the different costs of a WWTP as follows: – 其中,T 为评估期,Q 为流量。运营成本通过运营成本指数(OCI)进行评估。其计算公式如下,对污水处理厂的不同成本进行加权:

where AE is the aeration energy (kWh/d), PE is the pumping energy (kWh/d), SP is the sludge production (kg/d), EC refers to the carbon that could be added to improve denitrification (kg/d), ME is the mixing energy (kWh/d), METprod is the produced methane (kWh/d) and HE is the heating energy (kWh/d). The GHG emissions are a new evaluation criterion of BSM2G with respect to BSM2. They are calculated according to the principles proposed by Hiatt and Grady [31] and Mampaey et al. [32]. The following sources of GHG emissions are taken into account: the biological treatment, the sludge treatment, the difference between electric consumption and electric generation, the EC production and the sludge to be disposed. Within these sources, with the control strategy proposed in this article, those produced in the biological treatment, due to electricity and due to EC production are attempted to be reduced and then evaluated. – 其中,AE 是曝气能(千瓦时/天),PE 是抽气能(千瓦时/天),SP 是污泥产量(千克/天),EC 是为提高反硝化效果而添加的碳量(千克/天),ME 是混合能(千瓦时/天),METprod 是甲烷产量(千瓦时/天),HE 是加热能(千瓦时/天)。相对于 BSM2,温室气体排放量是 BSM2G 新的评估标准。温室气体排放量根据 Hiatt 和 Grady [31] 以及 Mampaey 等人 [32] 提出的原则计算。温室气体排放源包括:生物处理、污泥处理、用电量与发电量之间的差额、EC 产量和待处理污泥。在这些排放源中,本文提出的控制策略试图减少生物处理、电力和导电率生产过程中产生的温室气体排放,然后对其进行评估。
3. Control approach – 控制方法
The control approach proposed in this article is mainly based on a single fuzzy controller that manipulates the variables of the water line in a WWTP. However, although the work is focused on this fuzzy controller, three PI controllers are also applied in order to controlSO,3 , SO,4 and SO,5 by manipulating KLa in the third tank (KLa3 ), in the fourth tank (KLa4 ) and in the fifth tank (KLa5 ). Each one of them controls the SO of one reactor by manipulating the KLa of the same reactor. Due to the large number of inputs and outputs of the proposed fuzzy controller, it has been elaborated incrementally in order to observe the effect produced by the different manipulated and measured variables. The fuzzy controller finally designed is called fuzzy_plantwide and the intermediate fuzzy controllers are numbered from 1 to 4 (fuzzy_1, fuzzy_2, fuzzy_3 and fuzzy_4). In order to compare the performance of the new proposals, the default control strategy (DCS) used in BSM2G is considered the starting point. The second part includes the explanations of the PI controllers used at the basic level and the fuzzy controller. Fig. 2 shows the configuration of DCS and the proposed control strategy. For all the control strategies, ideal sensors have been considered, as it is a common practice in the research made on benchmark simulation models. – 本文提出的控制方法主要基于单个模糊控制器,该控制器可操控污水处理厂水管的变量。不过,虽然工作重点是该模糊控制器,但也应用了三个 PI 控制器,以通过操纵第三个水箱(KLa3)、第四个水箱(KLa4)和第五个水箱(KLa5)中的 KLa 来控制 SO,3、SO,4 和 SO,5。每个反应器都通过操纵同一反应器的 KLa 来控制一个反应器的 SO。由于拟议的模糊控制器有大量的输入和输出,因此需要对其进行渐进式设计,以观察不同的操纵和测量变量所产生的效果。最终设计出的模糊控制器称为 fuzzy_plantwide,中间的模糊控制器编号为 1 至 4(fuzzy_1、fuzzy_2、fuzzy_3 和 fuzzy_4)。为了比较新方案的性能,BSM2G 采用的默认控制策略(DCS)被视为起点。第二部分包括对基本级使用的 PI 控制器和模糊控制器的解释。图 2 显示了 DCS 的配置和建议的控制策略。所有控制策略都考虑了理想传感器,因为这是基准模拟模型研究中的常见做法。

3.1. Default control strategy (DCS) – 默认控制器策略
As it is shown in Fig. 2a, the DCS closed-loop control configuration consists of a PI controller that controls SO,4 at a set-point of 2 mg/l by manipulating KLa3 , KLa4 and KL a5 with KLa5 set to the half value ofKL a3 and KLa4 . KLa values are constrained from 0 to 360 d−1 . For other possible manipulated variables, a fixed value is applied.qEC,1 is added at a constant flow rate of 2 m 3 /d. For the rest of the reactors there is no external carbon addition. Two different wastage flow rate (Q w) values are imposed depending on the time of the year: from 0 to 180 days and from 364 to 454 days Q w is set to 300 m 3 /d; and for the remaining time periods Q w is set to 450 m 3 /d. Qa is fixed at 61,944 m 3 /d. The tuning parameters of the PI controller implemented in DCS are k p = 25 and T i = 0.002. The tuning employed here is taken from Nopens et al. [33] in order to consider the same basic control loops configuration as in the BSM2 default control strategy. – 如图 2a 所示,DCS 的闭环控制配置包括一个 PI 控制器,该控制器通过调节 KLa3、KLa4 和 KL a5 将 SO,4 控制在 2 mg/l 的设定值,其中 KLa5 设定为 KL a3 和 KLa4 的一半。KLa 值限制在 0 至 360 d-1 之间。qEC,1以 2 m 3 /d 的恒定流速加入。其余的反应器没有外部碳添加。根据一年中的不同时间,设定了两个不同的废料流量(Q w)值:0 至 180 天和 364 至 454 天,Q w 设定为 300 m 3 /d;其余时间段,Q w 设定为 450 m 3 /d。Qa 固定为 61 944 m 3 /d。在 DCS 中实施的 PI 控制器的调整参数为 k p = 25 和 T i = 0.002。此处采用的调节参数取自 Nopens 等人的研究[33],以考虑与 BSM2 默认控制策略相同的基本控制回路配置。
3.2. Proposed control strategy – 本文提出的控制策略
The proposed control strategy in this paper is mainly focused on the implementation of fuzzy logic. The own authors’ experience in WWTP control engineering and the opinions received from operators in real plants make the authors conclude that the experience and knowledge of the plant behavior is of great importance in the control strategies application in WWTPs. For this reason, the main control proposed is based on a single fuzzy controller designed to manipulate six variables of the water line based on different measured variables, as well as their time derivatives in some cases, to know their trend over time. The fuzzy controller does not try to keep the measured variables at a given set-point, as in Santín et al. [20]. The configuration of the full proposed control strategy is shown in Fig. 2b. Within the manipulated variables of the fuzzy controller, Qa , qEC,1 and Qst are directly related to the actuator. However, SO in the aerobic reactors are controlled by PI controllers, whose set-points are manipulated by the fuzzy controller. These PI controllers are explained in the next section. – 本文提出的控制策略主要侧重于模糊逻辑的实施。根据作者自身在污水处理厂控制工程方面的经验以及从实际工厂操作人员那里获得的意见,作者得出结论,在污水处理厂应用控制策略时,对工厂行为的经验和知识非常重要。因此,提出的主要控制策略是基于一个单一的模糊控制器,旨在根据不同的测量变量以及某些情况下的时间导数来控制水管的六个变量,以了解它们随时间变化的趋势。与 Santín 等人的研究[20]一样,模糊控制器并不试图将测量变量保持在给定的设定点上。图 2b 显示了完整的拟议控制策略配置。在模糊控制器的控制变量中,Qa、qEC,1 和 Qst 与执行器直接相关。然而,好氧反应器中的 SO 由 PI 控制器控制,其设定点由模糊控制器控制。下一节将解释这些 PI 控制器。
3.2.1. PI controllers for SO control in the aerobic reactors – 用于好氧反应器 SO 控制的 PI 控制器
PI controllers aim to maintain a variable at a given set-point (unlike the proposed fuzzy controller) and they are mostly used in real plants. SO in the reactors are some of the few variables that can be maintained at a set-point in a WWTP, without a large error. Therefore, PI controllers are proposed for this objective. For the fuzzy logic, it is easier and more coherent to find the relationship of SNH and SNO 3 with SO in the aerobic reactors, than directly with KL a of the aerobic reactors. The tuning of these PI controllers as well as the controlled and manipulated variables of each one are the same with those the default PI controller (k p = 25 and T i = 0.002). This is because their tracking is satisfactory enough and the implementation objectives of this article are focused on the fuzzy controller. KLa values are also constrained from 0 to 360 d−1 as in DCS. – PI 控制器的目的是将变量保持在给定的设定点上(与拟议的模糊控制器不同),它们大多用于实际工厂。在污水处理厂中,反应器中的 SO 是少数几个可以保持在设定点而不会产生较大误差的变量。因此,建议使用 PI 控制器来实现这一目标。对于模糊逻辑来说,找到 SNH 和 SNO 3 与好氧反应器中 SO 的关系比直接找到好氧反应器的 KL a 更容易,也更一致。这些 PI 控制器的调整以及每个控制器的控制变量和操纵变量与默认的 PI 控制器(k p = 25 和 T i = 0.002)相同。这是因为它们的跟踪效果足够令人满意,而本文的实施目标主要集中在模糊控制器上。与 DCS 一样,KLa 值也限制在 0 至 360 d-1 之间。
3.2.2. Fuzzy logic – 模糊逻辑
Fuzzy logic can be defined as a control based on human expertise, determined by words instead of numbers and sentences instead of equations. However, process variables are measured in numbers instead of words. For this reason, the fuzzy controller adapts the input variables into suitable linguistic values by membership functions (mf). For further information about the fuzzy control, the reader is referred to standard references such as Klir and Yuan [34]. The proposed fuzzy controller has been initially tuned based on the knowledge of the biological processes described by the extended ASM1 and on a specific analysis of the evolution over time of the fuzzy controller inputs. --模糊逻辑可定义为基于人类专业知识的控制,由文字而非数字和句子而非方程式决定。然而,过程变量是用数字而不是文字来衡量的。因此,模糊控制器通过成员函数(mf)将输入变量调整为合适的语言值。有关模糊控制的更多信息,读者可参考 Klir 和 Yuan [34] 等标准参考文献。根据对扩展 ASM1 所描述的生物过程的了解,以及对模糊控制器输入随时间演变的具体分析,对拟议的模糊控制器进行了初步调整。After that, the membership functions values range have been adjusted by trial and error in order to optimize the results. The proposed fuzzy controller has been designed and tested progressively. It has been always implemented with a sampling time of 15 min. The complete fuzzy controller is called fuzzy_plantwide, which consists of 14 inputs, 6 outputs, and 80 fuzzy rules. For the controller inputs, 8 sensors are required. As shown in Figs. 2b and 3, the fuzzy_plantwide inputs are SNH at the input of the biological reactors (SNH,0 ), at the output of the second reactor (SNH,2 ), of the third reactor (SNH,3 ), of the fourth reactor (SNH,4 ) and SNH,5 , the sum of SNO 3 at the output of the fifth reactor (SNO 3 5 ) and SNH,5 , the temperature (Tas ), the input flow rate (Qin ), the product of Qin and SNH at the input of the primary clarifier (SNH,in ), as well as the derivative with respect to time of SNH,2 (dSNH,2 /dt), SNH,3 (dSNH,3 /dt), SNH,4 (dSNH,4 /dt), the sum of SNH,5 and SNO3 5 (d(SNH,5+SNO 3 5 )/dt) and the product of Qin and SNH,in (d(Qin·SNH,in )/dt). The fuzzy_plantwide outputs are the SO,3 set-point, the SO,4 set-point, the SO,5 set-point, Qa ,qEC,1 and Qst . – 之后,通过试错调整成员函数值范围,以优化结果。所提出的模糊控制器是逐步设计和测试出来的。它的采样时间始终为 15 分钟。完整的模糊控制器名为 fuzzy_plantwide,由 14 个输入、6 个输出和 80 条模糊规则组成。控制器输入需要 8 个传感器。如图 2b 和图 3 所示 如图 2b 和图 3 所示,fuzzy_plantwide输入为生物反应器输入端 SNH(SNH,0 )、第二反应器输出端 SNH(SNH,2 )、第三反应器输出端 SNH(SNH,3 )、第四反应器输出端 SNH(SNH,4 )和 SNH(SNH,5)、第五反应器输出端 SNO 3 的总和(SNO3 5 )和 SNH(SNH,5)、温度(Tas )、 输入流量 (Qin)、初级澄清池输入端的 Qin 与 SNH 的乘积 (SNH,in ),以及 SNH 随时间的导数、 2 (dSNH,2 /dt)、SNH,3 (dSNH,3 /dt)、SNH,4 (dSNH,4 /dt)、SNH,5 与 SNO3 5 之和 (d(SNH,5+SNO 3 5 )/dt) 以及 Qin 与 SNH,in 的乘积 (d(Qin-SNH,in )/dt)。全厂模糊输出为 SO,3 设定点、SO,4 设定点、SO,5 设定点、Qa ,qEC,1 和 Qst。Mamdani (Mamdani [35]) is the method of inference. Fig. 4 shows the most relevant input-output relationships of the fuzzy controller through surface graphs, which allows the observation of the non-linearity of the fuzzy controller. The regulation of the fuzzy controller output variables is aimed to reduce GHG emissions, to reduce costs and to improve the effluent quality by reducing SNH,e and SNtot,e limit violations. However, the manipulation of each variable has different objectives and there is no variable that tries to fulfill all the objectives only by itself. The value of the output variables is obtained based on the input variables, by means of the so-called fuzzy rules. – Mamdani (Mamdani [35]) 是一种推理方法。图 4 通过曲面图显示了模糊控制器最相关的输入输出关系,可以观察到模糊控制器的非线性。对模糊控制器输出变量进行调节的目的是减少温室气体排放、降低成本,以及通过减少 SNH,e 和 SNtot,e 违反限值来改善污水质量。然而,对每个变量的控制都有不同的目标,没有一个变量仅靠自身就能实现所有目标。输出变量的值是根据输入变量通过所谓的模糊规则获得的。


The 80 fuzzy rules relate the manipulated variables to the values of the measured variables. These input-output relationships are based on the biological processes that take place during the wastewater treatment, as well as on the plant operation experience. The reasons for the choice of input-output relationships are explained in the following paragraphs, for each one of the fuzzy controllers. The fuzzy rules code is presented in appendix A and explained by a scheme in appendix B. The FIS1 Editor from Matlab, used for the implementation of the fuzzy controllers, has some constrains in applying different conditions. This fact requires the definition of a big number of fuzzy rules that could be significantly reduced with a more flexible tool. In order to know the effect produced in the plant by the different inputs and outputs, the controller has been tested and explained incrementally by different steps until the fuzzy_plantwide has been implemented. To this end, the fuzzy controllers have been numbered from 1 to 4, as inputs and/or outputs have been added. Fig. 3 show the inputs and outputs of each of these fuzzy controllers. – 80 条模糊规则将操作变量与测量变量的值联系起来。这些输入输出关系是根据废水处理过程中的生物过程以及工厂的运行经验确定的。下文将针对每种模糊控制器解释选择输入输出关系的原因。附录 A 介绍了模糊规则代码,附录 B 则对其进行了解释。用于执行模糊控制器的 Matlab FIS1 编辑器在应用不同条件时有一些限制。这就需要定义大量的模糊规则,而如果有一个更灵活的工具,就可以大大减少这种情况的发生。为了了解不同的输入和输出在工厂中产生的效果,我们通过不同的步骤对控制器进行了测试和解释,直到模糊全厂控制器得以实施。为此,随着输入和/或输出的增加,模糊控制器被编号为 1 至 4。图 3 显示了每个模糊控制器的输入和输出。 The code of fuzzy_plantwide is shown in Appendix A. The objectives sought in each of the fuzzy controllers, as well as the reasons for their application, are explained below.Fuzzy_1. The main objective of fuzzy_1 is to reduce N2O emissions, which are an important factor of GHG emissions. Higher N2O emissions are generated during nitrification. As shown in several articles such as Kimochi et al. [3], Kampschreur et al. [4], Foley et al. [5], Law et al. [6], Flores-Alsina et al. [7,8], Aboobakar et al. [9] or Wang et al. [10], N2O emissions during nitrification are the result of partial nitrification. It happens when the SNH oxidation is not completely converted to SNO 3 . Therefore, N2O emissions are related to SO in the aerobic reactors (Boiocchi et al. [29]). Therefore, the first application of the fuzzy controller is created with the intention to avoid partial nitrification. Fuzzy_1 manipulates the SO set-points of the aerobic reactors based on the SNH input of each reactor. SO set-points are constrained from 0 to 5 mg/l. The SO values are finally obtained by the PI controllers, whose set-points are given by the fuzzy controller. – Fuzzy_plantwide 的代码见附录 A。下文解释了每个模糊控制器所追求的目标及其应用的原因。Fuzzy_1 的主要目标是减少 N2O 排放,这是温室气体排放的一个重要因素。较高的 N2O 排放量是在硝化过程中产生的。正如 Kimochi 等人[3]、Kampschreur 等人[4]、Foley 等人[5]、Law 等人[6]、Flores-Alsina 等人[7,8]、Aboobakar 等人[9]或 Wang 等人[10]等多篇文章所述,硝化过程中的 N2O 排放是部分硝化的结果。它发生在 SNH 氧化未完全转化为 SNO3 时。因此,N2O 排放与好氧反应器中的 SO 有关(Boiocchi 等人 [29])。因此,模糊控制器的首次应用旨在避免部分硝化。Fuzzy_1 根据每个反应器的 SNH 输入来控制好氧反应器的 SO 设定点。SO 设定值限制在 0 至 5 mg/l。SO 值最终由 PI 控制器获得,其设定点由模糊控制器给出。Then, knowing the SNH input of a reactor and based on the experience of the plant, the required SO is added by the fuzzy controller for complete nitrification. In addition, not only the values of SNH , but also their slopes are taken into account by their derivatives with respect to time. This allows the controller to be able to act in advance. In the case of fuzzy_1, when SO is low andSNH begins to increase, the increase of SO has to be fast. Otherwise, a very large increase of N2O can be produced. For this reason, the derivative of SNH with respect to time (dSNH /dt) is taken into account, mainly when the values of SNH are low in order to detect their imminent increase (Fig. 4a, c and e). Finally, the resulting SO values are also influenced by temperature, because N2O emissions are much higher at high temperatures (Fig. 4b, d and f). – 然后,在了解反应器的 SNH 输入后,根据工厂的经验,模糊控制器会添加所需的 SO,以实现完全硝化。此外,不仅要考虑 SNH 值,还要通过其与时间的导数来考虑其斜率。这使得控制器能够提前采取行动。在 Fuzzy_1 的情况下,当 SO 值较低而 SNH 值开始增加时,SO 值的增加速度必须很快。否则,N2O 会大量增加。因此,SNH 相对于时间的导数(dSNH /dt)被考虑在内,主要是在 SNH 值较低时,以检测其是否即将增加(图 4a、c 和 e)。最后,得出的 SO 值还会受到温度的影响,因为 N2O 的排放量在高温下要高得多(图 4b、d 和 f)。It is important to note the difference between fuzzy_1 and the cascade SNH control widely used in the literature (Vrecko et al. [36], Stare et al. [37], Flores-Alsina et al. [7], Barbu et al. [27], etc.), because although this can achieve better effluent quality results, N2O emissions are not considered and partial nitrification can occur, as high GHG emission values are shown in Barbu et al. [27] by SNH,5 cascade control. Although the main objective of fuzzy_1 is the reduction of the N2O emissions, the levels of SNH and SNO 3 are also taken into consideration to some extent, since SO is regulated based on the SNH values. In fuzzy_1 the outputs SO,3 , SO,4 and SO,5 have five membership functions, since “very_high” is added in fuzzy_2. Regarding the inputs, SNH,2 has five mf, whereas SNH,3 and SNH,4 have six mf. This is due to the fact that SNH,2 is similar throughout the year, but SNH,3 and SNH,4 vary depending on the temperature because more SNH is oxidized at high temperatures than at low temperatures. In the case of the time derivatives, dSNH,2 /dt has three mf, dSNH,3 /dt has four mf and dSNH,4 /dt has one mf (which is “high”). Each one has been analyzed separately, but all dSNH /dt have the same objective, which is to give a “medium” value of SO when SNH is “low” and dSNH /dt is “high” or “very_high”. – 需要注意的是,模糊_1 与文献(Vrecko 等人[36]、Stare 等人[37]、Flores-Alsina 等人[7]、Barbu 等人[27]等)中广泛使用的级联 SNH 控制之间存在差异,因为虽然这种方法可以获得更好的出水水质结果,但未考虑 N2O 排放,可能会发生部分硝化,如 Barbu 等人[27]通过 SNH,5 级联控制所显示的高温室气体排放值。虽然 fuzzy_1 的主要目标是减少 N2O 排放量,但 SNH 和 SNO3 的水平也在一定程度上得到了考虑,因为 SO 是根据 SNH 值进行调节的。在模糊模型 1 中,输出 SO,3 、SO,4 和 SO,5 有五个成员函数,因为在模糊模型 2 中增加了 “非常高”。至于输入,SNH,2 有五个成员函数,而 SNH,3 和 SNH,4 有六个成员函数。这是因为 SNH,2 全年都是相似的,而 SNH,3 和 SNH,4 则随温度变化而变化,因为高温下氧化的 SNH 多于低温下氧化的 SNH。就时间导数而言,dSNH,2 /dt 有三个 mf,dSNH,3 /dt 有四个 mf,dSNH,4 /dt 有一个 mf(“高”)。我们对每一个参数都进行了单独分析,但所有 dSNH /dt 都具有相同的目标,即当 SNH 为 "低 "而 dSNH /dt 为 "高 "或 "非常高 "时,给出 SO 的 "中等 "值。 Finally, the SO values also depend on Tas , which consists of two mf (“medium-low” and “high”).Fuzzy_2. The next step of the fuzzy controller aims to improve the effluent quality in terms of reducing the percentage of time when SNH,e and SN tot,e are above of the established limits. For this purpose, the inputs SNH,5 and the sum of SNH,5 and SNO3 5 (giving a value close to that of SN tot ) are added.SNH,5 has three mf and SNH,5+SNO 3 5 has five mf. However, in both cases only one is used in fuzzy_2 (“high”). In addition, the mf “very_high” is added to all SO outputs. Then, for all the fuzzy rules of fuzzy_1, the constraint if S NH,5 is not “high” is added. When SNH,5 is “high”, all the SO outputs will be “very_high”, in order to oxidize more SNH and to avoid its increase. Also, if SNH,5 is not “high” andSNH,5+SNO 3 5 is “high”, the “low” value is given to all SO (Fig. 4g–i). In this way, less SNO 3 is generated and therefore SN tot and the aeration costs are reduced. – 最后,SO 值也取决于 Tas,它由两个 mf("中低 "和 “高”)组成。模糊控制器的下一步旨在改善出水水质,减少 SNH,e 和 SN tot,e 超过规定限值的时间百分比。为此,输入 SNH,5 以及 SNH,5 和 SNO3 5 的总和(与 SN tot 的值接近)。SNH,5 有 3 个 mf,SNH,5+SNO 3 5 有 5 个 mf。此外,“very_high” mf 被添加到所有 SO 输出中。然后,在 fuzzy_1 的所有模糊规则中,添加了 S NH,5 不为 "高 "的约束条件。当 SNH,5 为 "高 "时,所有 SO 输出将为 “非常高”,以氧化更多的 SNH,避免其增加。另外,如果 SNH,5 不是 "高 "值,而 SNH,5+SNO 3 5 是 "高 "值,则所有 SO 的输出都是 "低 "值(图 4g-i)。这样,产生的 SNO 3 就会减少,因此 SN tot 和曝气成本也会降低。
The input SNH,5+SNO 3 5 is not added as a constraint in the fuzzy rules of fuzzy_1, because that could imply an increase of N2O by reducing SO .Fuzzy_3. In the following fuzzy controller application, Qa is added as output, while Qin and SNH,0 are added as inputs. The manipulation of Qa aims to reduce the SNH peaks and it is not only based on Qin andSNH,0 , but also on SNH,5 . Qa is constrained from 0 to 309,720 m 3 /d and, in addition, its variations are also constrained to 26,000 m 3 /d between two samples (15 min) in order not to have abrupt changes.Qin has one mf (“high”), which is above the usual ranges of dry weather and, thus, the values of this mf happen when there is rainfall event. SNH,0 also has only one mf called “high” and Qa three mf (“low”, “medium” and “high”). Then, by fuzzy rules, when SNH,5 is increased close to the limit, Qa is reduced in order to increase the hydraulic retention time (HRT) and thus improve the nitrification process. On the other hand, when there is a Qin increase due to a rainfall and, at that time SNH,0 is “high” while SNH,5 is “low”, Qa is increased to dilute the SNH concentration (Fig. 4j). When the SNH peak reaches the aerobic reactors, detected as a result of SNH,5 being “high”, Qa is reduced. – 输入 SNH,5+SNO 3 5 没有作为约束添加到 fuzzy_1 的模糊规则中,因为这可能意味着通过减少 SO 来增加 N2O。
模糊_3。
在下面的模糊控制器应用中,Qa 添加为输出,而Qin 和SNH,0 添加为输入。 Qa的操纵旨在降低SNH峰值,它不仅基于Qin和SNH,0,而且基于SNH,5。 Qa 限制为 0 至 309,720 m 3 /d,此外,两个样本之间(15 分钟)其变化也限制为 26,000 m 3 /d,以免发生突变。Qin 有一个 mf(“高”) ),高于干燥天气的通常范围,因此,该 mf 值发生在降雨事件时。 SNH,0 也只有一个称为“高”的 mf,而 Qa 则有三个 mf(“低”、“中”和“高”)。然后,根据模糊规则,当SNH,5增加到接近极限时,Qa减小,以增加水力停留时间(HRT),从而改善硝化过程。另一方面,当因降雨而导致Qin增加并且此时SNH,0为“高”而SNH,5为“低”时,Qa增加以稀释SNH浓度(图4j)。当 SNH 峰值到达需氧反应器时(由于 SNH,5 为“高”而检测到),Qa 降低。Fuzzy_4. In fuzzy_4, qEC,1 is added as an output. This is intended to regulate the addition of qEC,1 instead of keeping it fixed at 2 m 3 /d. The addition of qEC improves the denitrification, significantly reducingSNO 3 values, but on the contrary, it increases the operational costs. In addition, although a slight decrease of N2O in denitrification can be produced when external carbon is added, the total GHG emissions are higher due to an increase in the endogenous respiration of biomass, in the sludge processing and in the chemical and energy use. Due to these reasons, fuzzy_4 aims to add carbon only in the cases where a reduction of SNtot,e is necessary. In this way, the value of qEC,1 added in fuzzy_4 is based on SNH,5+SNO 3 5 and its time derivative (Fig. 4k). In addition, Qin is also taken into account, since its value is increased when there is a rainfall, qEC,1 is also increased (Fig. 4l). – 模糊_4。在模糊_4 中,qEC,1 被添加为输出。这样做的目的是调节 qEC,1 的添加量,而不是将其固定在 2 m 3 /d。添加 qEC 可改善反硝化效果,显著降低 SNO 3 值,但相反却增加了运行成本。此外,虽然在添加外部碳时,反硝化过程中产生的 N2O 会略有减少,但由于生物质的内源呼吸、污泥处理以及化学和能源使用的增加,温室气体的总排放量会更高。基于这些原因,fuzzy_4 只在需要减少 SNtot,e 的情况下才添加碳。因此,模糊模型 4 中添加的 qEC,1 值基于 SNH,5+SNO 3 5 及其时间导数(图 4k)。此外,还考虑了 Qin 值,因为当降雨时,Qin 值会增加,qEC,1 也会增加(图 4l)。The value of qEC,1 is constrained from 0 to 5 m 3 /d. Five mf of the input SNH,5+SNO 3 5 are related to five mf of the output qEC,1 . In the case of d(SNH,5+SNO 3 5 )/dt, it has three mf and it is considered both to increase the values of qEC,1 and to reduce them. So, when the mf of Qin is not active because there is no rainfall, if d(SNH,5+SNO 3 5 )/dt is “medium”, the relationship betweenSNH,5+SNO 3 5 and qEC,1 is as follows: if S NH,5+SNO 3 5 is “low” then q EC,1 is “low”, if S NH,5+SNO 3 5 is “medium” then q EC,1 is “medium” and so on. In the event that d(SNH,5+SNO 3 5 )/dt is “high”, qEC,1 is previously increased to act in advance against SN tot,e limit violations. If d(SNH,5+SNO 3 5 )/dt is “low”, the value of qEC,1 is lower to save carbon costs. If Qin is “high”, the values of qEC,1 in relation to SNH,5+SNO3 5 and d(SNH,5+SNO 3 5 )/dt are also increased.Fuzzy_plantwide. – qEC,1 的值限制在 0 至 5 m 3 /d。输入 SNH,5+SNO 3 5 的五个 mf 与输出 qEC,1 的五个 mf 相关。在 d(SNH,5+SNO 3 5 )/dt 的情况下,它有三个 mf,既可以增加 qEC,1 的值,也可以减少 qEC,1 的值。因此,当 Qin 的 mf 因无降雨而不活跃时,如果 d(SNH,5+SNO 3 5 )/dt 为 “中等”,SNH,5+SNO 3 5 与 qEC,1 之间的关系如下:如果 S NH,5+SNO 3 5 为 “低”,则 q EC,1 为 “低”;如果 S NH,5+SNO 3 5 为 “中等”,则 q EC,1 为 “中等”,以此类推。当 d(SNH,5+SNO 3 5 )/dt 为 "高 "时,qEC,1 就会增加,以预先防止 SN tot,e 违反限值。如果 d(SNH,5+SNO 3 5 )/dt 为 “低”,则降低 qEC,1 值,以节约碳成本。如果 Qin 值为 “高”,则与 SNH,5+SNO3 5 和 d(SNH,5+SNO 3 5 )/dt 相关的 qEC,1 值也会增加。Finally, the fuzzy controller is fully implemented, which is called fuzzy_plantwide. The fuzzy_plantwide code is shown in Appendix A and a scheme of its fuzzy rules is in Appendix B. The last application of the fuzzy controller adds Qst as a manipulated variable. This is based on the product of Qin and SNH,in and its derivative with respect to time. The storage tank is responsible for regulating the amount of water that is recirculated from the dewatering to the primary settler. Although the amount of recirculated water is very low in comparison to the influent, its SNH is very high. First of all, the default operation of the storage tank has been partially modified. As explained in the previous section, in the default operation, when the water volume of the tank is below or equal to the minimum established value, all the flow leads into the tank whileQst is equal to 0. This has been modified in order to fill the tank if it is necessary. In such a way that all the flow is led by bypass if Qst is higher than the input flow. – 最后,模糊控制器被完全实现,称为 fuzzy_plantwide。fuzzy_plantwide 代码见附录 A,其模糊规则方案见附录 B。模糊控制器的最后一个应用增加了 Qst 作为操纵变量。它基于 Qin 和 SNH,in 的乘积及其相对于时间的导数。储水箱负责调节从脱水到初级沉淀器的再循环水量。虽然再循环水量与进水量相比非常低,但其 SNH 却非常高。首先,对储水罐的默认运行方式进行了部分修改。如上一节所述,在默认操作中,当储水罐的水量低于或等于最小设定值时,所有水流都会进入储水罐,同时 Qst 等于 0。这样,如果 Qst 大于输入流量,所有流量都会通过旁路导入。On the other hand, if the given Qst is lower than the input flow, Qst will be equal to the given value and the tank will be filled by the difference between the inlet and the out-let flow while the volume does not reach its maximum established value. Once the operation of the storage tank has been modified, fuzzy_plantwide controller aims to compensate the Qin·SNH,in peaks by reducing Qst . Conversely, when the values of Qin·SNH,in are lower,Qst is increased to empty the storage tank. Qst is constrained from 0 to 1500 m 3 /d. Both Qin ·SNH,in and Qst have five mf, whereas d(Qin·SNH,in )/dt has three mf. When d(Qin·SNH,in )/dt is “medium” the relationship between Qin ·SNH,in and Qst is completely reversed (if Q in ·S NH,in is “low” then Q st is “high”, if Q in ·S NH,in is “medium-low” then Q st is “medium-high”, etc). In the case of d(Qin·SNH,in )/dt is “low”, Qst is higher. Conversely, if d(Qin·SNH,in )/dt is “high”, the values of Qst are lower (Fig. 4m). – 另一方面,如果给定的 Qst 低于输入流量,则 Qst 将等于给定值,储水罐将由入口流量和出口流量的差额填满,而容积不会达到既定的最大值。一旦储水罐的运行方式发生改变,全平面模糊控制器就会通过降低 Qst 来补偿 Qin-SNH 的峰值。反之,当 Qin-SNH,in 值较低时,则增加 Qst 以清空储气罐。Qst 的限制范围为 0 至 1500 m 3 /d。Qin -SNH,in 和 Qst 均为 5 mf,而 d(Qin-SNH,in )/dt 为 3 mf。当 d(Qin-SNH,in )/dt 为 "中等 "时,Qin -SNH,in 和 Qst 之间的关系完全相反(如果 Q in -S NH,in 为 “低”,则 Q st 为 “高”,如果 Q in -S NH,in 为 “中低”,则 Q st 为 “中高”,等等)。如果 d(Qin-SNH,in )/dt 为 “低”,则 Qst 为 “高”。反之,如果 d(Qin-SNH,in )/dt 为 “高”,则 Qst 值较低(图 4m)。
4. Simulation results and discussion – 模拟与讨论
This section presents the simulation results and the discussion regarding the fuzzy controller. As well as in the previous section, the results have been analyzed for each one of the fuzzy controllers that have been implemented incrementally in order to observe the effects of the different inputs, outputs and fuzzy rules. Table 2 shows the results obtained with fuzzy_1, fuzzy_2, fuzzy_3, fuzzy_4 and fuzzy_plantwide, as well as the results of Santín et al. [28] and DCS. The latter has been used as reference for the percentage of improvement. The articles Flores-Alsina et al. [7,8] and Boiocchi et al. [38] also include the GHG emissions assessment, but they have not been considered for comparison because the first two articles use the original BSM2G and the last one uses BSM2 for Nitrous oxide (BSM2N). In the case of Barbu et al. [27] and Santín et al. [28], they are the only papers that use the same updated BSM2G as the present article. Although Barbu et al. [27] evaluates GHG emissions, it does not implement a specific control strategy to reduce them, resulting in higher GHG emissions than by applying DCS. Therefore, Barbu et al. [27] has neither been considered for comparison, since the main objective of the present article is the reduction and consequently, the first step before considering other criteria. – 本节介绍有关模糊控制器的模拟结果和讨论。与上一节一样,我们分析了逐步实施的每个模糊控制器的结果,以观察不同输入、输出和模糊规则的影响。表 2 显示了使用 fuzzy_1、fuzzy_2、fuzzy_3、fuzzy_4 和 fuzzy_plantwide 取得的结果,以及 Santín 等人 [28] 和 DCS 的结果。后者被用作计算改进百分比的参考。Flores-Alsina 等人[7,8] 和 Boiocchi 等人[38] 的文章也包括温室气体排放评估,但由于前两篇文章使用的是原始 BSM2G,而最后一篇文章使用的是 BSM2 for Nitrous oxide (BSM2N),因此没有将它们作为比较对象。Barbu 等人[27] 和 Santín 等人[28] 是唯一使用与本文相同的更新版 BSM2G 的论文。虽然 Barbu 等人[27]评估了温室气体排放,但并未实施具体的控制策略来减少温室气体排放,导致温室气体排放高于应用 DCS 的温室气体排放。因此,Barbu 等人的研究[27]没有作为比较对象,因为本文的主要目标是减少温室气体排放,因此是考虑其他标准之前的第一步。Effluent quality has been evaluated through the percentage of time of SN tot,e and SNH,e limit violations. Although the main objective in terms of quality is to keep contaminants below the established limits, EQI is also shown as a criterion to be compared. COD, TSS andBOD5 limit violations are not shown because they only occur on certain days when there is a bypass and this is not modified with the proposed fuzzy controller. Within the operational costs, there are shown those that have significant variations. These are especially AE and EC, but PE is also shown because Qa is regulated from fuzzy_3. Regarding the GHG emissions, in addition to the total CO 2 , the emissions of the sources that have significant variations with the proposed fuzzy controller are also shown. These are those produced in the biological treatment (total biotreatment), the CO 2 due to electric consumption minus the electric generation (Power credit) and the CO 2 generated from external carbon source production (EC_GHG). Among the GHG emissions produced in the biological treatment, they are shown those that have significant variations due to the application of the proposed fuzzy controller, which are the N 2O emissions and the CO 2 produced by the endogenous respiration of the biomass. – 通过违反 SN tot,e 和 SNH,e 限值的时间百分比来评估出水质量。虽然质量方面的主要目标是将污染物控制在既定限值以下,但 EQI 也作为一项标准进行比较。未显示违反 COD、TSS 和 BOD5 限值的情况,是因为这些情况只发生在有旁路的特定日子,而拟议的模糊控制器不会改变这种情况。在运行成本中,显示了有显著变化的成本。尤其是 AE 和 EC,但也显示了 PE,因为 Qa 是由模糊控制器 3 调节的。关于温室气体排放,除了总二氧化碳排放量外,还显示了在拟议模糊控制器中变化较大的排放源的排放量。这些排放源包括生物处理过程中产生的二氧化碳排放(生物处理总量)、电力消耗量减去发电量后的二氧化碳排放(电力积分)以及外部碳源产生的二氧化碳排放(EC_GHG)。在生物处理过程中产生的温室气体排放中,由于采用了拟议的模糊控制器而产生显著变化的是 N 2O 排放量和生物质内源呼吸产生的 CO 2 排放量。Figs. 5–11 show the evolution over time of the different input and output variables, as well as the evolution of some variables that give information about the objectives of the plant performance. They are shown only for two days in order to better observe the comparison between the different controllers and for both winter and summer days. This is because the behavior of the plant is different depending on temperature. There have been selected specific days to observe the effect of some concrete variables. Both the numerical results and the evolution of the variables over time are discussed below.Fuzzy_1. Table 2 shows how the N2O emissions in the biological treatment are reduced by 51.55% by applying fuzzy_1 compared to DCS. This is the most important factor in the reduction of GHG, but it is not the only one, since there is also a reduction of power credit, mainly due to a decrease in AE. In addition, among the results shown in the same table, in terms of effluent quality, it is worth highlighting the reductions of the SN tot,e and SNH,e violations. Regarding the operational costs, the reduction of OCI is mostly obtained due to an AE reduction. Figs. 5–8 allow the analysis of these numerical results shown in Table 2. The first three figures show SNH at the input, SO at the output, N2O at the output and KL a4 at the output for the third, fourth and fifth tanks. – 图 5-11 显示了不同输入和输出变量随时间的变化情况,以及一些可提供电站性能目标信息的变量的变化情况。为了更好地观察不同控制器之间的比较,图中只显示了两天的情况,以及冬季和夏季的情况。这是因为气温不同,电厂的表现也不同。为了观察一些具体变量的影响,我们选择了一些特定的日子。下面将讨论数值结果和变量随时间的变化。表 2 显示,与 DCS 相比,采用模糊_1 后,生物处理过程中的 N2O 排放量减少了 51.55%。这是减少温室气体的最重要因素,但不是唯一因素,因为还减少了电费,这主要是由于 AE 的减少。此外,在同一张表格中显示的结果中,在污水水质方面,值得强调的是 SN tot,e 和 SNH,e 违规行为的减少。在运营成本方面,OCI 的降低主要是由于 AE 的降低。通过图 5-8 可以对表 2 中的数值结果进行分析。前三幅图分别显示了第三、第四和第五个储气罐的输入 SNH、输出 SO、输出 N2O 和输出 KL a4。 Fig. 8 shows the SN tot,e and SNH,e time evolution. For all figures, two summer days and two winter days are shown. The summer days selected are those with higher N 2O emissions. And for the winter days a rainfall event has been selected that results in SNH,e and SNtot,e increases. The N2O reduction obtained is shown in Figs. 5–7 and it is mainly achieved in summer, because the emissions are much higher at high temperatures. Within the three reactors, the most problematic N 2O emissions occur in tank 3. Fig. 5a show an example of a large difference of N2O emissions between DCS and the fuzzy controllers. This is due to the fact that SO,3 with DCS is much lower, whereas SNH,2 is very similar, which produces a partial nitrification. In the case of the fourth tank (Fig. 6a), although the N 2O emissions are lower than in the third tank, larger peaks of N2O are also observed in DCS compared to fuzzy_1. However, in this case SO,4 is maintained at 2 mg/l with DCS and its value is higher than that obtained with fuzzy_1 during all the time. One possible reason is the high genera-tion of N2O in the third tank (N2O,3 ). In the last tank, during summer time (Fig. 7a), first it is observed that the values of SNH,4 are lower with DCS than with fuzzy_1. This is due to the higher values of SO,4 mentioned before, which result in a higher SNH oxidation. In addition, the values of SO,5 are also higher in DCS and consequently the N2O emissions are lower, although during the peaks of SNH,4 the differences are reduced and there is even an interval when SNH,4 is higher in DCS. In any case, the N2O emissions in the last tank are much lower compared to the fourth tank and above all compared to the third tank. During the summer periods the SNH,e values are low (Fig. 8a), this fact translates that the high SO,4 and SO,5 values obtained with DCS are unnecessary. – 图 8 显示了 SN tot,e 和 SNH,e 的时间变化。所有图均显示了两个夏季日和两个冬季日。所选的夏季日是 N 2O 排放量较高的日子。而冬季则选择了降雨事件,导致 SNH,e 和 SNtot,e 增加。图 5-7 显示了 N2O 的减少情况,主要是在夏季实现的,因为高温时的排放量要高得多。在三个反应器中,N2O 排放问题最严重的是 3 号罐。图 5a 显示了 DCS 和模糊控制器之间 N2O 排放量差异较大的一个例子。这是因为使用 DCS 的 SO,3 排放量要低得多,而 SNH,2 排放量则非常接近,从而产生了部分硝化。在第四个水箱中(图 6a),虽然 N2O 排放量比第三个水箱低,但与模糊控制器 1 相比,DCS 的 N2O 峰值更大。不过,在这种情况下,DCS 的 SO,4 值始终保持在 2 毫克/升,而模糊_1 的 SO,4 值则始终高于模糊_1。其中一个可能的原因是第三个水槽(N2O,3)中产生了大量的 N2O。在最后一个水槽中,在夏季(图 7a),首先观察到 DCS 的 SNH,4 值低于模糊_1。这是因为前面提到的 SO,4 值较高,导致 SNH 氧化较高。此外,DCS 的 SO,5 值也较高,因此 N2O 排放量也较低,尽管在 SNH,4 的峰值期间,差异有所减小,甚至有一段时间,DCS 的 SNH,4 值较高。无论如何,最后一个储气罐的 N2O 排放量比第四个储气罐低得多,尤其是比第三个储气罐低得多。在夏季,SNH,e 值较低 (图 8a),这就意味着 DCS 所获得的较高 SO,4 和 SO,5 值是不必要的。 In addition, high SO,5 values produce an increase in AE, resulting in increased costs and GHG emissions due to the electric consumption. Also, by the internal recirculation, high SO,5 values result in an excess of SO in the anoxic tanks and consequently in a deterioration of the denitrification process. Other important factors for the N2O emissions reduction are the inputs of dSNH /dt in the three aerobic tanks. In Figs. 5a, 6a and 7a it can be observed the fast SO increase at the beginning of the SNH peaks when an increase in its slope is detected. This fact is very important because if SO is not increased rapidly when SNH begins to increase, the result can be a significant rise of N2O . In cold periods, the N2O emissions are lower and the main difficulty is keeping SNH,e and SN tot,e below the established limits. The values of SO,3 obtained with fuzzy_1 are similar to those obtained with DCS (Fig. 5b), but with fuzzy_1 they are slightly lower whenSNH,2 is low and slightly higher when there is a peak of SNH,2 . The SO,4 and SO,5 values (Figs. 6b and 7b) are almost all the time lower with fuzzy_1 than with DCS, except when the SNH peak is increased more than usual, as happens on the day 422. As it can be observed in Fig. 8b, the discussed SO reduction by fuzzy_1 results in a SN tot,e reduction, as shown in the SNtot,e violations results in Table 2. – 此外,SO,5 值过高会导致 AE 增加,从而增加电力消耗成本和温室气体排放量。此外,通过内部再循环,高 SO,5 值会导致缺氧池中的 SO 过量,进而导致脱硝过程恶化。减少 N2O 排放的其他重要因素是三个好氧池中 dSNH /dt 的输入量。从图 5a、图 6a 和图 7a 中可以观察到,当检测到 SO 的斜率增加时,SNO 在 SNH 峰值开始时快速增加。这一事实非常重要,因为如果在 SNH 开始增加时 SO 没有快速增加,结果可能是 N2O 大量增加。在寒冷时期,N2O 排放量较低,主要困难在于将 SNH,e 和 SN tot,e 控制在既定限值以下。使用 fuzzy_1 得到的 SO,3 值与使用 DCS 得到的值相似(图 5b),但使用 fuzzy_1 时,当 SNH,2 较低时,SO,3 值略低,而当 SNH,2 达到峰值时,SO,3 值略高于 SNH,2。SO,4 和 SO,5 值(图 6b 和图 7b)在使用模糊_1 的情况下几乎一直低于使用 DCS 的情况,除非 SNH 峰值比平时增大,如 422 天。从图 8b 可以看出,模糊_1 降低 SO 值的结果是降低了 SNtot,e 值,如表 2 中的 SNtot,e 侵犯结果所示。 Referring to SNH,e , the values are higher most of the time in the case of fuzzy_1 than in the case of DCS because with lower SO values, less SNH is oxidized. However, during this time, SNH,e values are below the established limits. When there is a SNH peak, SO is increased when fuzzy_1 is applied, which decreases the time of theSNH,e violations, as shown in the results available in Table 2. In short, fuzzy_1 offers, with respect to DCS, a N2O reduction mainly due to the SO regulation in tank 3. In terms of effluent quality,SNtot,e and SNH,e violations have been greatly reduced. This is achieved by regulating SO of the aerobic tanks, increasing them when there is an SNH increase, and keeping them at low levels for the rest of the time, thus nitrifying less and therefore generating less SNO 3 and consequently less SNtot,e . Although the main objective is to keep pollutants below limits, EQI is also reduced. Finally, by applying fuzzy_1, the SO values are lower most of the time in comparison with DCS and this results in an AE decrease.Fuzzy_2. Table 2 shows that the main differences of the fuzzy_2 results compared to fuzzy_1 are the SNH,e and SNtot,e limits violations. Specifically, the largest reduction is obtained in the SNH,e limit violations, which are reduced by more than 14% compared to fuzzy_1. As previously discussed, the SNH,e and SN tot,e limits violations are more likely to occur at low temperatures. The performance of fuzzy_2 is shown in Fig. 8b and the variations in the SO manipulation are shown in Figs. 5b, 6b and 7b. When SNH,5 is “high” the fuzzy rules implemented in fuzzy_1 are overridden, and a “very_high” value ofSO of the aerobic reactors is added. – 至于 SNH,e,在大多数情况下,Fuzzy_1 的 SNH 值要高于 DCS,因为 SO 值越低,被氧化的 SNH 就越少。不过,在此期间,SNH,e 值低于规定的限值。如表 2 所示,当出现 SNH 峰值时,应用模糊_1 会增加 SO 值,从而减少 SNH,e 值超标的时间。简而言之,与 DCS 相比,fuzzy_1 可以减少 N2O,这主要归功于 3 号池的 SO 调节。在出水水质方面,SNtot,e 和 SNH,e 的违规情况大大减少。这是通过调节好氧池的 SO 来实现的,当 SNH 增加时,增加 SO,其余时间保持在较低水平,从而减少硝化,从而产生较少的 SNO 3,进而减少 SNtot,e。虽然主要目标是将污染物控制在限值以下,但 EQI 也会降低。最后,与 DCS 相比,采用模糊_1 后,SO 值在大多数情况下都会降低,从而导致 AE 下降。表 2 显示,与模糊_1 相比,模糊_2 结果的主要差异在于 SNH,e 和 SNtot,e 限值的违反。具体地说,SNH,e 极限违规的减少幅度最大,与模糊_1 相比减少了 14% 以上。如前所述,SNH,e 和 SN tot,e 极限违规更容易发生在低温条件下。图 8b 显示了模糊_2 的性能,图 5b、6b 和 7b 显示了 SO 操作的变化。当 SNH,5 为 "高 "时,fuzzy_1 中执行的模糊规则会被覆盖,同时好氧反应器的 SO 值也会 “非常高”。This is observed in the above referred figures, where the differences between fuzzy_1 and fuzzy_2 are only observed on day 422, where SO,3 , SO,4 and SO,5 have higher values with fuzzy_2, which coincides with a high SNH,5 peak. Consequently, the SNH,e peak is reduced (Fig. 8b). Another fuzzy rule added in fuzzy_2 allows a decrease in the values of SO when SNH,5 + SNO 3 5 is “high” as long as SNH,5 is not “high”. This effect is more difficult to be observed in the figures. However, by using fuzzy_2 it is possible to see that SO,3 , SO,4 and SO,5 are reduced faster after the SNH peak and, for a certain time interval, they are lower than in the case of fuzzy_1. This does not affect SN tot,e of day 422, since SO is increased prior to this moment, but there are other peaks during the year that are slightly reduced. These reductions are low, as it can be seen in the SNtot,e violations results in Table 2. Finally, in terms of operational costs, the SO increase when SNH,5 is “high” does not result in an AE increase, because these SO increases occur only rarely throughout the year and as a result of the slight SO reduction when SNH,5+SNO 3 5 is “high”. In fact, Table 2 shows that AE is even slightly lower with fuzzy_2 when compared to fuzzy_1.Fuzzy_3. The results of Table 2 show how the SNH,e violations are completely removed by means of fuzzy_3, while the other results are the same or have non-significant variations when compared to fuzzy_2. Fig. 9 allows its analysis with the example of day 422. Qa is mostly maintained at its default value. However, day 422 is an example where Qa is incremented and reduced from its default value. – 从上图可以看出,模糊_1 和模糊_2 之间的差异仅在第 422 天出现,在第 422 天,SO,3、SO,4 和 SO,5 在模糊_2 中的值较高,这与 SNH,5 的峰值较高相吻合。因此,SNH,e 峰值降低了(图 8b)。当 SNH,5 + SNO 3 5 为 "高 "时,只要 SNH,5 不是 “高”,模糊规则 2 中添加的另一条模糊规则就会使 SO 值降低。从图中很难观察到这种效果。不过,通过使用模糊_2 可以看到,在 SNH 达到峰值后,SO,3、SO,4 和 SO,5 下降得更快,而且在一定的时间间隔内,它们比模糊_1 的情况更低。这并不影响第 422 天的 SN tot,e,因为在此之前 SO 是增加的,但这一年中还有其他峰值略有减少。从表 2 中的 SNtot,e 违规结果可以看出,减少的幅度很小。最后,在运营成本方面,SNH,5 为 "高 "时,SO 的增加并不会导致 AE 的增加,因为这些 SO 的增加在全年中很少发生,而且是 SNH,5+SNO 3 5 为 "高 "时 SO 略有减少的结果。事实上,表 2 显示,与模糊_1.模糊_3 相比,模糊_2 的 AE 甚至略低。表 2 的结果表明,使用模糊_3 可以完全消除 SNH,e 的违规情况,而其他结果与模糊_2 相比则相同或变化不大。图 9 以第 422 天为例进行了分析。Qa 大部分保持在默认值。然而,在第 422 天,Qa 在默认值的基础上有增有减。When there is an increase of Qin due to a rainfall and there is also a SNH,0 peak, fuzzy_3 increases Qa in order to dilute SNH . This dilution is achieved because SNH,5 , which is recirculated, is lower than SNH,0 . Due to this reason, Qa is only increased in the case when SNH,5 is not “high”. On the other hand, increasing Qa results in a reduction of the hydraulic retention time and consequently the denitrification and nitrification processes worsen. Therefore, it has to be taken into account that the Qa manipulation aims to reduce the SNH,e violations and the nitrification process is the key factor to achieve that. Accordingly, when the SNH increase reaches the aerobic reactors, detected by a SNH,5 increase, fuzzy_3 decreases Qa in order to increase the hydraulic retention time and thus the aerobic reactors oxidize moreSNH . The result is observable in the reduction of the SNH,5 peak by the application of fuzzy_3 when compared to fuzzy_2. ConsequentlySNH,e is also reduced as it is shown in Fig. 8. The only important difference in fuzzy_3 is the elimination of theSNH,e limit violations. However, it can be observed that there is a slight reduction in the SN tot,e violations. This is because sometimes the conditions Qin is “high” and SNH,0 is “high” are met, but the SNH,5 peak fails to get the “high” value. Hence, Qa is increased, but subse-quently is not reduced below the default value. This fact causes moreSNO 3 to be denitrified and the aerobic reactors to generate less SNO 3 as a result of the hydraulic retention time being lower. Due to this reason, the PE mean is also slightly higher. However, these variations are practically negligible.Fuzzy_4. Table 2 shows the results obtained with fuzzy_4. In terms of effluent quality, a decrease of more than 5.57% in theSNtot,e limit violations is achieved (being near of the total removal), while EQI is slightly worsened. In reference to operating costs, EC is reduced with 31.73% that results in a OCI reduction of 9.63%. This reduction also results in a total GHG emissions reduction of 2.38%. Figs. 10 and 8 allow to analyze the mentioned results. Fig. 10 shows that the values of SNH,5+SNO 3 5 are lower in summer than in winter and, therefore, the values of qEC,1 obtained by fuzzy_4 are also lower. However, for both summer and winter, the values of qEC,1 are below the default value (2 mg/l) most of the time. This leads to higher SNH,5+SNO 3 5 and thus, higher SN tot,e values for most of the time by applying fuzzy_4 when compared to fuzzy_3. This is the reason for the slight EQI worsening. On the other hand, when there is a SNH,5+SNO 3 5 peak, qEC,1 is increased above 2 mg/l. Only in cases where the SNH,5+SNO 3 5 peak is much higher, as in the case of day 422, the qEC,1 increase by applying fuzzy_4 is high enough high to reduce it more than by using fuzzy_3. This is the reason for reducingSN tot,e limit violations. – 当降雨导致 Qin 值增加,同时 SNH,0 也出现峰值时,fuzzy_3 会增加 Qa 值,以稀释 SNH。由于再循环的 SNH,5 低于 SNH,0,因此可以实现稀释。因此,只有在 SNH,5 不 "高 "的情况下,Qa 才会增加。另一方面,增加 Qa 会导致水力停留时间缩短,从而使脱氮和硝化过程恶化。因此,必须考虑到调整 Qa 的目的是减少违反 SNH,e 的情况,而硝化过程是实现这一目的的关键因素。因此,当 SNH 增加到达好氧反应器时(由 SNH,5 的增加检测到),fuzzy_3 会降低 Qa,以增加水力停留时间,从而使好氧反应器氧化更多的 SNH。与模糊_2 相比,使用模糊_3 的结果是 SNH,5 峰值降低。如图 8 所示,SNH,e 也随之降低。模糊_3 的唯一重要区别是消除了对 SNH,e 极限的违反。不过,可以看出,SN tot,e 违规情况略有减少。这是因为有时会满足 Qin 为 "高 "和 SNH,0 为 "高 "的条件,但 SNH,5 峰值未能达到 "高 "值。因此,Qa 会升高,但随后不会降至默认值以下。由于水力停留时间较短,这一事实导致更多的 SNO 3 被反硝化,而好氧反应器产生的 SNO 3 较少。因此,PE 平均值也略高。不过,这些变化实际上可以忽略不计。表 2 显示了使用模糊模型 4 得出的结果。在出水水质方面,SNtot,e 违反限值的情况减少了 5.57%(接近总去除率),而 EQI 则略有下降。在运营成本方面,EC 降低了 31.73%,使 OCI 降低了 9.63%。同时,温室气体排放总量也减少了 2.38%。图 10 和图 8 对上述结果进行了分析。图 10 显示,夏季的 SNH,5+SNO 3 5 值低于冬季,因此模糊_4 得出的 qEC,1 值也较低。不过,无论是夏季还是冬季,qEC,1 的值在大多数情况下都低于默认值(2 毫克/升)。因此,与模糊模型 3 相比,采用模糊模型 4 的 SNH,5+SNO 3 5 值较高,因此 SN tot,e 值在大多数情况下也较高。这就是 EQI 略微恶化的原因。另一方面,当出现 SNH,5+SNO 3 5 峰值时,qEC,1 会增加到 2 mg/l 以上。只有在 SNH,5+SNO 3 5 峰值较高的情况下,如第 422 天的情况,应用模糊模型 4 所增加的 qEC,1 高于使用模糊模型 3 所减少的 qEC,1。这就是减少 SN tot,e 违反限值的原因。Therefore, fuzzy_4 increases qEC,1 only when it is necessary with the objective that SN tot,e si not exceed the established limit. Thus, fuzzy_4 gives more importance to the fact that the pollutants concentration is below the established limits than to their means. It is worth to note that the value of qEC,1 depends not only on SNH,5+SNO 3 5 but also on the input d(SNH,5+SNO 3 5 )/dt. Thus, ifSNH,5+SNO 3 5 increases with a high slope, qEC,1 is more rapidly increased in order to further reduce the SNH,5+SNO 3 5 peak. WhileSNH,5+SNO 3 5 decreases, qEC,1 is reduced more quickly to reduce costs. In addition, if there is a Qin increase due to a rainfall and there is a high SNH,5+SNO 3 5 slope, qEC,1 is rapidly increased to its maximum value without taking into account the SNH,5+SNO 3 5 value, as it can be observed on day 422 in Fig. 8. Finally, the fact that most of the time qEC,1 is below its default value explains the cost reduction obtained. Also, it results in a GHG emissions reduction due to a CO 2 generated from the EC production and from the endogenous respiration of biomass.Fuzzy_plantwide. The results in Table 2 show a decrease in theSN tot,e limit violations due to the reduction of their peaks, with the almost complete removal. They are only 4 times of violations throughout the year and they are due to a high Qin increase that results in the bypass from the influent to the effluent without being treated. The reduction of the SNH,e peaks is not reflected in the results since the SNH,e limit violations are completely removed in fuzzy_3. This SNtot,e and SNH,e peak reduction also leads to slight AE and EC reductions, which have repercussions on both cost and GHG emission reductions. The operation of Qst manipulation by fuzzy_plantwide controller is shown in Fig. 11. First, it is worth explaining that the liquid extracted from the sludge treatment is recirculated to the primary treatment and regulated by the storage tank. The flow rate of this liquid is very low compared to the influent. However, the reason forQst manipulation is the high value of SNH in the recirculated liquid, which can produce SNH increases in the biological treatment. ThisSNH increase has also results in the need for more SNH to be oxidized and thus more SNO 3 is generated, which results in a SNtot increase. Then, as it can be seen in Fig. 11, both in summer and winter, when there is a Qin ·SNH,in peak, Qst is reduced in order not to recirculate SNH . When the values of Qin·SNH,in are lower, Qst is increased in order to reduce the volume of the tank and thus to have it ready for the next Qin·SNH,in peak. – 因此,fuzzy_4 只在必要时才增加 qEC,1,目的是使 SN tot,e si 不超过规定限值。因此,模糊模型 4 更重视污染物浓度低于规定限值这一事实,而不是其平均值。值得注意的是,qEC,1 的值不仅取决于 SNH,5+SNO 3 5,还取决于输入 d(SNH,5+SNO 3 5 )/dt。因此,如果 SNH,5+SNO 3 5 以较高的斜率增加,qEC,1 就会更快地增加,以进一步降低 SNH,5+SNO 3 5 的峰值。当 SNH,5+SNO 3 5 下降时,qEC,1 会更快地下降,以降低成本。此外,如果降雨导致沁河水位上升,而 SNH,5+SNO 3 5 的斜率较高,qEC,1 会迅速增加到最大值,而不考虑 SNH,5+SNO 3 5 的值,如图 8 中第 422 天的情况。最后,qEC,1 大部分时间都低于默认值,这也是成本降低的原因。此外,由于 EC 生产和全厂生物质的内源呼吸产生了二氧化碳,因此温室气体排放量也有所减少。表 2 中的结果表明,由于峰值降低,违反 SN 总量限制的情况有所减少,几乎完全消除。全年仅有 4 次超标,原因是钦氏浓度增加过高,导致进水未经处理就旁流到出水。SNH,e 峰值的降低并没有反映在结果中,因为在 fuzzy_3 中,违反 SNH,e 限制的情况已完全消除。SNtot,e 和 SNH,e 峰值的降低也导致 AE 和 EC 的轻微降低,这对成本和温室气体减排都有影响。模糊全厂控制器对 Qst 的操作如图 11 所示。首先需要说明的是,从污泥处理中提取的液体会再循环到初级处理中,并由储罐进行调节。与进水相比,这些液体的流速非常低。然而,对 Qst 进行操作的原因是再循环液体中的 SNH 值较高,这会导致生物处理过程中的 SNH 增加。SNH 的增加也导致需要氧化更多的 SNH,从而产生更多的 SNO 3,导致 SNtot 增加。然后,从图 11 中可以看出,无论是夏季还是冬季,当出现 Qin -SNH,in 峰值时,Qst 都会降低,以避免 SNH 再循环。当 Qin-SNH,in 值较低时,Qst 会增大,以减少水箱容积,从而为下一个 Qin-SNH,in 峰值做好准备。This is seen in the evolution of the storage tank volume (Vst). Fig. 11 only shows the values obtained with fuzzy_plantwide controller because by using the previous fuzzy controllers and DCS, Qst is always kept at 0 and all the flow rate from the dewatering is led by bypass once the storage tank is full. The input d(Qin·SNH,in )/dt is similarly used as fuzzy_4 operates with d(SNH,5+SNO3 5 )/dt. Therefore, it is used to increase or decreaseQst more quickly based on the slope of Qin·SNH,in in order to act in advance. Focusing first on the results obtained in winter, Fig. 8b shows that the SNH,e and SNtot,e peak reductions are clearly observable. When Qst is increased during lower Qin·SNH,in values, SNH,e and SNtot,e are higher with fuzzy_plantwide compared to fuzzy_4. Thus, variations of SNH,e and SNtot,e with fuzzy_plantwide are smoother. Fig. 10b shows that less qEC,1 is required due to the SNtot,e peak reduction. In addition, Figs. 5b, 6b and 7b show that less SO is required to complete nitrification due to the reduction of the SNH peaks in each of the reactors. The qEC,1 and SO reductions result in reductions of operating costs and GHG emissions as shown in the results in Table 2. In the case of the summer period, due to the fact that the values of SNtot,e and SNH,e are lower, there is no risk of limit violations, at least during dry weather, and this increases their values with fuzzy_plantwide than with fuzzy_4 (Fig. 8a). The only drawback is the consequent qEC,1 increase during summer (Fig. 10a). Although there is a cost reduction with fuzzy_plantwide in the annual results, the Qst and/or qEC,1 manipulations could be improved during elevated temperatures in order to further reduce operating costs. On the other hand, the SNH peaks of the aerobic tanks are also reduced during the summer period and thus lower SO is also required (Figs. 5a, 6a and 7a). Regarding the stability of the fuzzy controller, although this is complex to be guaranteed from a mathematical point of view, it can be obtained through knowledge implementation. It has to be noticed that during the entire simulation period of 609 days (1 year of evaluation) no instability has been detected. Finally, although the use of ideal sensors is a valid option to compare control strategies, a simulation with fuzzy_plantwide adding noise and delay to the sensors has been performed. The complete removal of the SNH,e limit violations has been maintained. – 这可以从储水罐容积 (Vst) 的变化中看出。图 11 只显示了使用全厂模糊控制器得到的数值,因为使用之前的模糊控制器和 DCS 时,Qst 始终保持为 0,一旦储罐满了,所有脱水流量都由旁路引导。输入 d(Qin-SNH,in )/dt 与模糊控制器 d(SNH,5+SNO3 5 )/dt 类似。因此,可以根据 Qin-SNH,in 的斜率更快地增加或减少 Qst,以便提前采取行动。首先来看冬季的结果,图 8b 显示 SNH,e 和 SNtot,e 的峰值降低明显。当 Qst 在 Qin-SNH,in 值较低时增加时,与 fuzzy_4 相比,fuzzy_plantwide 的 SNH,e 和 SNtot,e 更高。因此,SNH,e 和 SNtot,e 随模糊全平面图的变化更加平滑。图 10b 显示,由于 SNtot,e 峰值降低,所需的 qEC,1 也减少了。此外,图 5b、6b 和 7b 显示,由于每个反应器中的 SNH 峰值降低,完成硝化所需的 SO 也减少了。如表 2 所示,qEC,1 和 SO 的减少导致了运行成本和温室气体排放量的降低。在夏季,由于 SNtot,e 和 SNH,e 的值较低,至少在干燥的天气下不会有违反限值的风险,这使得模糊全厂法的值比模糊 4 法的值要高(图 8a)。唯一的缺点是夏季 qEC,1 会随之增加(图 10a)。虽然从全年结果来看,使用全厂模糊法降低了成本,但在温度升高时,可以改进 Qst 和/或 qEC,1 的操作,以进一步降低运行成本。另一方面,好氧池的 SNH 峰值在夏季也会降低,因此也需要降低 SO(图 5a、6a 和 7a)。关于模糊控制器的稳定性,虽然从数学角度来看很难保证,但可以通过知识实施来实现。必须注意的是,在整个 609 天的模拟期间(1 年的评估),没有发现任何不稳定性。最后,尽管使用理想传感器是比较控制策略的一个有效选择,但还是进行了全厂模糊仿真,在传感器中加入了噪声和延迟。完全消除 SNH,e 极限违规的情况得以保持。The percentage of time of the SNtot,e limit violations increases slightly to 0.45%, but it is still a low time percentage. The percentages of improvement of EQI, OCI and CO 2 emissions compared to DCS are of 1.97%, 14.4% and 8.24% respectively. Although there are small changes in the percentages of improvement, they are still satisfactory. It is important to note that filters are usually applied, which attenuate the noise signal. In addition, the controller parameters should be adjusted after an analysis of the sensor signals. – 违反 SNtot,e 限制的时间百分比略有增加,为 0.45%,但时间百分比仍然较低。与 DCS 相比,EQI、OCI 和 CO 2 排放的改善百分比分别为 1.97%、14.4% 和 8.24%。虽然改善百分比变化不大,但仍然令人满意。值得注意的是,通常会使用滤波器来减弱噪声信号。此外,还应在分析传感器信号后调整控制器参数。


![在这里插入图片描述 [在这里插入图片描述]](https://i-blog.csdnimg.cn/blog_migrate/8b78cb5f016a6b4e73818b8e572412d3.png)


5. Conclusions – 结论
This paper has presented the implementation of a fuzzy controller for the plant-wide control of biological wastewater treatment processes with the objectives of reducing GHG emissions, SN tot,e and theSNH,e limits violations and operational costs (AE and EC). The implementation of three PI controllers have also been required in order to track the SO set-points given by the fuzzy controller. The following points summarize the results obtained with the proposed control strategy:• It is possible to reduce GHG emissions by manipulating the SO setpoints of the aerobic reactors, based on the SNH at the entrance of each reactor, avoiding partial nitrification. In addition, with the same regulation it is also possible to improve the effluent quality and to reduce operational costs.• The manipulation of the SO set-points taking also into accountSNH,5 as an input allows the fuzzy controller a slight reduction of the SNH,e peaks when these are higher than usually. In addition, the SNO3 5+SNH,5 measurement allows to slightly reduce the SNtot,e peaks when there is no risk of SNH,e violation or GHG increase.• The manipulation of Qa allows the SNH,e reduction when it is necessary. For this purpose, Qa is manipulated, increasing it to diluteSNH at the input of the biological treatment or decreasing it to increase the hydraulic retention time.• Increasing qEC,1 when SNO 3 5+SNH,5 increases allows to avoid theSN tot,e limit violations. Decreasing qEC,1 for the remaining time results in a reduction of GHG emissions and costs.• The regulation of Qst based on the influent, specifically based onQin·SNH,in , allows to significantly reduce the SN tot,e and SNH,e peaks.• The derivatives of some fuzzy controller inputs with respect to time allow better regulation when acting in advance. Especially in the case of the SO set-points, to avoid large GHG increases.• To carry out a sensitivity analysis is an objective as a future work, to analyze the influence of the plant parameter variations in the results obtained with the proposed control strategies. Finally, satisfactory results have been obtained by applying the proposed fuzzy controller, which allowed achieving the objectives to reduce GHG emissions, to improve the effluent quality and to reduce operational cost. – 本文介绍了一种用于全厂生物废水处理工艺控制的模糊控制器的实施情况,其目标是减少温室气体排放、SN tot,e和SNH,e限值违规以及运营成本(AE和EC)。为了跟踪模糊控制器给出的 SO 设定点,还需要执行三个 PI 控制器。根据每个反应器入口处的 SNH,通过调节好氧反应器的 SO 设定值,可以减少温室气体排放,避免部分硝化。此外,通过同样的调节,还可以改善出水水质并降低运行成本。 - 在调节 SO 设定点时,还将 SNH,5 作为输入因素,当 SNH,e 峰值高于通常值时,模糊控制器可将其略微降低。此外,当 SNO3 5+SNH,5 测量值不存在违反 SNH,e 或增加温室气体的风险时,可略微降低 SNtot,e 峰值。为此,可通过增加 Qa 来稀释生物处理输入端的 SNH,或减少 Qa 来增加水力停留时间。在剩余时间内降低 qEC,1 可减少温室气体排放量和成本。 - 根据进水量,特别是根据 Qin-SNH,in 来调节 Qst,可显著降低 SN tot,e 和 SNH,e 峰值。特别是在 SO 设定点的情况下,可以避免温室气体的大量增加。 - 敏感性分析是未来工作的一个目标,目的是分析电厂参数变化对所提控制策略结果的影响。最后,应用所提出的模糊控制器取得了令人满意的结果,实现了减少温室气体排放、提高出水质量和降低运行成本的目标。
Acknowledgment –
This work was supported by the the Spanish MINECO/FEDER grant DPI2016-77271-R. Lund University and Technical University of Denmark are gratefully acknowledged for providing the BSM2G Matlab/Simulink code, with a special mention for Dr. Flores Alsina and Dr. Ulf Jeppsson.


 1028
1028

 被折叠的 条评论
为什么被折叠?
被折叠的 条评论
为什么被折叠?
 到【灌水乐园】发言


