


需求
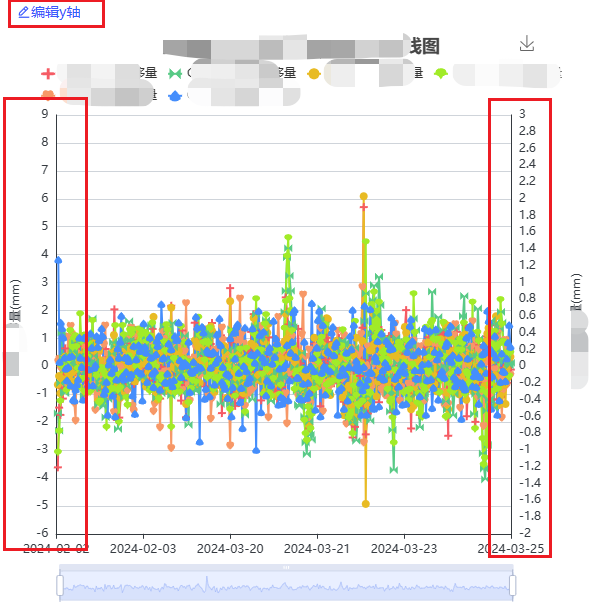
Echarts 添加多个 Y 轴并可对 Y 轴的最大最小值进行自定义编辑
分析
1. 多个Y轴
多个Y轴就会生成Y主轴和Y次轴,这时候只需要我们对接到的数据进行处理就可以,判断是否含有次轴,如果包含次轴,就展示次轴,否则只展示主轴【那么有多个主轴多个次轴应该怎么办?】,通用方法写在如下:
yAxis: data.ySecond
? [
    {
        type: 'value',
        name: getYAxis(data.yMain).str,
        nameLocation: 'middle',
        nameTextStyle: {
            color: '#343A40',
            fontSize: 12,
            padding: -20,
        },
        interval: null,
        axisPointer: {
            snap: true
        },
        scale: true, // 自适应
        axisLabel: {
            color: '#343A40'
        },
        nameGap: 0,
        splitLine: {
            lineStyle: { color: '#CED4DA' } // x轴坐标轴颜色
        },
        axisLine: {
            show: true,
            lineStyle: { color: '#343A40' } // x轴坐标轴颜色
        },
        min: getMin1,
        max: getMax
    },
    {
        type: 'value',
        name: data.ySecond
            ? getYAxis(data.ySecond).str
            : '',
        splitLine:
            data.yMain.length > 0
                ? {
                    show: false
                }
                : {
                    lineStyle: { color: '#343A40' } // x轴坐标轴颜色
                },
        nameLocation: 'middle',
        nameGap: 0,
        nameTextStyle: {
            color: '#343A40',
            padding: 10,
            fontSize: 12
        },
        interval: null,
        axisPointer: {
            snap: true
        },
        axisLabel: {
            color: '#343A40'
        },
        axisLine: {
            show: true,
            lineStyle: { color: '#343A40' } // x轴坐标轴颜色
        },
        min: getMin2,
        max: getMax
    }
]
: [
    {
        type: 'value',
        name: getYAxis(data.yMain).str,
        nameLocation: 'middle',
        nameTextStyle: {
            color: '#343A40',
            fontSize: 12
        },
        interval: null,
        axisPointer: {
            snap: true
        },
        scale: true, // 自适应
        axisLabel: {
            color: '#343A40'
        },
        nameGap: 0,
        splitLine: {
            lineStyle: { color: '#CED4DA' } // x轴坐标轴颜色
        },
        axisLine: {
            show: true,
            lineStyle: { color: '#343A40' } // x轴坐标轴颜色
        },
        min: getMin1,
        max: getMax
    }
],
2. 对Y轴的展示范围进行可自定义编辑
首先写一个弹框可以配置该范围,其次,在修改时,让数据进行重新绘制,并把此时设置的Y轴的范围写入option即可,全部代码如下:
<template>
<div class="container my-container">
<a-spin :loading="loading" tip="加载中...">
<a-card style="height:760px">
<a-tabs :active-key="activeKey" @change="handleClick">
<a-tab-pane key="1" name="pone">
<template #title> <icon-home /> 过程线图</template>
<a-empty v-if="!historyList.testPointIdList" />
<template v-else>
<div class="handel-item">
<div class="label">Y主轴:</div>
<div class="component">
<a-checkbox-group v-model="checkYAxis.yzhuzhou" @change="changeYzhuzhou">
<a-checkbox v-for="item in YList.yzhuzhou" :key="item.id" :value="item"
:disabled="item.disabled">
{{ item.physicalQuantityName }}
</a-checkbox>
</a-checkbox-group>
</div>
</div>
<div class="handel-item">
<div class="label">Y次轴:</div>
<div class="component">
<a-checkbox-group v-model="checkYAxis.ycizhou" @change="changeYcizhou">
<a-checkbox v-for="item in YList.ycizhou" :key="item.id" :value="item"
:disabled="item.disabled">
{{ item.physicalQuantityName }}
</a-checkbox>
</a-checkbox-group>
</div>
</div>
</template>
<a-button type="text" v-if="testPointList.length > 0" @click="editYVisible = true">
<icon-edit />
编辑y轴
</a-button>
<chart :chartData="chartData" />
</a-tab-pane>
<a-tab-pane key="2" name="ptwo">
<template #title> <icon-home /> 相关图</template>
<!-- <ptwo v-if="activeKey === '2'" /> -->
</a-tab-pane>
<a-tab-pane key="3" name="pthree">
<template #title> <icon-home /> 分布图</template>
<!-- <ptwo v-if="activeKey === '2'" /> -->
</a-tab-pane>
</a-tabs>
</a-card>
</a-spin>
<a-modal v-model:visible="editYVisible" @Ok="handleEditY" :mask-closable="false" title="编辑 Y 轴" :width="400">
<a-radio-group v-model="radioValue" style="margin:0 auto; margin-bottom: 10px;text-align: center;">
<a-radio value="0">默认</a-radio>
<a-radio value="1">自定义</a-radio>
</a-radio-group>
<a-form :model="formY" auto-label-width v-if="radioValue == '1'">
<a-form-item label="Y轴最大值" label-col-flex="80px">
<a-input-number v-model="formY.mainParams.max" placeholder="请输入Y轴最大值" />
</a-form-item>
<a-form-item label="Y轴最小值" label-col-flex="80px">
<a-input-number v-model="formY.mainParams.min" placeholder="请输入Y轴最小值" />
</a-form-item>
<a-form-item label="Y轴间隔值" label-col-flex="80px">
<a-input-number v-model="formY.mainParams.interval" placeholder="请输入Y轴间隔值" />
</a-form-item>
<a-form-item label="Y次轴最大值" label-col-flex="80px">
<a-input-number v-model="formY.secondParams.max" placeholder="请输入Y次轴最大值" />
</a-form-item>
<a-form-item label="Y次轴最小值" label-col-flex="80px">
<a-input-number v-model="formY.secondParams.min" placeholder="请输入Y次轴最小值" />
</a-form-item>
<a-form-item label="Y次轴间隔值" label-col-flex="80px">
<a-input-number v-model="formY.secondParams.interval" placeholder="请输入Y次轴间隔值" />
</a-form-item>
</a-form>
</a-modal>
</div>
</template>
<script lang="ts" setup>
import { onMounted, ref, reactive, watchEffect, toRefs, watch, computed } from 'vue';
import {
getYZhou,
getchartCgq,
} from '@/api/running-attention';
import chart from "./chart.vue";
import Safe from "../../../dashboard-info/monitor/components/left/components/safe.vue";
import { Message } from '@arco-design/web-vue';
import { svgPath, randomColor } from '@/utils/echsrts'
const props = defineProps({
//子组件接收父组件传递过来的值
historyList: Object,
})
//使用父组件传递过来的值
const { historyList } = toRefs(props)
const data = ref({})
const loading = ref()
watch(historyList, (newVal) => {
if (newVal) {
data.value = { ...newVal }
getYList(data.value)
}
}, { deep: true })
const activeKey = ref('1');
function handleClick(data) {
activeKey.value = data;
}
/**
* @description : 获取chart数据
* @author : 'Hukang'
* @param : ''
* @date : 2024-03-27 10:46:53
*/
const chartData = ref({})
function getYAxis(yArr, baseRange = 100, k = 25) {
return {
str: yArr.map(item => item + '\n\n').join(''),
deviation: yArr.length * k + baseRange
}
}
const maxminList = ref({
max1: 0,
max2: 0,
min1: 0,
min2: 0,
})
// 获取要切割3行索引
function getLegendSliceIndex(list) {
const row = 130
const newList = []
let sumLen = 0
list.forEach((str, index) => {
sumLen += str.length
const obj = {
str,
strLen: str.length,
sumLen
}
newList.push(obj)
})
// 要返回的最大索引
const maxIndex = newList.findIndex(item => item.sumLen > row)
if (maxIndex === -1) {
return maxIndex
} else {
return maxIndex // 安全索引-1
}
}
function getMax(v) {
return v.max
}
function getMin1(v) {
maxminList.value.max1 = v.max
maxminList.value.min1 = v.min
return v.min
}
function getMin2(v) {
maxminList.value.max2 = v.max
maxminList.value.min2 = v.min
return v.min
}
// 通过y轴数值让y轴物理量自适应
function changeYNameGapAuto() {
const len1 = Math.max(String(maxminList.value.max1).length, String(maxminList.value.min1).length)
const len2 = Math.max(String(maxminList.value.max2).length, String(maxminList.value.min2).length)
chartData.value.yAxis[0].nameGap = len1 * 5 + 5
if (chartData.value.yAxis[1]) { chartData.value.yAxis[1].nameGap = 25 + len2 * 5 }
}
function intellect() {
const v1 = Math.ceil((maxminList.value.max1 - maxminList.value.min1) / 10)
chartData.value.yAxis[0].max = Math.ceil(maxminList.value.max1 + v1)
chartData.value.yAxis[0].min = Math.ceil(maxminList.value.min1 - v1)
if (chartData.value.yAxis[1]) {
const v2 = Math.ceil((maxminList.value.max2 - maxminList.value.min2) / 10)
chartData.value.yAxis[1].max = Math.ceil(maxminList.value.max2 + v2)
chartData.value.yAxis[1].min = Math.ceil(maxminList.value.min2 - v2)
}
}
function getSplitNumber(params) {
function changeInterval(max, min) {
let splitNumber = 0
let interval = 0
const dLIncrement = parseInt(max - min)
if (!params) {
if (dLIncrement >= 3 && dLIncrement <= 9) {
interval = 1
} else if (dLIncrement == 1 || dLIncrement == 2) {
interval = 0.2
} else if (dLIncrement == 0) {
interval = null
} else {
splitNumber = 7
interval = parseInt(dLIncrement / splitNumber)
}
} else {
if (params.sign == 'main') {
interval = params.mainParams.interval
} else {
interval = params.secondParams.interval
}
}
return interval
}
if (!params) {
chartData.value.yAxis[0].interval =
changeInterval(maxminList.value.max1, maxminList.value.min1) || 100
if (chartData.value.yAxis[1]) {
chartData.value.yAxis[1].interval =
changeInterval(maxminList.value.max2, maxminList.value.min2) || 100
}
} else {
if (params.sign == 'main') {
chartData.value.yAxis[0].interval =
changeInterval(maxminList.value.max1, maxminList.value.min1) || 100
} else {
chartData.value.yAxis[1].interval =
changeInterval(maxminList.value.max2, maxminList.value.min2) || 100
}
}
}
function getData(data) {
const sliceIndex = getLegendSliceIndex(data.legend)
const option = {
title: {
text: data.title,
top: 5,
left: 'center',
color: '#4F5052',
fontWeight: 'bold',
fontSize: 16 // 主题文字字体大
},
legend: {
type: 'plain',
data:
sliceIndex === -1
? data.legend
: data.legend.slice(0, sliceIndex),
inactiveColor: '#fff',
itemWidth: 14,
itemHeight: 14,
top: '6%',
height: 400,
align: 'left',
fontSize: 14, // 字体大小
color: '#4F5052'
},
tooltip: {
trigger: 'axis',
height: '50px',
padding: [15, 15],
enterable: true, // 滚动条
extraCssText: 'max-width:60%;max-height:83%; overflow: auto; ', // 滚动条
color: 'white', // 设置文字颜色
fontSize: 14,
axisPointer: {
},
},
grid: {
left: getYAxis(data.yMain, 10).deviation,
top: '15%',
bottom: '9%',
containLabel: true
},
toolbox: {
show: true,
feature: {
saveAsImage: {
excludeComponents: ['dataZoom', 'toolbox'],
title: '点击保存'
}
},
right: '10%', // 从右边缘的距离
},
xAxis: {
type: 'category',
boundaryGap: false,
axisTick: {
alignWithLabel: true
},
axisLine: {
onZero: false,
lineStyle: { color: ' #343A40' } // x轴坐标轴颜色
},
axisLabel: {
margin: 10,
showMaxLabel: true, // 显示最大刻度
color: '#343A40',
formatter: (value, index) => {
return value.replace(/(\d{4})-(\d{1,2})-(\d{1,2}).*/, '$1-$2-$3')
}
},
data: data.xAxisData
},
yAxis: data.ySecond
? [
{
type: 'value',
name: getYAxis(data.yMain).str,
nameLocation: 'middle',
nameTextStyle: {
color: '#343A40',
fontSize: 12,
padding: -20,
},
interval: null,
axisPointer: {
snap: true
},
scale: true, // 自适应
axisLabel: {
color: '#343A40'
},
nameGap: 0,
splitLine: {
lineStyle: { color: '#CED4DA' } // x轴坐标轴颜色
},
axisLine: {
show: true,
lineStyle: { color: '#343A40' } // x轴坐标轴颜色
},
min: getMin1,
max: getMax
},
{
type: 'value',
name: data.ySecond
? getYAxis(data.ySecond).str
: '',
splitLine:
data.yMain.length > 0
? {
show: false
}
: {
lineStyle: { color: '#343A40' } // x轴坐标轴颜色
},
nameLocation: 'middle',
nameGap: 0,
nameTextStyle: {
color: '#343A40',
padding: 10,
fontSize: 12
},
interval: null,
axisPointer: {
snap: true
},
axisLabel: {
color: '#343A40'
},
axisLine: {
show: true,
lineStyle: { color: '#343A40' } // x轴坐标轴颜色
},
min: getMin2,
max: getMax
}
]
: [
{
type: 'value',
name: getYAxis(data.yMain).str,
nameLocation: 'middle',
nameTextStyle: {
color: '#343A40',
fontSize: 12
},
interval: null,
axisPointer: {
snap: true
},
scale: true, // 自适应
axisLabel: {
color: '#343A40'
},
nameGap: 0,
splitLine: {
lineStyle: { color: '#CED4DA' } // x轴坐标轴颜色
},
axisLine: {
show: true,
lineStyle: { color: '#343A40' } // x轴坐标轴颜色
},
min: getMin1,
max: getMax
}
],
dataZoom: [
{
show: true,
type: 'slider',
handleSize: 32, // 两边的按钮大小
},
{
type: 'inside'
}
],
series: []
}
const series = []
data.series.forEach((item, index) => {
const obj = {
name: item.name,
type: 'line',
data: item.data,
symbol: 'path://' + svgPath(index),
color: randomColor(index),
yAxisIndex: item.yAxisIndex || 0,
showSymbol: true,
showAllSymbol: true,
symbolSize: 8
}
series.push(obj)
})
option.series = series
setTimeout(() => {
changeYNameGapAuto()
intellect()
getSplitNumber()
})
chartData.value = option
}
const editYChartData = ref({})
function getChartData() {
loading.value = true
const tempData = {
...data.value,
...checkYAxis.value
}
getchartCgq(tempData).then(res => {
getData(res.data)
editYChartData.value = res.data
loading.value = false
})
}
/**
* @description : 获取 Y主轴和Y次轴的list列表信息
* @author : 'Hukang'
* @param : ''
* @date : 2024-03-27 10:25:28
*/
const YList = ref({
yzhuzhou: [],
ycizhou: [],
})
const checkYAxis = ref({
yzhuzhou: [],
ycizhou: []
})
// Y 主轴变化影响 Y 次轴的改变
function changeYzhuzhou(newV) {
// 初始化
YList.value.ycizhou.forEach(item => {
item.disabled = false;
});
newV.forEach(ele => {
YList.value.ycizhou.forEach(item => {
if (ele.id === item.id) {
item.disabled = true;
}
});
});
getChartData()
}
function changeYcizhou(newV) {
YList.value.yzhuzhou.forEach(item => {
item.disabled = false;
});
newV.forEach(ele => {
YList.value.yzhuzhou.forEach(item => {
if (ele.id === item.id) {
item.disabled = true;
}
});
});
getChartData()
}
const testPointList = ref([])
// 获取列表信息
function getYList(data) {
const { testPointIdList } = data
testPointList.value = testPointIdList
getYZhou({ testPointIdList: testPointIdList.toString() }).then(res => {
let newV = res.data;
function initYAxis() {
const copyYAxis = { ...newV };
copyYAxis.yzhuzhou.forEach(item => {
item.disabled = false
});
copyYAxis.ycizhou.forEach(item => {
item.disabled = false
});
YList.value = copyYAxis;
// 绑定第一项
checkYAxis.value.yzhuzhou[0] = YList.value.yzhuzhou[0]
changeYzhuzhou(checkYAxis.value.yzhuzhou)
}
initYAxis()
})
}
/**
* @description : Y轴编辑
* @author : 'Hukang'
* @param : ''
* @date : 2024-04-02 09:12:19
*/
const editYVisible = ref(false)
const radioValue = ref('0')
const formY = ref({
mainParams: {
max: 10,
min: 0,
interval: 1
},
secondParams: {
max: 10,
min: 0,
interval: 1
}
})
function getYInfo({ mainParams, secondParams }) {
if (radioValue.value === '1') {
const mainYAxis = chartData.value.yAxis[0]
const secondYAxis = chartData.value.yAxis[1]
const mainRelyOn = {
max: getMax,
min: getMin1
}
const secondRelyOn = {
max: getMax,
min: getMin2
}
function changeYInfo(target, type, params) {
for (const key in params) {
const value = params[key]
if (typeof value === 'function') {
target[key] = type === 'main' ? mainRelyOn[key] : secondRelyOn[key];
} else {
target[key] = value;
}
}
}
changeYInfo(mainYAxis, 'main', mainParams)
getSplitNumber({ mainParams, sign: 'main' })
if (secondYAxis) {
changeYInfo(secondYAxis, 'second', secondParams)
getSplitNumber({ secondParams, sign: 'second' })
}
} else {
getData(editYChartData.value)
}
}
function handleEditY() {
let getStrByKey = function (keyType, key) {
return key === 'max' ? `${keyType}最大值` : `${keyType}最小值`
}
const params = {
mainParams: { ...formY.value.mainParams },
secondParams: { ...formY.value.secondParams },
type: radioValue.value
}
let changeParams = function (type, obj, keyType) {
let isCheck = true
for (const key in obj) {
if (type === '1') {
if (obj[key] === undefined) {
Message.warning(`${getStrByKey(keyType, key)}不能为空`)
isCheck = false
break
}
} else {
obj[key] = type === '0' ? null : function (fn) { return fn }
}
}
return isCheck
}
if (radioValue.value === '1') {
if (formY.value.mainParams.interval === undefined) {
return Message.warning(`必须设置y主轴间隔`)
}
if (checkYAxis.value.ycizhou.length && formY.value.secondParams.interval === undefined) {
return Message.warning(`必须设置y次轴间隔`)
}
if (!changeParams(radioValue.value, params.mainParams, 'Y主轴')) return
if (formY.value.mainParams.min >= formY.value.mainParams.max) {
return Message.warning(`y主轴最小值必须小于最大值`)
}
if (!changeParams(radioValue.value, params.secondParams, 'y次轴')) return
if (formY.value.secondParams.min >= formY.value.secondParams.max) {
return Message.warning(`y次轴最小值必须小于最大值`)
}
if (formY.value.mainParams.interval >= (formY.value.mainParams.max - formY.value.mainParams.min)) {
return Message.warning(`y主轴间隔超出区间范围`)
}
if (formY.value.secondParams.interval >= (formY.value.secondParams.max - formY.value.secondParams.min)) {
return Message.warning(`y次轴间隔超出区间范围`)
}
} else {
changeParams(radioValue.value, params.mainParams)
changeParams(radioValue.value, params.secondParams)
}
getYInfo(params)
editYVisible.value = false
changeParams = null
getStrByKey = null
}
const fetchData = () => {
}
onMounted(() => {
fetchData()
});
</script>
<style scoped lang="less">
.wrapper {
padding-top: 5px;
}
.handel-item {
display: flex;
margin: 10px;
font-size: 14px;
.label {
color: #343A40;
}
}
</style>
3. 调整的name属性更改位置
 yAxis: [
            {
                name: '',
                type: "value",
                axisTick: {
                    show: false
                },
                nameTextStyle: {
                    color: "#ffffff",
                    fontSize: 12,
                    padding: [0, 0, 0, 75]    // 四个数字分别为上右下左与原位置距离
                },
                axisLine: {
                    show: false,
                    lineStyle: {
                        color: "#ffffff"
                    }
                },
                axisLabel: {
                    color: "#ffffff",
                    fontSize: 12
                },
                splitLine: {
                    lineStyle: {
                        type: "dashed", //虚线
                        color: "rgba(255,255,255,0.2)"
                    },
                    show: true //隐藏
                },
                min(v) {
                    return v.min
                }
            }
        ],


 3764
3764


 被折叠的 条评论
为什么被折叠?
被折叠的 条评论
为什么被折叠?
 到【灌水乐园】发言


