


 x_min, x_max = df[['Height']].values.min() - 1.0, df[['Height']].values.max() + 1.0y_min, y_max = df[['Weight']].values.min() - 1.0, df[['Weight']].values.max() + 1.0step_size = 0.2x_values, y_values = np.meshgrid(np.arange(x_min,x_max,step_size), ...
x_min, x_max = df[['Height']].values.min() - 1.0, df[['Height']].values.max() + 1.0
y_min, y_max = df[['Weight']].values.min() - 1.0, df[['Weight']].values.max() + 1.0
step_size = 0.2
x_values, y_values = np.meshgrid(np.arange(x_min,x_max,step_size),
np.arange(y_min,y_max,step_size))
mesh_output = classifier.predict(np.c_[x_values.ravel(),y_values.ravel()])
mesh_output = mesh_output.reshape(x_values.shape)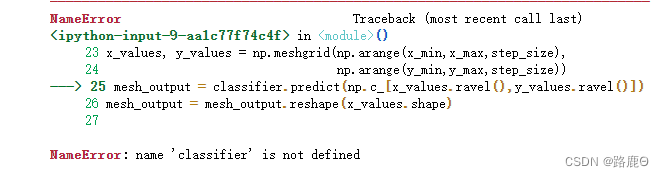
没定义?那就给它定义 一下
def plot_classifier(classifier,x,y):
x_min, x_max = df['Height'].values.min()-1.0, df['Height'].values.max()+1.0
y_min, y_max = df['Weight'].values.min()-1.0, df['Weight'].values.max()+1.0
step_size = 0.2
x_va
 最低0.47元/天 解锁文章


 1114
1114


 被折叠的 条评论
为什么被折叠?
被折叠的 条评论
为什么被折叠?
 到【灌水乐园】发言


